Weather on Any Date Guide: Historical Daily Lookup & Export
Open the World Weather on Any Date Explorer US 4.6 km Grid (1951+)
Quick start
- Open the World Weather on Any Date Explorer — Central Park, New York City (
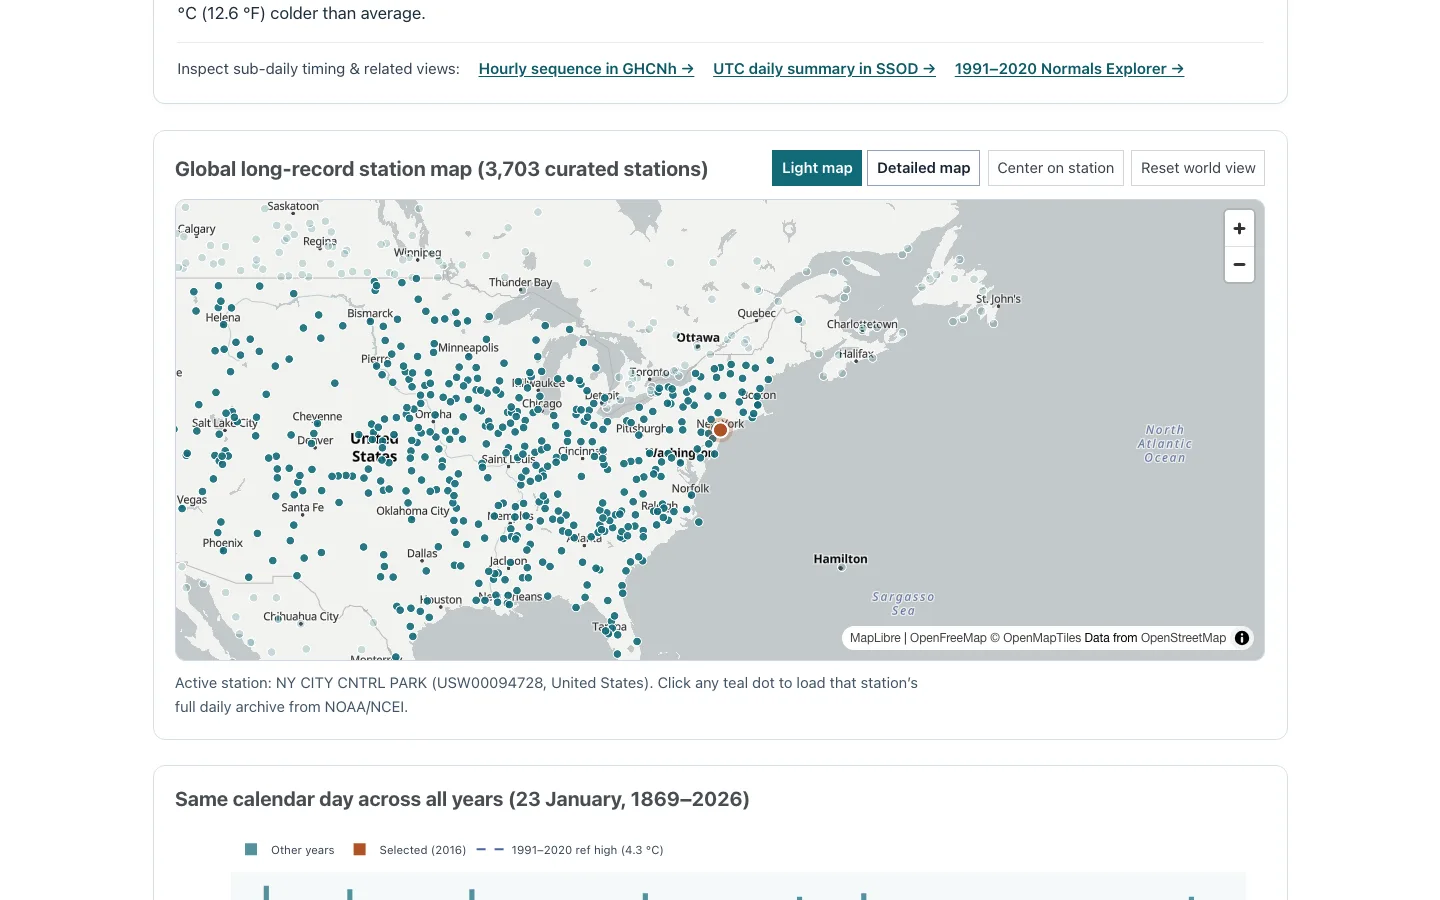
23 January 2016) is pre-loaded immediately without waiting for network fetches. (Looking for gridded U.S. surfaces? Switch to the US Weather Grid Explorer and its companion guide.) - Filter by Country or territory (optional) and type a city, airport, or 11-character GHCN identifier into Station, city, or GHCN ID, or click any station marker on the map.
- Choose any calendar date (
YYYY-MM-DD) using the date picker or step across days and decades with ← Previous day, Next day →, −1 year, and +1 year. - Switch Charts & tables between
°C, mmand°F, inas needed; the main summary card and downloadable PNG always display both unit systems simultaneously. - Click Save Day Card (PNG) for a shareable
1200×630card, Download CSV for spreadsheet analysis, or inspect any station’s All-time daily extremes row to jump directly to a record date.
1. Independent interface & data provenance
Climate Explorer is an independent data interface and is not affiliated with NOAA or any national meteorological service. When you select a station in Weather on Any Date, your browser streams that station’s original public-domain .csv.gz archive directly from NOAA/NCEI GHCN-Daily via NOAA’s official Open Data mirror (noaa-ghcn-pds on AWS S3, with automatic www.ncei.noaa.gov fallback; CC0 1.0). Because decompression runs locally in the browser, moving backward or forward across decades takes milliseconds once a station archive is loaded.
To keep search fast and ensure reliable multi-decade comparisons, the catalog curates 3,703 long-record stations across 187 countries that measure daily TMAX, TMIN, and PRCP with at least 35 years of overlap and recent observations extending to 2024–2026.
2. GHCN-Daily variables & quality flags
Climate Explorer applies explicit quality filtering while parsing NOAA’s station CSV rows in your browser:
| Element | Meaning | Raw NOAA unit | Displayed / exported unit | Quality & bounds filter |
|---|---|---|---|---|
TMAX |
Maximum daily temperature | Tenths of °C | °C and °F | Rejects non-empty Q_FLAG, -9999, values outside [-90, 60] °C, or TMAX < TMIN |
TMIN |
Minimum daily temperature | Tenths of °C | °C and °F | Rejects non-empty Q_FLAG, -9999, values outside [-90, 60] °C, or TMAX < TMIN |
PRCP |
Total liquid-equivalent precipitation | Tenths of mm | mm and in | Rejects non-empty Q_FLAG, -9999, values < 0; retains M_FLAG = T as Trace |
SNOW |
Daily snowfall amount | Whole mm | mm and in | Rejects non-empty Q_FLAG, -9999, values < 0; shown when reported |
SNWD |
Snow depth at observation time | Whole mm | mm and in | Rejects non-empty Q_FLAG, -9999, values < 0; shown when reported |
Missing days or excluded Q_FLAG readings remain unavailable rather than filled with 0. In CSV downloads (climateexplorer-YYYY-MM-DD-STATION.csv), both the 31-day context window (31_day_window) and every recorded year on that calendar date (same_calendar_day) are exported with side-by-side metric and imperial columns plus a prcp_trace boolean flag.
3. Understand observation-day boundaries & baselines
Local station day vs. UTC synoptic day
GHCN-Daily follows each contributing network’s local climatological observation day rather than a uniform UTC clock:
- Automated airport sites (such as US ASOS stations) typically summarize a local standard/civil midnight-to-midnight day.
- Older manual cooperative stations (especially pre-1980s records) sometimes read max/min thermometers once per morning (for example 07:00 or 08:00 local time), shifting overnight cooling or afternoon peaks slightly across adjacent calendar dates.
- To compare sub-daily timing for modern post-1940 dates, use the Hourly sequence in GHCNh → link inside the Day Summary card, or use UTC daily summary in SSOD → when aligned
00:00–23:59 UTCwindows are needed across distant time zones. Read one UTC day, three local calendars for a worked comparison.
How the 1991–2020 seasonal reference works
Whenever a selected station contains at least 24 valid years between 1991 and 2020 within a centered 29-day window (±14 days around the chosen month and day), the explorer computes the 30-year baseline mean daily maximum (TMAX) and minimum (TMIN) for that window. Using a centered 29-day sample reduces single-day noise in the seasonal baseline compared with averaging a lone calendar date across 30 years.
Keep in mind that GHCN-Daily files are not homogenized for thermometer swaps, screen changes, or station relocations. When investigating multi-decade warming trends rather than single calendar events, consult the adjusted monthly series in the GHCNm Explorer or read why long climate records need homogenization.
4. Export day cards and station records
- Save Day Card (PNG): Generates a
1200×630self-contained image in the browser showing the date, station identifier, dual-unit temperature and precipitation boxes, 1991–2020 baseline departure, and a 31-day temperature curve with NOAA/NCEI CC0 attribution. - Copy day link: Copies a direct deep link (
?station=<ID>&date=YYYY-MM-DD). Deep-linked dates intentionally carrynoindex,followfor search engines while still providing rich social preview titles and descriptions on messaging apps and social platforms. - Download CSV: Exports the active 31-day surrounding sequence alongside every matching calendar date across the station’s archive history.
5. Worked example: Paris 2019 vs. Berlin 1989
- On the World Weather on Any Date Explorer, scroll to Memorable global weather days to explore and choose Paris All-Time Heat Peak (Montsouris) (
25 July 2019). - Confirm station
FRM00007156(42.6 °C / 108.7 °Fmaximum,25.0 °C / 77.0 °Fminimum,0.0 mmrain) and scroll down to the Same calendar day across all years chart to see how sharply 2019 stands out above every other25 Julyin Paris-Montsouris’s archive. - Next select Fall of the Berlin Wall (Berlin-Dahlem) (
GM000003319,9 November 1989:10.3 °C / 50.5 °Fmaximum,3.9 °C / 39.0 °Fminimum,0.4 mm / 0.02 inprecipitation) and click Save Day Card (PNG) to verify the exported graphic preserves both unit systems.
6. Troubleshooting
- A historical date shows “Not reported”
-
The chosen station either began operating after that date or had missing/flagged reports on that calendar day. Check the station’s covered interval beside its name (for example
1946–2026) or pick a century-scale observatory nearby on the map. - The search list does not show a small town
-
The catalog filters to 3,703 stations worldwide meeting strict longevity (
>= 35years), recent reporting (>= 2024), and multi-variable (TMAX,TMIN,PRCP) criteria. Choose the nearest major city or airport on the interactive map, or search the full global catalog in GHCNh or SSOD. - Why does a value differ slightly from Wikipedia or another news summary?
-
News reports sometimes cite downtown city gauges, afternoon snapshot readings, or official national daily calendars running on a different 24-hour boundary, whereas Weather on Any Date always displays the quality-checked NOAA GHCN-Daily reading for the selected
stationId. - NOAA archive download fails or times out
-
If NOAA’s public endpoint temporarily resets a connection, click Retry fetch in the yellow/red status banner; the pre-loaded Central Park reference remains visible in the meantime.