NOAA SSOD Guide: US, Canada & Global Daily Weather Data
Quick start
- Open the Explorer and use Select Country (such as United States or Canada) or Find Station to narrow the catalog.
- Set a date range of no more than 1,096 days, then click a map point or double-click a station-table row.
- In Dashboard, check the GHCN station ID, coordinates, elevation, selected period, and parameter-weighted coverage.
- Compare the plots with the underlying rows in Data; blanks mean unavailable values, not zero.
- Choose Export Data to download the selected station and period as an Excel (
.xlsx) workbook.
1. Know what SSOD represents
The Synoptic Summary of the Day version 2 (SSODv2) is a NOAA/NCEI product derived from hourly and synoptic reports in GHCN-Hourly. Climate Explorer provides an independent interface for meteorological, climate, and environmental researchers seeking quality-controlled daily weather observations across US states (including Alaska and Hawaii), Puerto Rico, other US territories, and Canada.
Each SSOD date covers the same global synoptic day, 00:00–23:59 UTC. It is therefore useful for consistently aligned station comparisons, multi-decade daily time series, heatwave and freeze duration studies, and synoptic pressure analysis, but it may span parts of two local calendar dates. If your question concerns a local-date record, rainfall total, or temperature extreme, first read what an SSOD date means across time zones.
NOAA’s SSODv2 product page and technical documentation are authoritative for source definitions and limitations.
2. Find the right station
The left sidebar controls the station and date selection:
- Select Country filters the catalog by one or more countries. Choose United States or Canada to isolate North American observing networks.
- Find Station searches for a station name or GHCN identifier within active filters.
- Select Date Range sets the period used by station availability, plots, the Data table, and data export. The current application accepts a maximum span of 1,096 days.
- Download Stations (Excel) exports metadata for stations currently visible in the map extent; it does not export their daily observations.
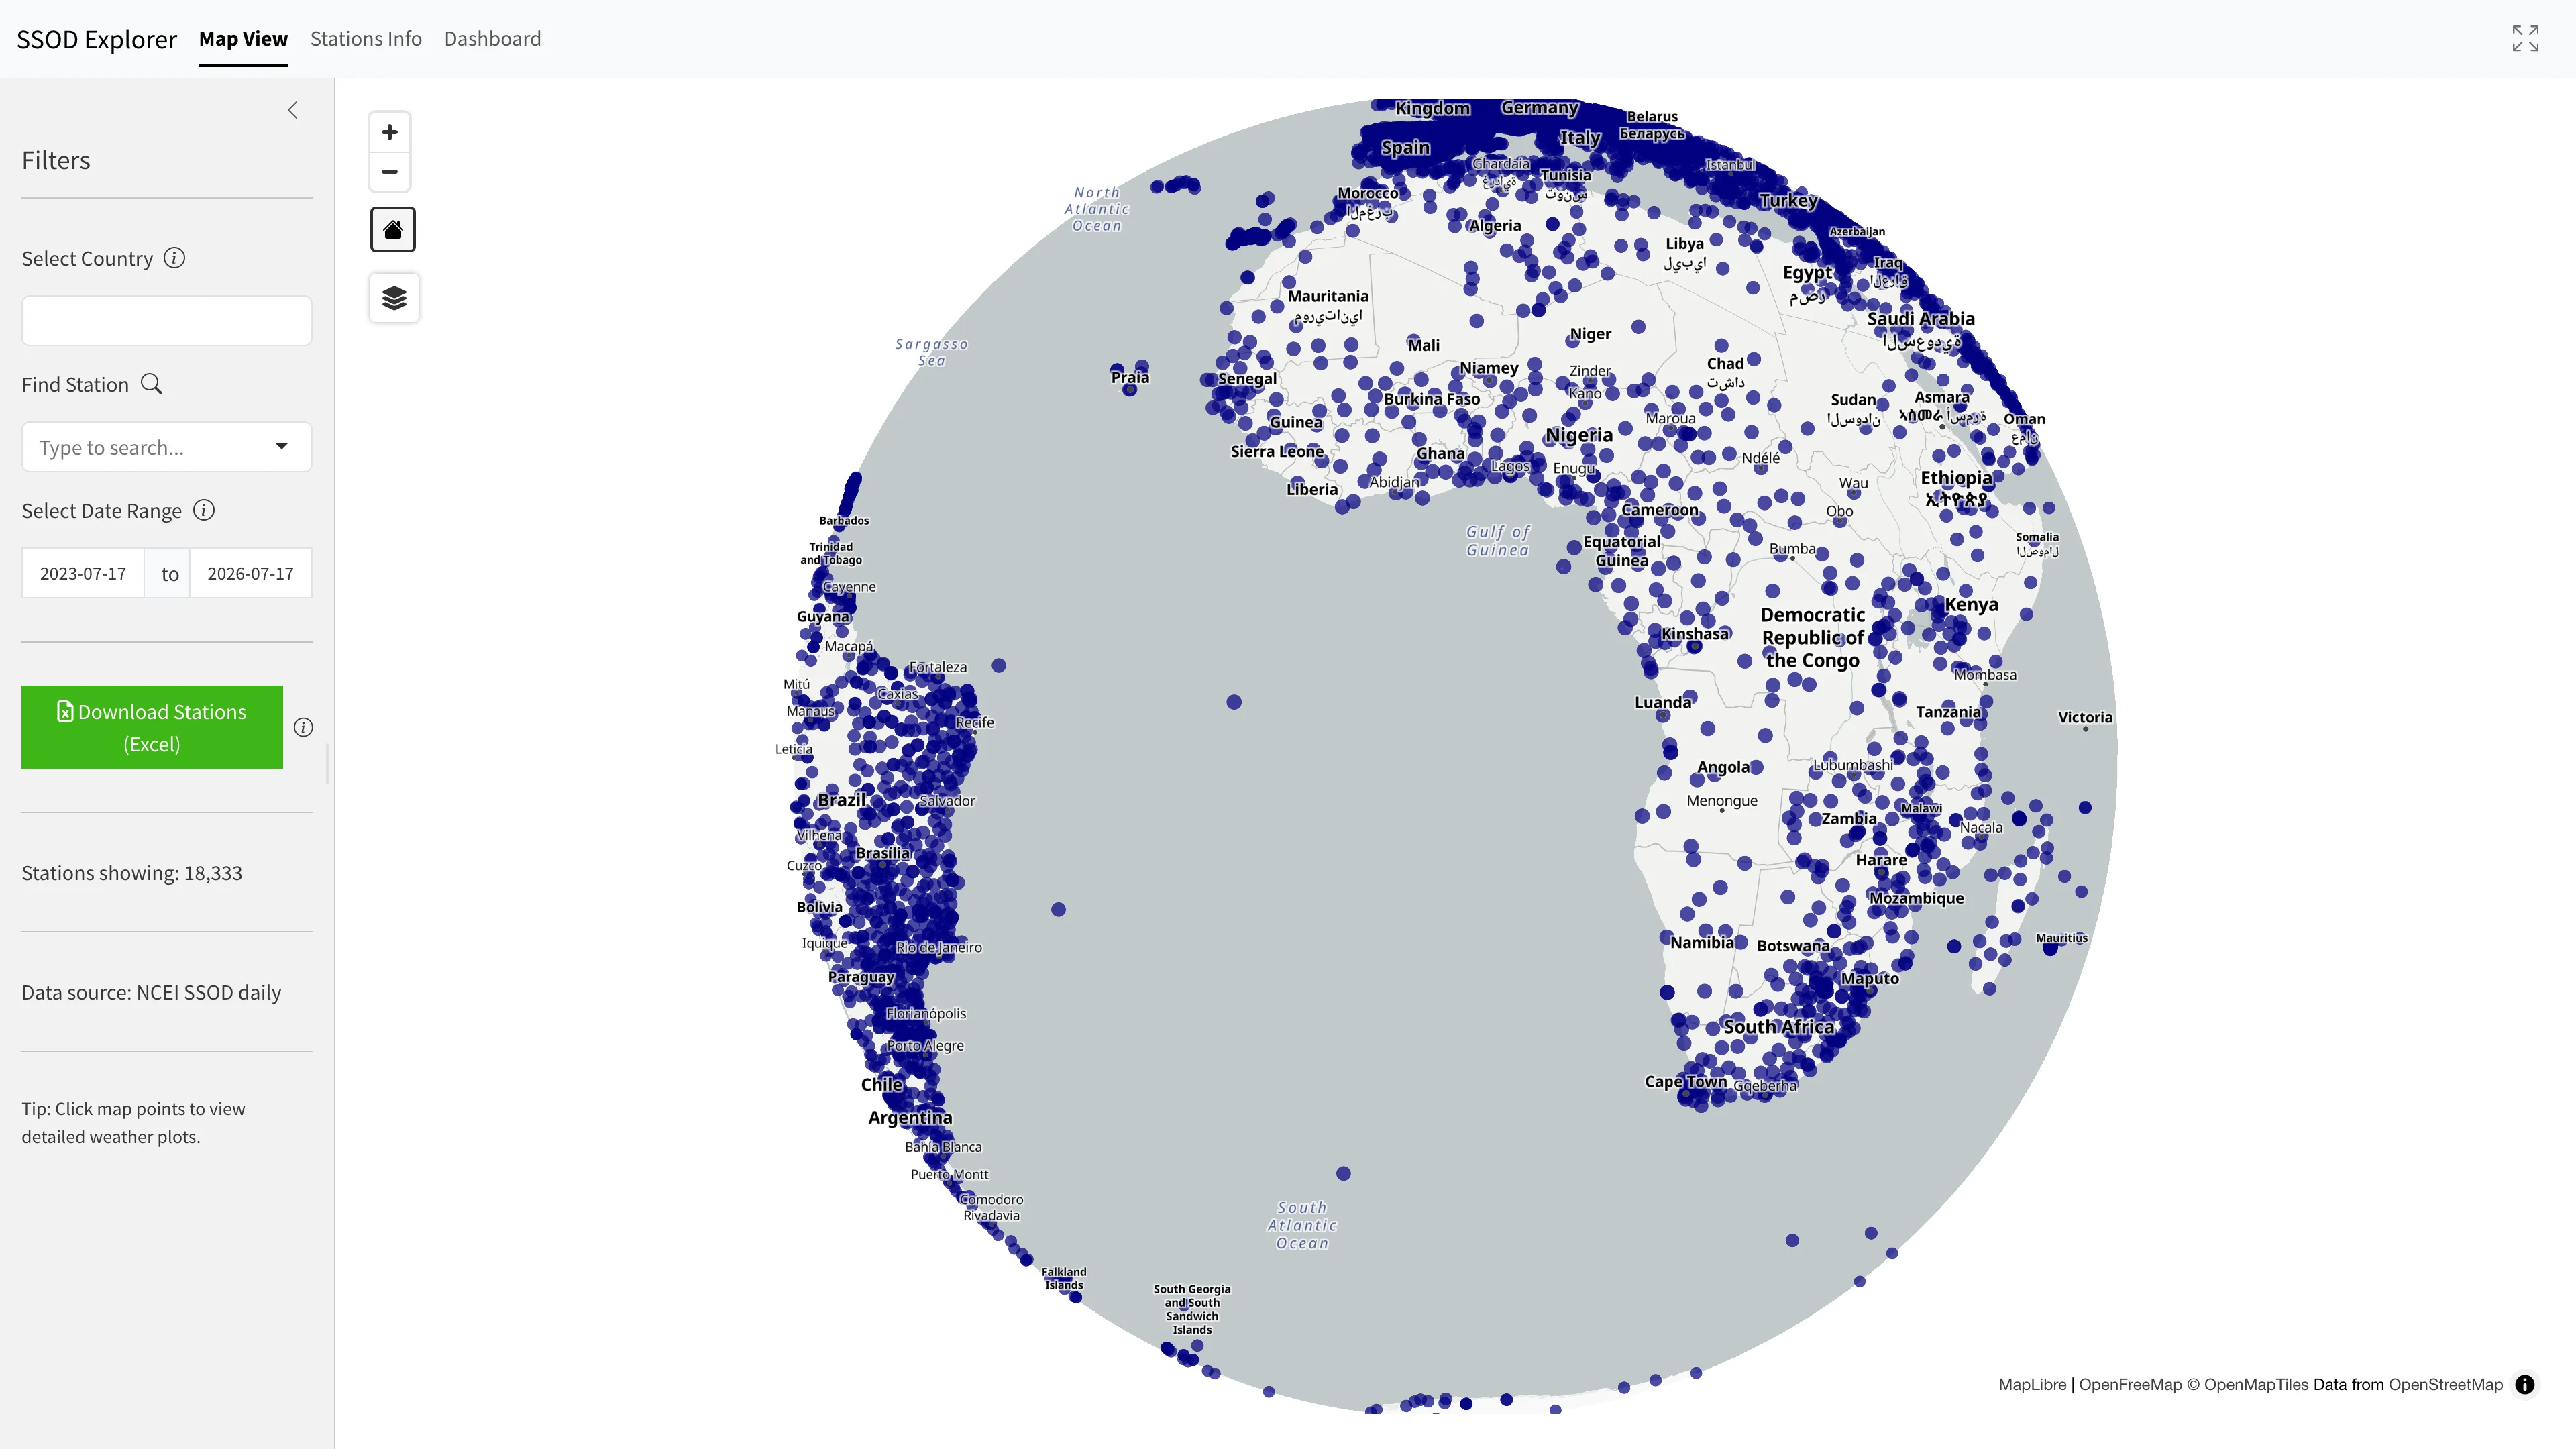
The count at the bottom of the sidebar reports how many stations match the current view. It is a live interface count, not a fixed statement about the complete NOAA archive.
Map View
Use the map to discover stations geographically. Blue points are available stations; the selected point is highlighted. Click a point to load it into the Dashboard. Map proximity alone does not establish that two stations share the same exposure, observing history, or climate.
Stations Info
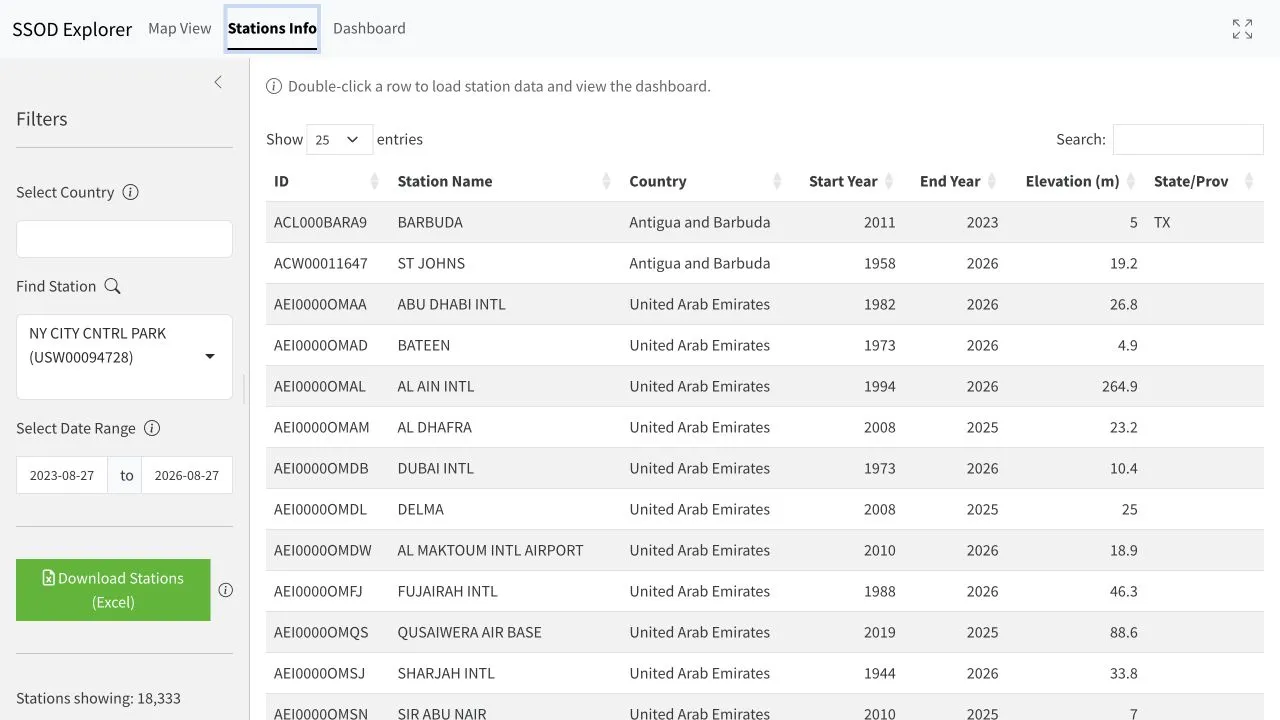
Use Stations Info when names are ambiguous or you need to compare identifiers and record periods. Search the table, then double-click the desired row to load its data and open the Dashboard. Always record the displayed station ID; similar names do not prove that records come from the same observing site.
North American station search
For researchers focusing on the United States and Canada, use the country filter and the station search:
- Station search: Find Station matches station name or GHCN ID (e.g., Central Park
USW00094728, DubuqueUSW00094908). USUSW000GHCN IDs embed the 5-digit WBAN number, so typing it can also match; Canadian and other IDs do not. ICAO and WMO codes are NOAA source-list metadata, not search fields. - Country filter: Select United States, Canada, Puerto Rico, Guam or the US Virgin Islands; coverage and record length vary by station.
- Research Applications: Use multi-decade station histories for extreme daily temperature analysis, precipitation and wind review, and station pressure inspection.
3. Set a defensible date window
Choose the shortest period that answers the question. A short event window makes missing days and abrupt changes easier to see, while a longer period provides context but can hide isolated gaps.
The application may shorten an unsupported range to its 1,096-day limit. After changing dates, confirm the Viewing interval in the Dashboard header rather than assuming the requested endpoints were retained. Station availability and variable availability can also differ: a station may exist in the catalog but lack a requested field or date.
4. Read the Dashboard
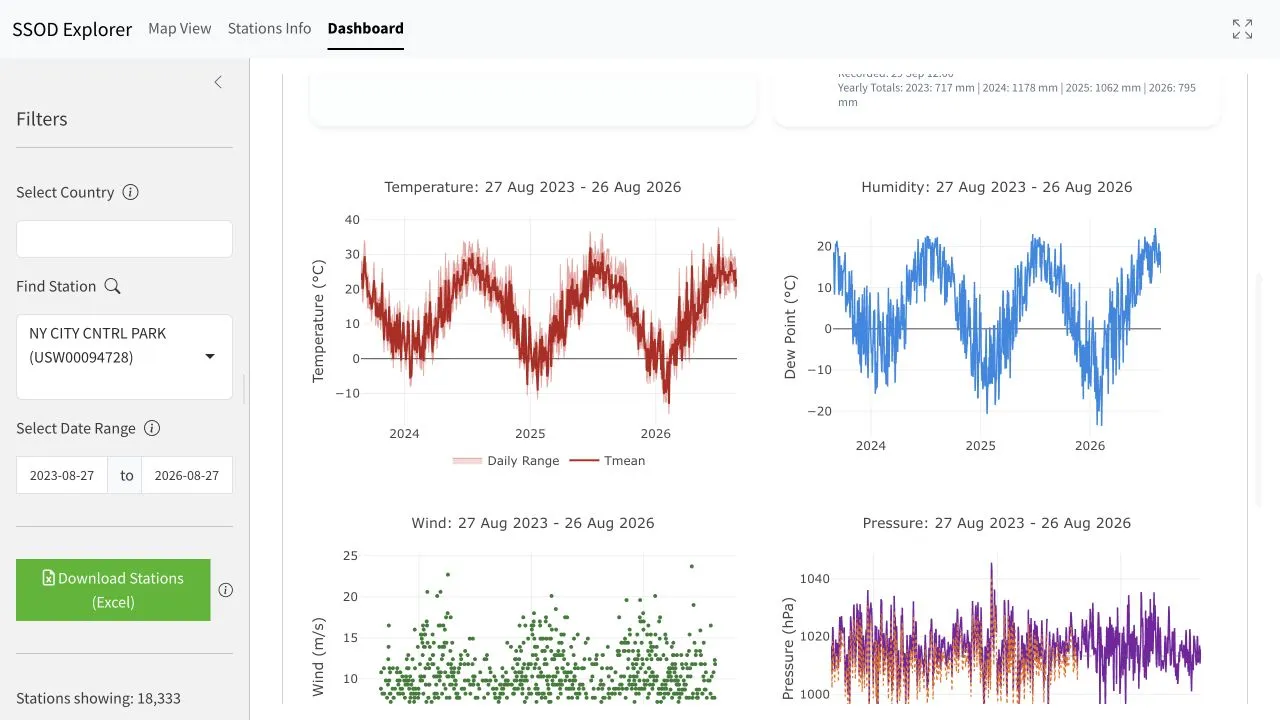
Before interpreting a plot, check the header:
- Station gives the name and NOAA station identifier.
- Location gives the country and coordinates supplied by the application.
- Technical gives elevation and the source reporting frequency.
- Station Availability shows the broader record period, the interval currently viewed, and parameter-weighted coverage for that view.
The Plots tab summarizes the selected period visually. Use it to identify sequences, gaps, possible extremes, or comparisons worth checking—not as the sole evidence for an exact value.
Check the Data rows before exporting
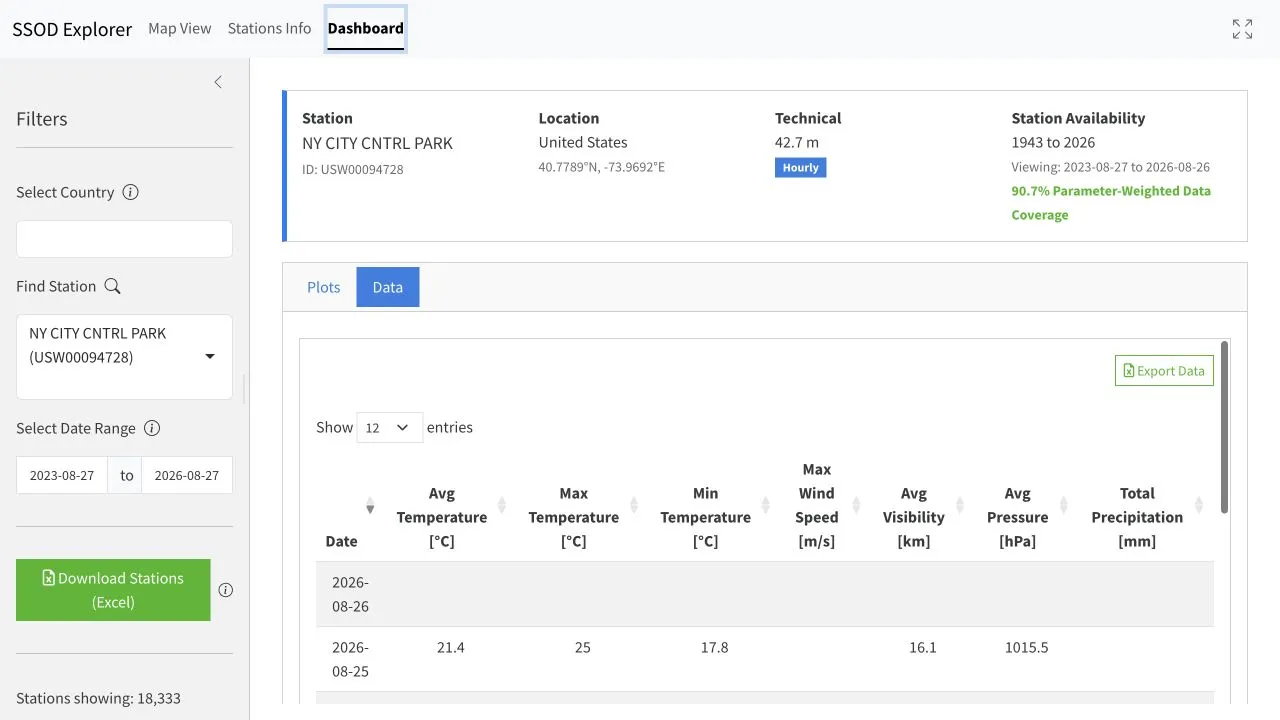
Open Data to inspect exact displayed rows and units. The table is sortable. Export Data downloads the parsed daily record for the selected station and period as an Excel (.xlsx) workbook; the current interface does not label this control as a CSV export.
5. Parameter and interpretation reference
| Displayed field | Meaning in the Explorer | Unit | Interpretation check |
|---|---|---|---|
| Date | SSOD summary date | YYYY-MM-DD | Covers 00:00–23:59 UTC, not automatically a local day |
| Avg Temperature | Mean of contributing temperature reports | °C | Examine report counts and gaps before comparing means |
| Max Temperature | Highest temperature represented in the summary | °C | NOAA cautions this may not be the true daily extreme |
| Min Temperature | Lowest temperature represented in the summary | °C | NOAA cautions this may not be the true daily extreme |
| Max Wind Speed | Maximum displayed wind speed | m/s | Do not confuse sustained wind with a gust field |
| Avg Visibility | Mean of contributing visibility reports | km | Availability and sampling vary by station and day |
| Avg Pressure | Mean displayed sea-level pressure | hPa | Confirm the field definition before mixing with station pressure |
| Total Precipitation | Reported precipitation for the synoptic day | mm | NOAA warns synoptic messages can underreport precipitation |
SSOD source files contain more fields than this compact interface table, including measurement counts, dew point, station pressure, gust, snow depth, and weather indicators where reports support them. Use the NOAA documentation when an analysis requires a field not displayed here.
6. Check completeness and quality
Daily means have a documented minimum
For a daily mean, NOAA requires at least one report in each of four six-hour blocks: 00–05, 06–11, 12–17, and 18–23 UTC. That rule supports temporal coverage across the UTC day, but it does not make every variable or every extreme complete.
Counts are context, not certification
Measurement-count fields indicate how many reports contributed to a summary. A higher count can provide useful context, but it does not prove that a maximum, minimum, or precipitation total captured every relevant observation.
Understand Climate Explorer screening
The application masks values outside broad physical bounds and applies simple relational checks, such as maximum temperature not being lower than minimum temperature. These are interface-level screening safeguards, not replacements for NOAA or national meteorological service quality control.
Treat missing values correctly
A blank cell or broken plot segment means the displayed value is unavailable. Do not replace it with zero unless the upstream field definition explicitly supports that treatment. In particular, blank precipitation is not evidence of a dry day.
7. Worked example: Central Park heat sequence
- Open the Central Park route for 1–23 July 2026.
- Confirm station
USW00094728in the Dashboard header. - In Plots, identify the early-July maximum-temperature sequence.
- Open Data and verify the rows for 1–4 July, retaining °C or documenting any conversion.
- Record that the dates are UTC summary days.
- Use the Central Park heatwave case study to see how the key value was compared with a National Weather Service local report.
This separates the roles of the related pages: the Explorer discovers the sequence, this guide documents the procedure, and the article evaluates a specific evidence-led claim.
8. Choose the right source for the claim
SSOD is well suited to globally aligned event chronology and station-level screening. NOAA cautions that synoptic precipitation can be underreported and that reported daily maximum and minimum temperatures may not capture true extremes. For the most accurate local daily rainfall or temperature extreme, NOAA recommends national meteorological service summaries or GHCN-Daily where appropriate.
For climatological context, match the observing site, variable, and calendar period before comparing with the WMO Normals Explorer. The limitations of WMO normals explains why a 1991–2020 average is a reference rather than a complete measure of current risk.
9. Troubleshooting
- The Dashboard is inactive
-
Select a map point or double-click a Stations Info row.
- The requested dates changed
-
Confirm the 1,096-day maximum and the Dashboard’s displayed Viewing interval.
- A plot has gaps
-
Open Data; do not infer zeros from blank cells.
- The station export lacks observations
-
Download Stations (Excel) exports station metadata. Use Dashboard Export Data for the selected daily series.
- A local record does not match SSOD
-
Verify the UTC/local-day boundary and consult the official local daily product.
- The embedded interface is crowded
-
Use the maximize control in its top-right corner, then press
Escto exit full screen.