Use and Export WMO CLIMAT Monthly Data
Quick start
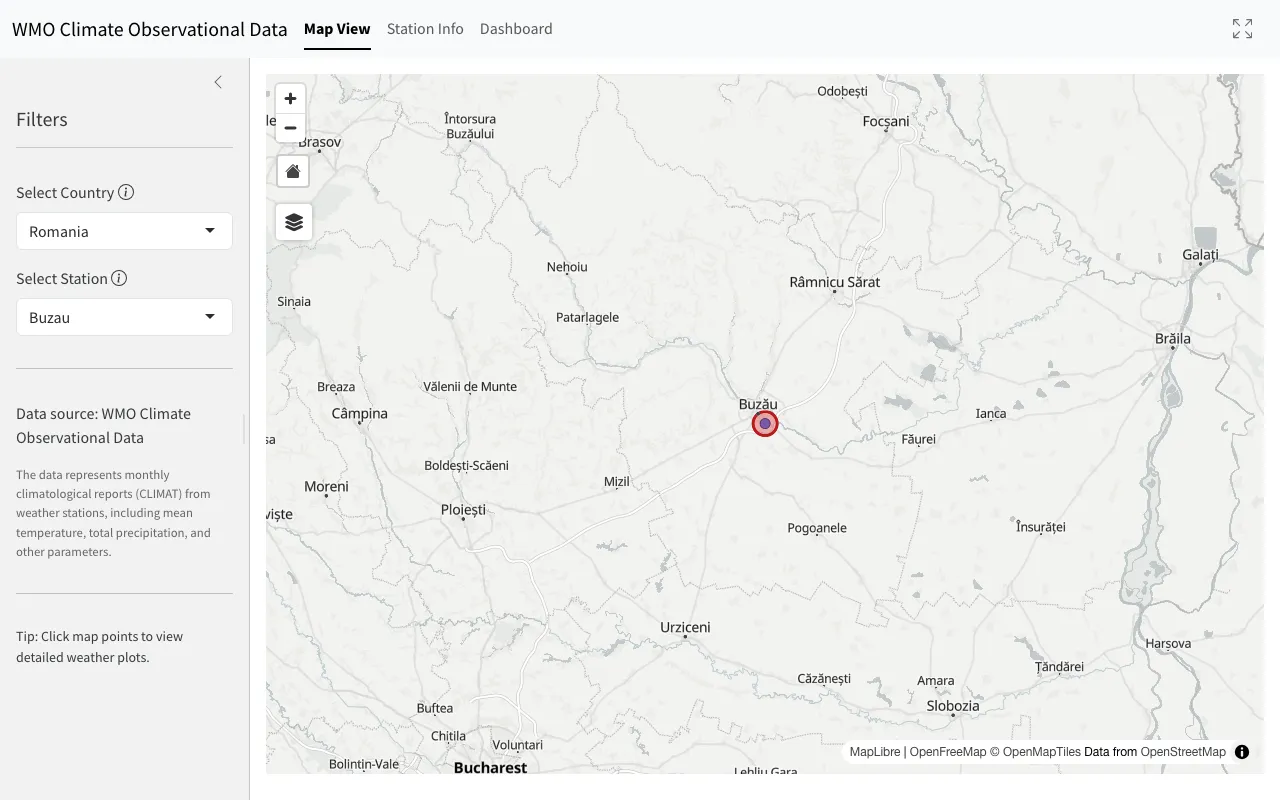
- Open the Explorer and choose a country.
- Select a station from the sidebar or map, then confirm its identifier in Station Info or the Dashboard header.
- Open Dashboard → Plots and choose the time window that fits the question.
- Compare the same calendar month across years; do not call the difference between winter and summer an anomaly.
- Inspect exact monthly rows in Data, then choose Download CSV for the complete parsed station table.
1. Understand what the Explorer serves
CLIMAT messages are monthly summaries compiled from daily observations at synoptic and climatological stations. The WMO standard defines how member services encode and exchange those summaries. The Explorer uses DWD Climate Data Center files that reorganize selected CLIMAT fields into parameter-specific recent and historical station series.
Climate Explorer is an independent interface and is not affiliated with WMO or DWD. DWD’s global quality-controlled CLIMAT archive is authoritative for the files served here; the WMO CLIMAT template documents the current message fields and BUFR sequences.
Three products must remain distinct:
- A monthly observation is a reported value for one station and calendar month.
- A climate normal is a reference statistic for a stated period, such as 1991–2020.
- An anomaly is a calculated difference between an observation and a matched reference.
The WMO Climate Explorer displays observations. It does not calculate anomalies or certify trends.
2. Find and verify a station
Check Station Info
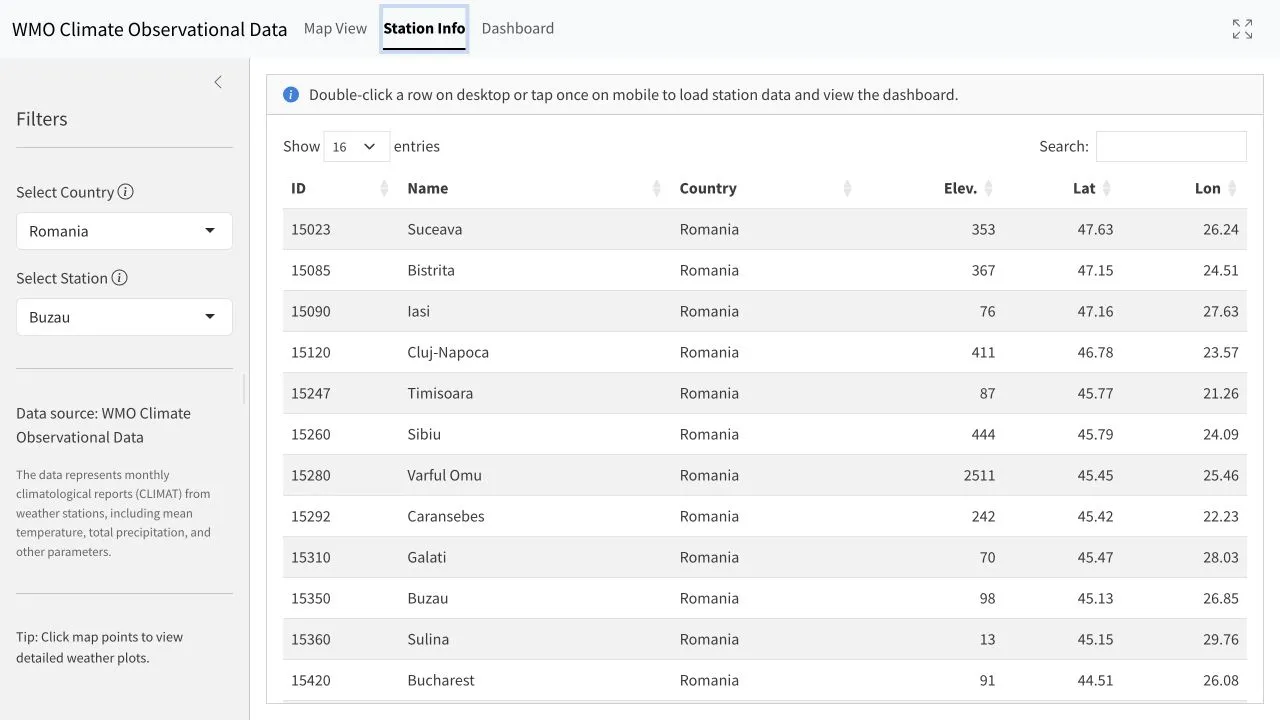
Station Info lists the stations in the active country filter; it is not limited to the selected station. Search or sort the table to verify the WMO station number, name, coordinates and elevation. Similar names, or points close together on the map, do not establish a continuous record from one observing site.
3. Read the Dashboard without inventing a baseline
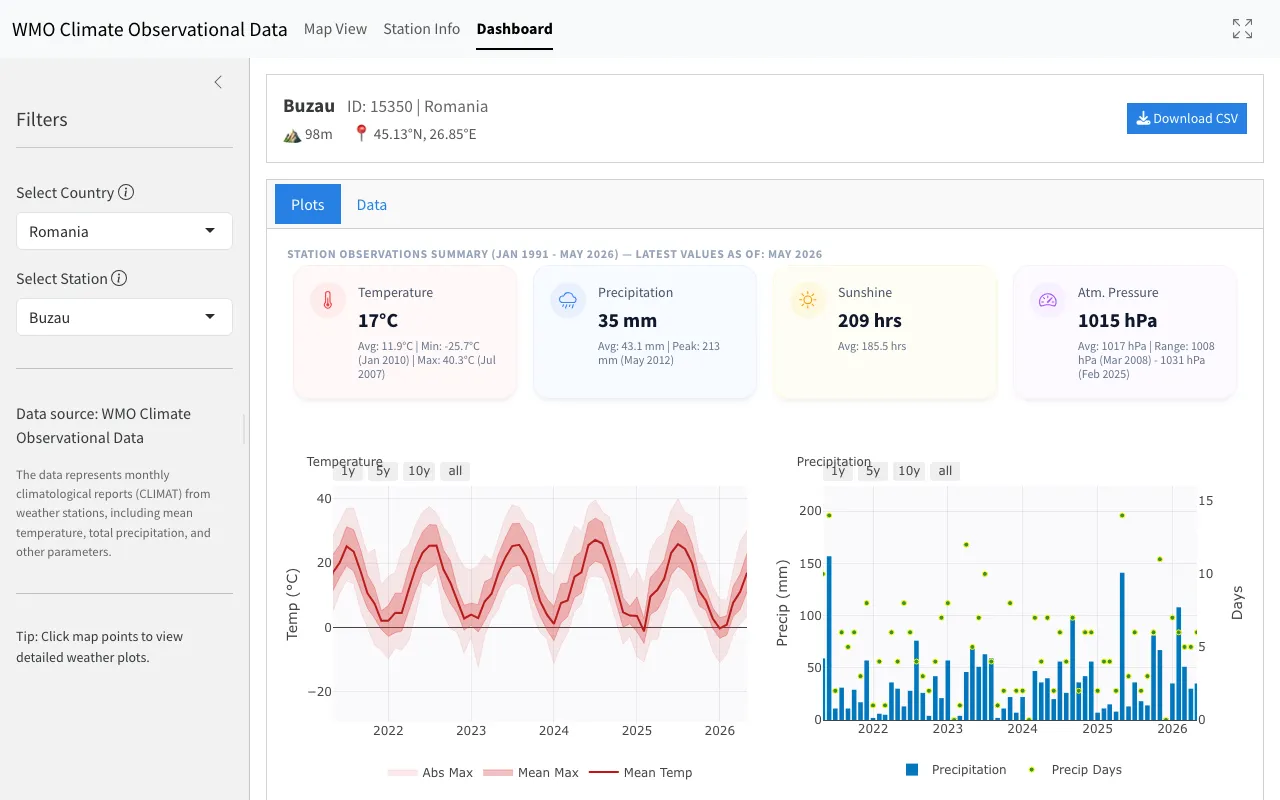
The Dashboard header identifies the station and provides Download CSV. The summary line reports the loaded observation period and latest available month. The cards show the latest value and descriptive statistics across the loaded series.
Those card averages are not climate normals: a mean calculated across January through December mixes the seasonal cycle. Use them only as navigation summaries. For a climatological comparison, match the calendar month and use a documented station reference.
Use Plots for screening
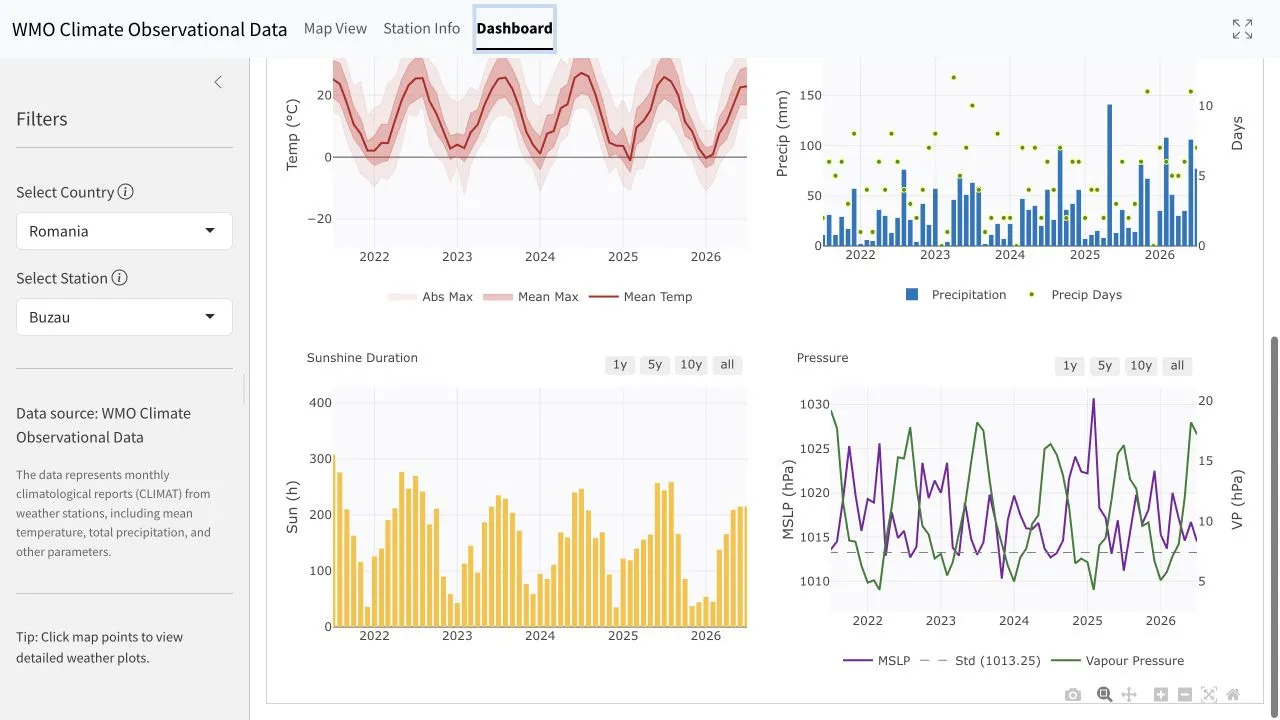
The plots support temperature, precipitation, sunshine, sea-level pressure and vapour pressure where the station reports them. The 1y, 5y, 10y and all controls change the displayed time span. A shorter view helps inspect recent gaps; the full view shows longer variability but does not correct station discontinuities or calculate a trend.
Plot lines connect monthly observations. Seasonal repetition is expected, especially for temperature and sunshine. To compare July with earlier Julys, confirm the values in Data or filter the exported CSV by month.
4. Inspect and export the monthly rows
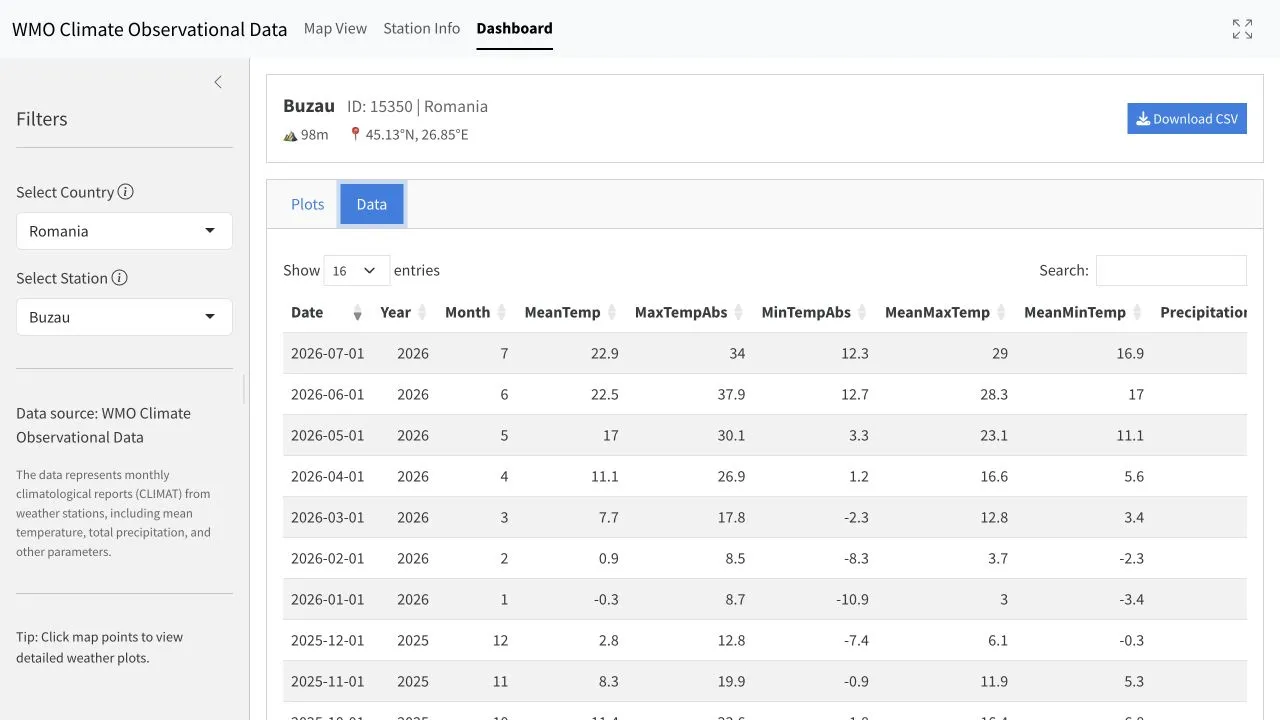
The Data tab exposes the parsed values used by the Dashboard. A date such as 2026-07-01 identifies the July 2026 monthly record; it is not a daily observation for 1 July. Blank cells are unavailable values, not zero.
Download CSV exports the complete parsed station table currently available to the application, rather than only the rows visible on the current Data page or plot window. Retain the station ID, retrieval date and upstream archive URL with any analysis.
5. Parameter reference
| Export field | Monthly quantity | Unit | Interpretation note |
|---|---|---|---|
MeanTemp |
Mean air temperature | °C | Monthly observation, not an anomaly |
MaxTempAbs |
Absolute maximum temperature reported in the month | °C | Distinct from the mean of daily maxima |
MinTempAbs |
Absolute minimum temperature reported in the month | °C | Distinct from the mean of daily minima |
MeanMaxTemp |
Mean of daily maximum temperatures | °C | Requires sufficient contributing daily values |
MeanMinTemp |
Mean of daily minimum temperatures | °C | Requires sufficient contributing daily values |
Precipitation |
Total monthly precipitation | mm | Check missingness and reporting continuity |
PrecipDays |
Days with precipitation of at least 1 mm | days | A count, not an amount |
SunshineDuration |
Total bright-sunshine duration | hours | Availability varies substantially by station |
MeanSeaLevelPressure |
Mean pressure reduced to sea level | hPa | Do not mix with station-level pressure |
VapourPressure |
Mean vapour pressure | hPa | A moisture measure, not relative humidity |
The WMO message template contains additional metadata and completeness fields that are not all exposed in this compact table. Consult the template or DWD’s parameter-level descriptions when the analysis depends on report completeness or a field absent from the interface.
6. Worked example: compare July at Buzău
Choose Romania, then Buzau (
15350).Confirm the displayed metadata: 45.13° N, 26.85° E and 98 m in the current DWD station list used by the interface.
Open Data and isolate rows whose Month value is
7.Compare
MeanTempacross the selected July years, recording missing rows rather than filling them automatically.Download the CSV and preserve the station identifier, field, years and retrieval date.
If an anomaly is required, find a July normal for the same or demonstrably equivalent station and compute:
July observation − matched July normal = July anomaly
The WMO Normals Explorer provides 1991–2020 station reference values, while the WMO Normals guide explains matching and completeness limitations. Do not use the Dashboard’s all-month average as the reference.
7. Recent, historical and quality-control limits
DWD publishes parameter-specific recent files separately from versioned historical files. Recent records extend the series but may change as files are processed and later historical versions are issued. Climate Explorer parses the available parameter files, combines them by month and retains missing values in the display and export.
Quality control does not make a station series homogeneous. Relocations, instrument changes, observing-practice changes and local environmental change can introduce discontinuities. A formal long-term trend requires station-history review and a method appropriate to the question; one station should not be generalized to a country or the globe.
8. Troubleshooting
- The Dashboard is inactive
-
Select a station and wait until all parameters finish loading.
- Station Info shows many rows
-
It lists the active country’s station catalog; search for the selected ID.
- A variable is blank
-
That station-month is unavailable for the field. Do not replace it with zero without an upstream rule.
- The date looks daily
-
The first day is a storage label for the month, not a 1-day measurement.
- A CSV has more rows than the plot
-
The export contains the complete parsed station table, while the plot can show a shorter window.
- You need an anomaly
-
Match the same variable, station, calendar month and documented normal period outside this Explorer.