Oct 14, 2026
September 2026 Across the Nordic Region: Warmth and Rainfall Contrasts
September 2026 was warmer than usual at 35 of 36 Nordic stations. A smaller precipitation comparison ranged from below normal to over three times usual at Kevo.
We compare weather observations across places and time to understand heat, rainfall and how conditions differ from usual.
Florida and Alabama · October 2026
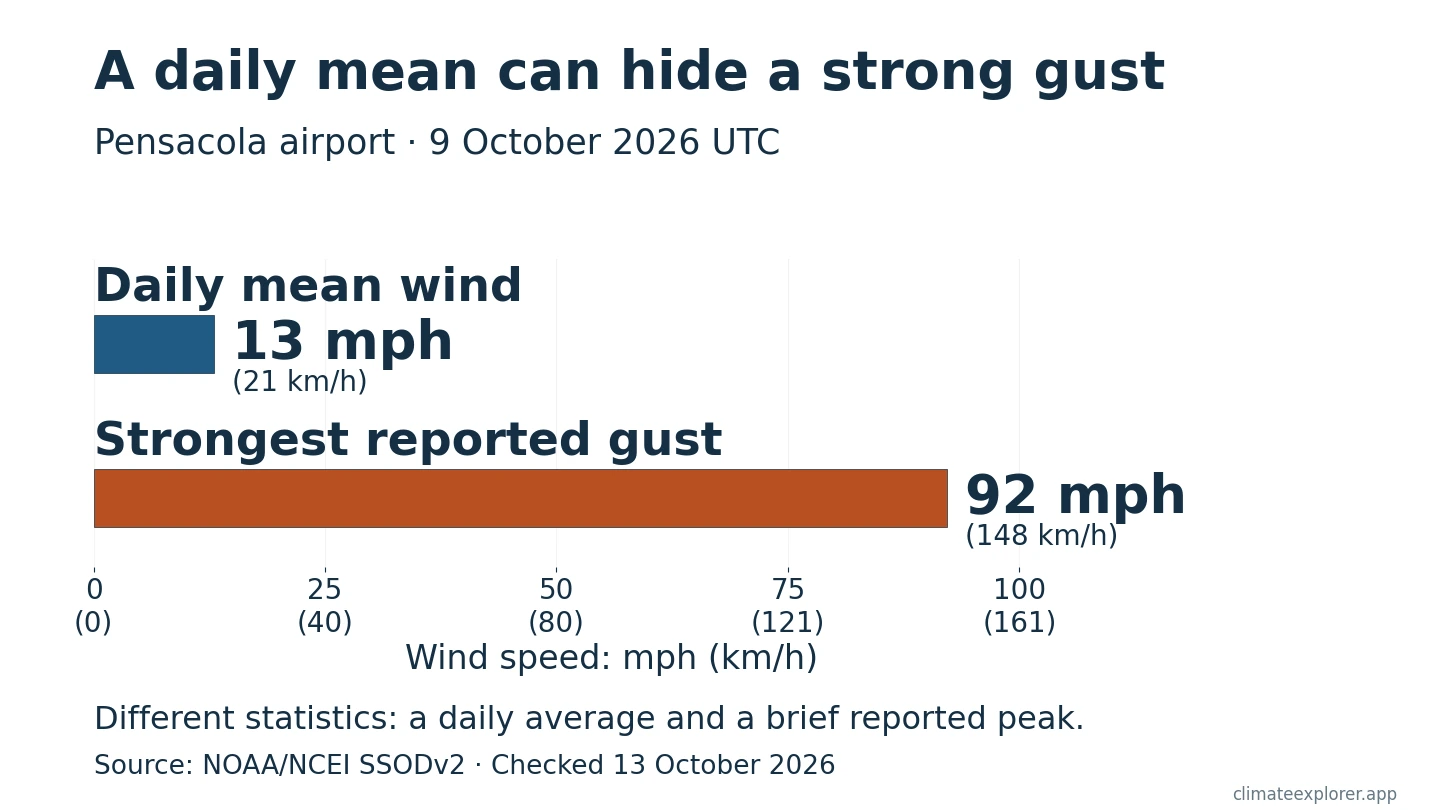
At Pensacola Regional Airport, 9 October UTC had a daily mean wind of 13 mph (21 km/h) and a reported gust of 92 mph (148 km/h). Follow three airport records to see the wind peaks, pressure timing and missing hours, then explore the observations.
Choose a dataset to view station records or radar observations. Each guide explains the available measurements, dates and limits of the data.
MeteoGate / EUMETNET
Surface observations from European stations, distributed through MeteoGate and E-SOH. Follow recent weather across national networks.
EUMETNET
Animate near-real-time pan-European radar frames to track precipitation, with maximum reflectivity (DBZH), rain rate, and accumulation products.
Deutscher Wetterdienst OpenData
German station records from DWD OpenData, from 10-minute measurements to annual summaries. Available variables include temperature, precipitation and solar radiation.
Independent view of official open data
Météo-France station observations published through France's open-data portals, with coverage for rainfall, wind, temperature, and rapid precipitation changes.
Japan Meteorological Agency
Daily, hourly and 10-minute records from the Japan Meteorological Agency. Available measurements differ between automated stations and observatories.
Institute of Meteorology (IMGW-PIB)
Polish station observations from IMGW-PIB, including temperature, precipitation and snow records. Explore hourly and daily measurements where available.
Climatological Standard Normals
Station reference values across standard 30-year baseline periods (1961–1990, 1981–2010, 1991–2020) to put temperatures and rainfall into historical context.
Global Monthly CLIMAT reports
Monthly station observations from CLIMAT reports in DWD's global archive. Compare the same month across years and check how complete each record is.
Independent view of NOAA/NCEI data
NOAA/NCEI SSODv2 daily summaries presented independently for UTC-aligned comparisons across more than 9,000 global station locations.
Independent view of NOAA/NCEI data
NOAA/NCEI GHCNh hourly station observations presented independently for extremes, diurnal cycles, and sub-daily analysis worldwide.
Independent view of NOAA/NCEI data
NOAA/NCEI GHCNm monthly station records presented independently for long-term temperature, precipitation, and regional trend analysis worldwide.
Hungarian Meteorological Service
Surface observations across Hungary: 10-minute to century climate series from over 340 stations, with interactive maps and CSV export.
The observations come from national meteorological services and international archives. Climate Explorer retrieves and presents them in maps, charts and tables. Each guide explains the measurements, reporting periods and processing used for its dataset.
A station record describes one place. Gaps in coverage, observation times and changes of instrument can all affect a comparison. Our articles explain these limits alongside the findings and link to the records behind them.
Climate Explorer is an independent project. Read how we prepare the work or report a correction.
Oct 14, 2026
Oct 12, 2026
Oct 11, 2026