France’s October Rain: Half the Daily Rainfall in One Hour
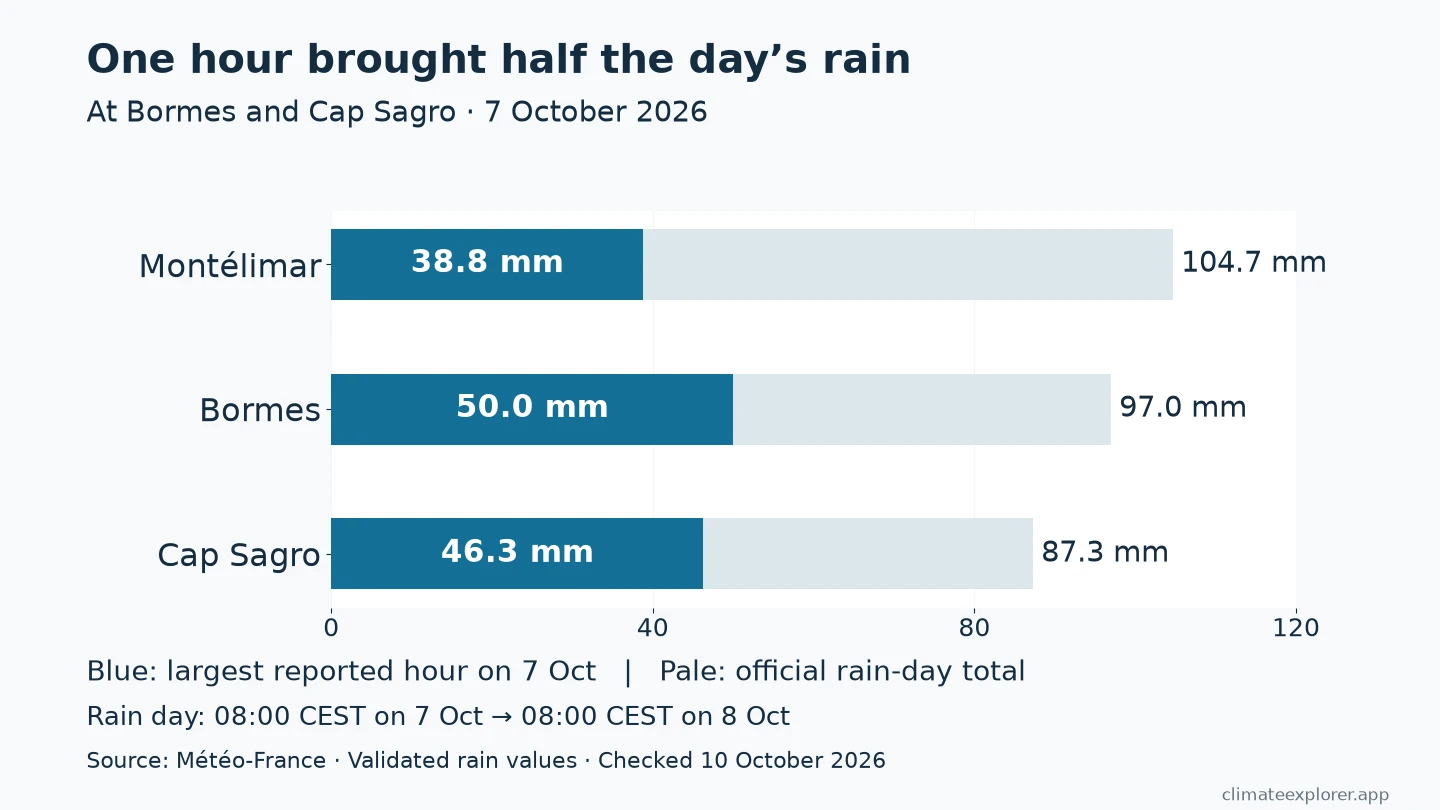
On 7 October 2026, Bormes-les-Mimosas (Météo-France ID 83019002) recorded 50 mm of rain in a single hour—just over half its total for the 24-hour reporting period beginning that morning. To picture that amount, 50 mm of rain is equivalent to 50 litres of water per square metre.
Météo-France described an ongoing rain episode along the Var coast in southeastern France that day. Its station records let us follow the bursts, then see how temperatures changed. Here we look at three sites during 5–9 October, including two coastal stations and an inland one.
Times below use France’s local summer time: Central European Summer Time (CEST), two hours ahead of UTC.
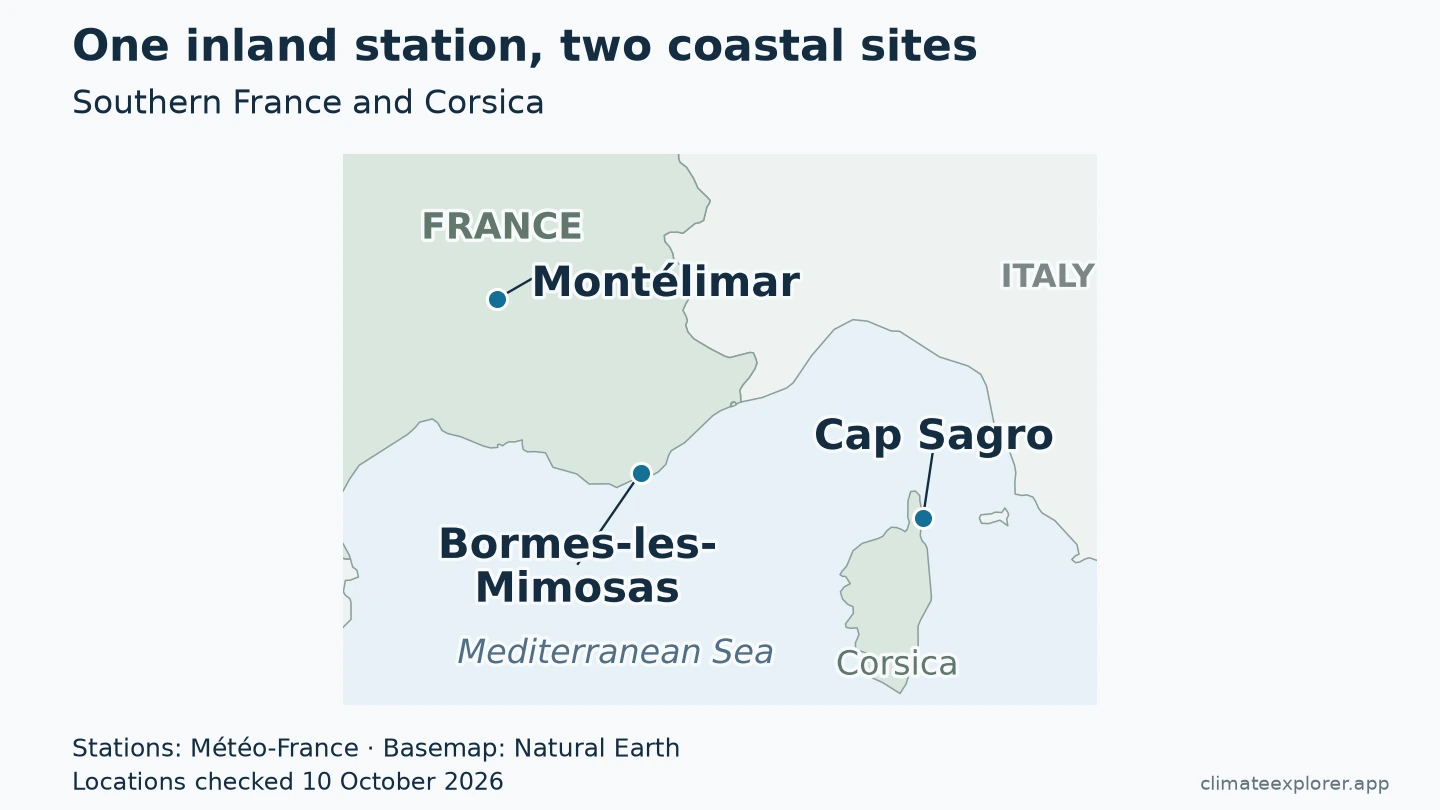
Three stations, three different peak hours
Bormes’ wettest hour was reported at 14:00 on 7 October. At Cap Sagro on Corsica (Météo-France ID 20281001), the wettest hour was reported at 10:00. It brought 46.3 mm, also about half that station’s total for the reporting day.
Montélimar (Météo-France ID 26198001) had its wettest reported hour later, at 22:00, with 38.8 mm. That was a little over a third of its daily total. All three peaks occurred on 7 October, although the stations were in different places and the rain arrived at different times.
There is one detail to keep in mind when reading the first chart. Météo-France’s daily rainfall total runs from 08:00 one morning to 08:00 the next during this event. The total labelled “7 October” therefore covers 08:00 on 7 October to 08:00 on 8 October. A midnight-to-midnight total can give a different number.
The biggest short burst came earlier
The six-minute records at Bormes reveal another burst before the afternoon downpour. The largest amount was 10.9 mm in six minutes, reported at 05:48 on 7 October. Looking only at the wettest hour would miss this earlier peak in the finer measurements.
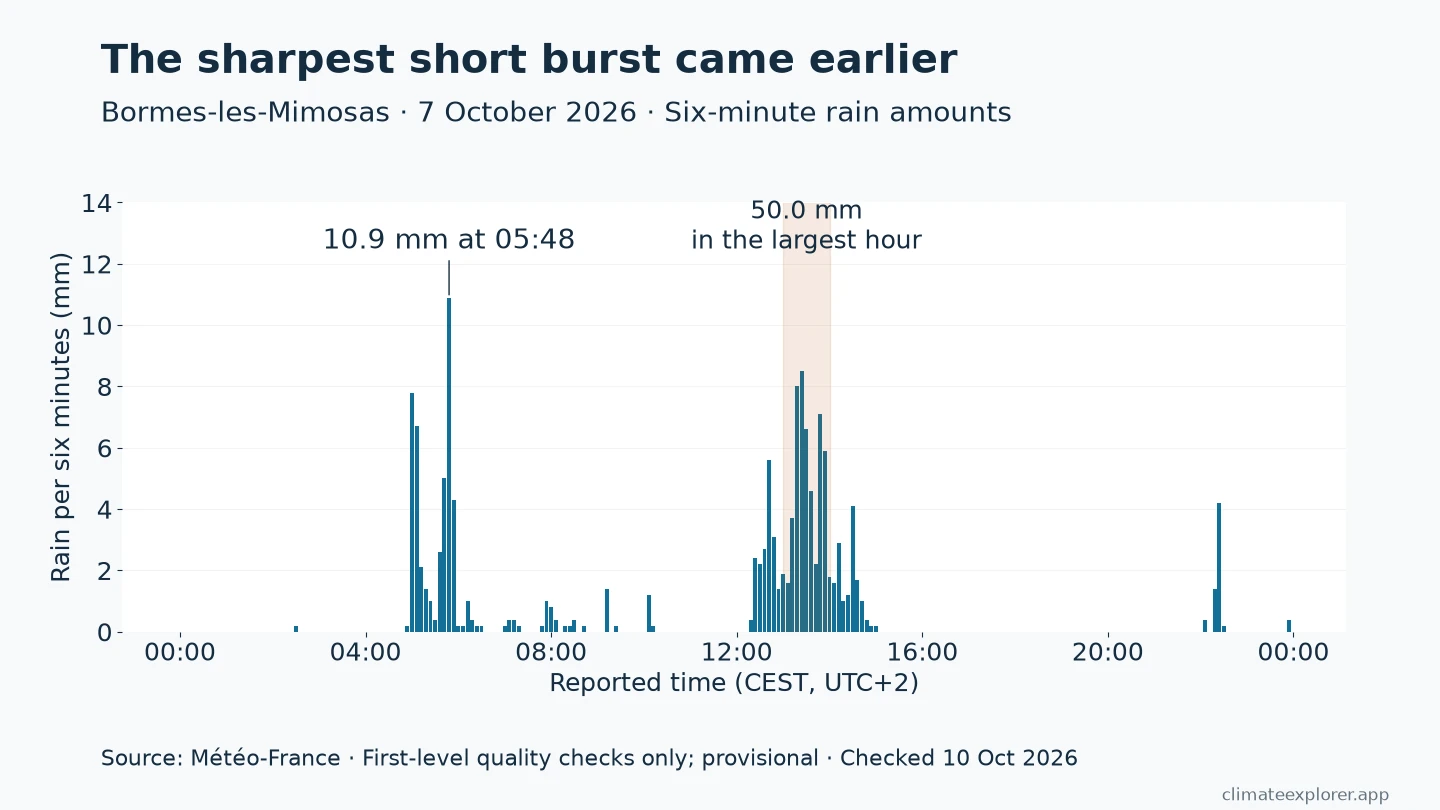
The afternoon hour shaded in the chart contains ten six-minute readings that add up to 50.0 mm. The sharpest six-minute burst happened in the morning, before the 08:00 reporting boundary. It belongs to the same calendar date as the afternoon rain, but to the previous official rainfall day.
These six-minute values are provisional, meaning they may still be revised after further quality checks. They measure the water collected during each short interval; a brief burst does not tell us that the same intensity lasted a full hour.
The coast warmed again the next day
At Montélimar, the change was clear. The station read 24.6°C (76.3°F) at 13:00 on 6 October and 16.7°C (62.1°F) at the same time the next day. Comparing the same hour avoids confusing a weather change with the usual cooling between afternoon and night.
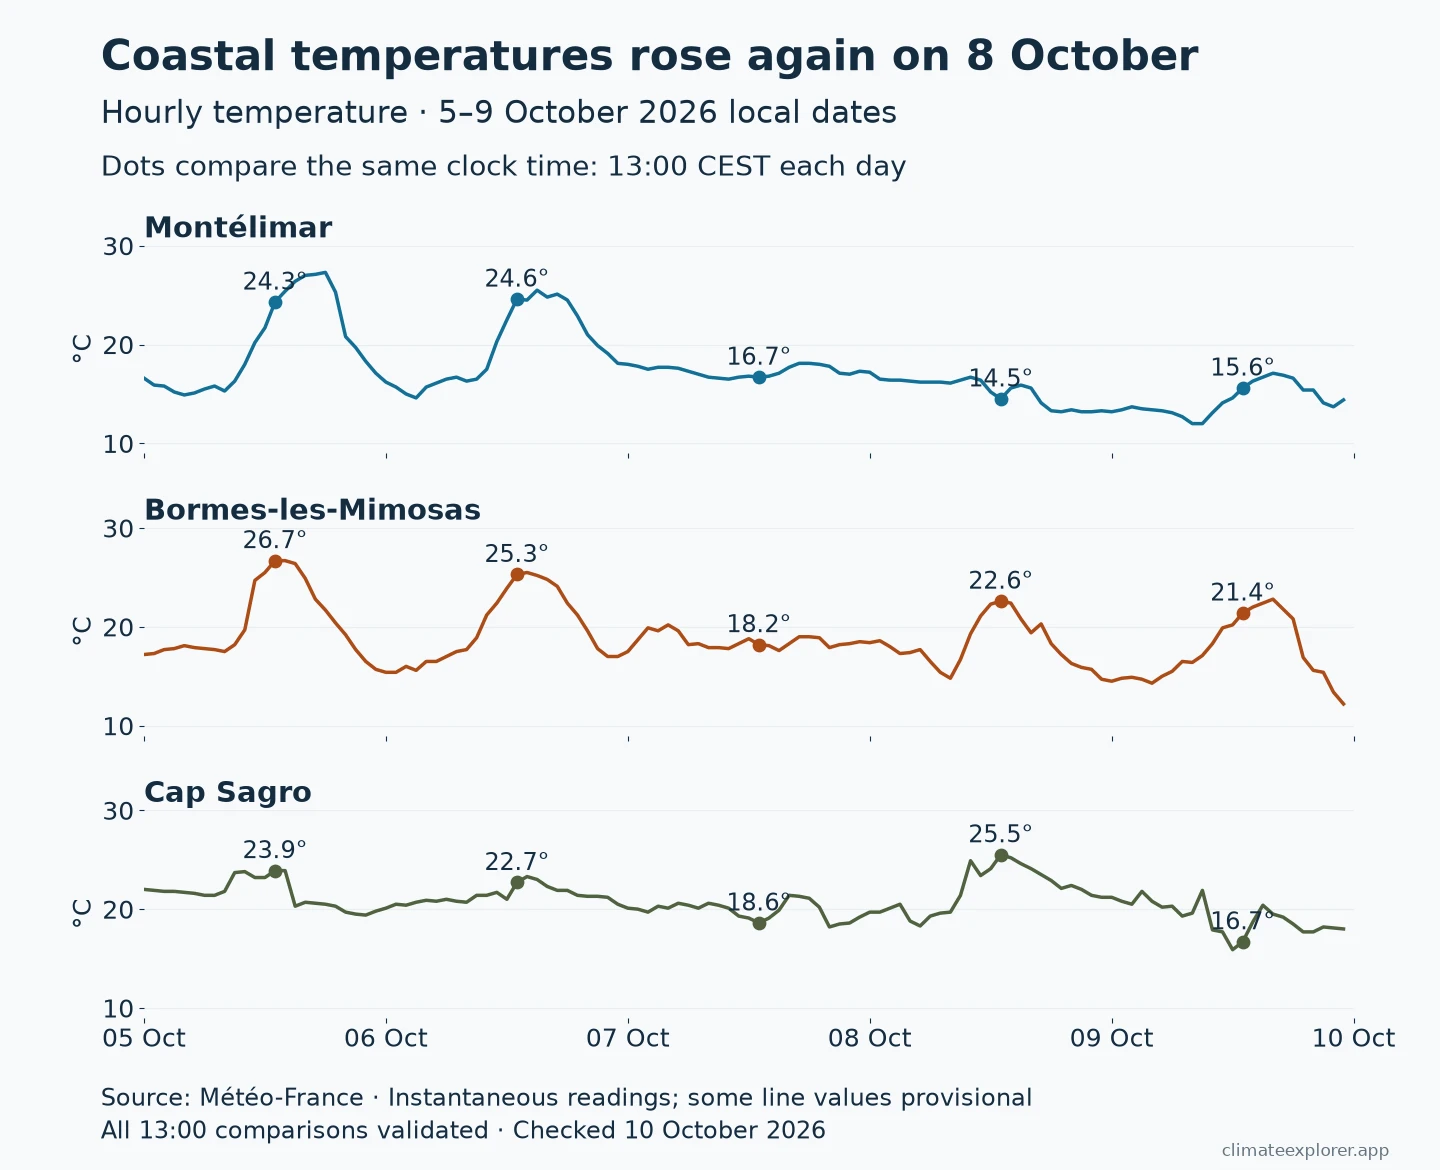
On 8 October, Montélimar stayed cooler while Bormes and Cap Sagro warmed again. Cap Sagro reached 25.5°C (77.9°F) at 13:00, then dropped to 16.7°C (62.1°F) at that hour on 9 October—a fall of 8.8°C (15.8°F) in 24 hours.
Météo-France’s later report described colder air following the disturbance. The station charts add the local detail: cooling at Montélimar, a recovery at the coast, then another drop at Cap Sagro. Each plotted temperature is a reading at that moment, rather than an average for the day.
Explore the same observations
Open one of the three stations in the Météo-France Explorer:
Choose Hourly to compare temperature and one-hour rainfall. Select 6-min (Precip only) to look closer at the rain bursts.
The current interface needs a date selection of at least 28 days. Set 1 September–10 October 2026, then look at 5–9 October within that longer series. The guide explains the controls. For the exact observations used here, download the article tables in the annex; the live data may be revised later.
The observations come from Météo-France. Climate Explorer is an independent platform for exploring them.
Conclusion
At Bormes and Cap Sagro, about half the reporting day’s rain fell in one hour. At Bormes, the sharpest six-minute burst came much earlier. Temperatures also recovered differently: the coast warmed again while Montélimar stayed cooler.
These three sites offer a useful way to read a rainfall headline: check the amount, the time it took to fall, and the station where it was measured.
Editor’s note: Data current as of 10 October 2026. Hourly and six-minute observations cover complete UTC dates through 9 October; the last readings are at 23:00 and 23:54 UTC respectively. Daily source labels extend through 8 October. Some observations remain provisional.
Data Annex
Station metadata
Use the native Météo-France identifiers to select the same sites. Names and coordinates are corroborated by the official observation rows; named locations come from a separate API-derived inventory. WIGOS identifiers were not verified for this article.
| Station / named location | Provider ID | Latitude | Longitude | Elevation |
|---|---|---|---|---|
| Montélimar / Aerodrome | 26198001 |
44.581167 | 4.733000 | 73 m |
| Bormes-les-Mimosas / Le Ruscas Agro | 83019002 |
43.195167 | 6.379333 | 88 m |
| Cap Sagro / Semaphore | 20281001 |
42.798333 | 9.488667 | 111 m |
Rainfall values used in the lead chart
All reported peak timestamps are on 7 October 2026. Peak hours were selected from complete 5–9 October UTC observations. The total column uses the provider’s rain day beginning 7 October at 06:00 UTC.
| Station | Rain-day total | Largest reported hour | Reported time UTC / CEST | Hour’s share |
|---|---|---|---|---|
| Montélimar | 104.7 mm | 38.8 mm | 20:00 / 22:00 | 37% |
| Bormes-les-Mimosas | 97.0 mm | 50.0 mm | 12:00 / 14:00 | 52% |
| Cap Sagro | 87.3 mm | 46.3 mm | 08:00 / 10:00 | 53% |
How the charts were made
The downloads contain 216 hourly readings and 2,160 six-minute readings per station for 1–9 October UTC, with no missing selected temperature or rainfall values. The temperature chart shows 5–9 October local dates; the rain-peak search uses 5–9 October UTC. Daily observations are available through 8 October; the 9 October row is left empty.
Hourly temperature (T) is a reading at the observation time. Hourly rainfall (RR1) is an amount collected over one hour; the six-minute rainfall field (RR) covers six minutes. Daily rainfall uses the provider’s 06:00–06:00 UTC window, equivalent to 08:00–08:00 local time during this event.
The hourly and six-minute downloads retain Météo-France’s quality codes. Codes 0 and 1 indicate later validation; code 9 means first-level checks only, so those readings may still change. Doubtful code 2 and missing values were excluded. The main hourly rain peaks, daily totals and marked 13:00 temperatures all carry validated code 1. Every six-minute amount carries provisional code 9.
For the shaded hour, ten consecutive six-minute amounts were added and matched to the hourly report. Daily comparisons use the matching 24-hour rainfall window. The plots label reported times because the field dictionaries do not explicitly define whether a timestamp marks an interval’s beginning or end; the matching sums support the end-of-interval alignment used here.
These charts use the original Météo-France files. Use the article downloads to reproduce them; the live dashboard was not checked for an exact match and does not retain the quality columns. The three sites were selected as examples of the episode. No national average, historical ranking or climate-change attribution was calculated.
Download the hourly observations, six-minute observations, daily observations and station crosswalk.
Data Sources
Météo-France open climatological data: hourly, six-minute and daily datasets. The analysis uses the recent 2025–2026 department files for 20, 26 and 83.
Météo-France field dictionaries: hourly fields and quality codes, six-minute rain and daily rain and temperature fields.
Météo-France’s 7 October rain-episode update and 9 October retrospective. The former includes forecasts; station amounts here come from the observation files.
API-derived station inventory, with identifiers and coordinates checked against the official observation rows.
Locator map basemap: Natural Earth country outlines, 1:50m. Station positions use the verified coordinates in the station crosswalk.