WMO Climate Normals Guide: Station Baselines & CSV Export
Quick start
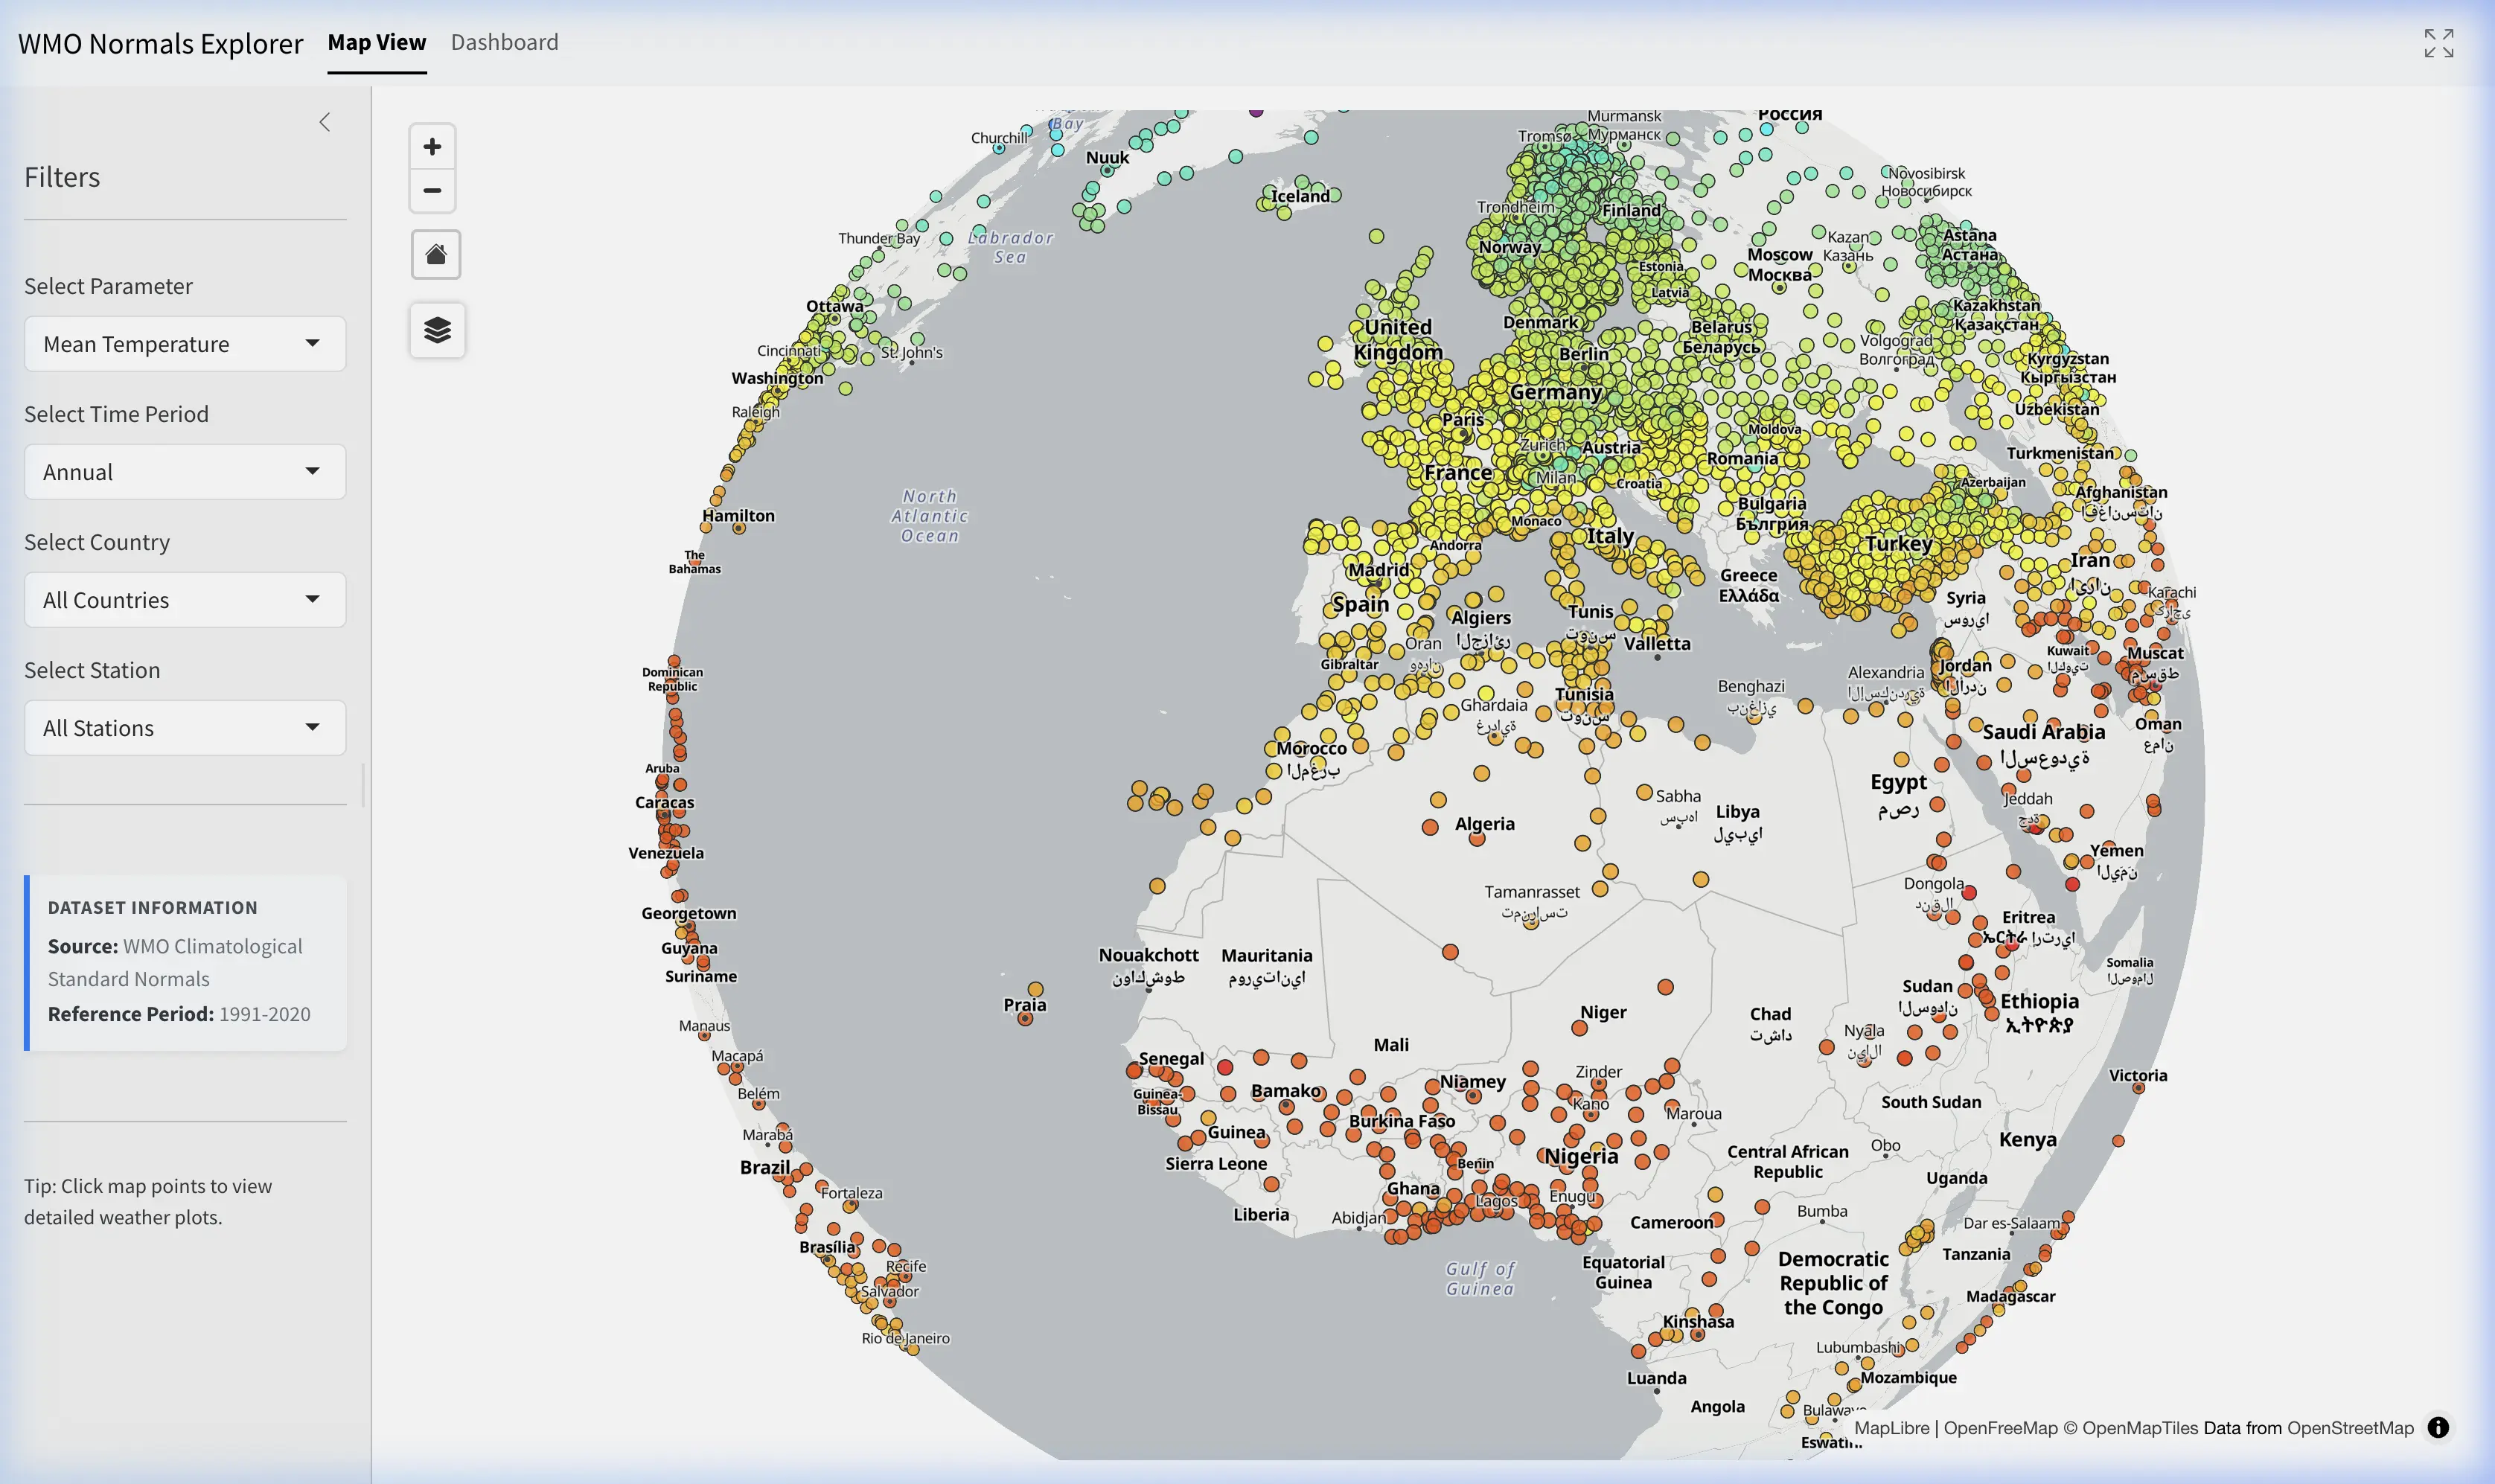
- Choose a normals period (1961–1990, 1981–2010, or 1991–2020), a parameter, and a month or Annual in the sidebar.
- Choose a country, then select a station or click its map point.
- Read the station’s monthly matrix and available charts in Dashboard.
- Select Export CSV to download every available primary parameter for that station.
Choose the right workflow
Use the WMO Normals Explorer when you want to browse or compare station baselines. This guide covers the repeatable station and download workflow. If your question is whether normals describe current climate, trends or extremes, read The Limits of WMO Normals in a Warming Climate before interpreting the result.
1. Set the normals period, parameter and time period
The map uses three controls together:
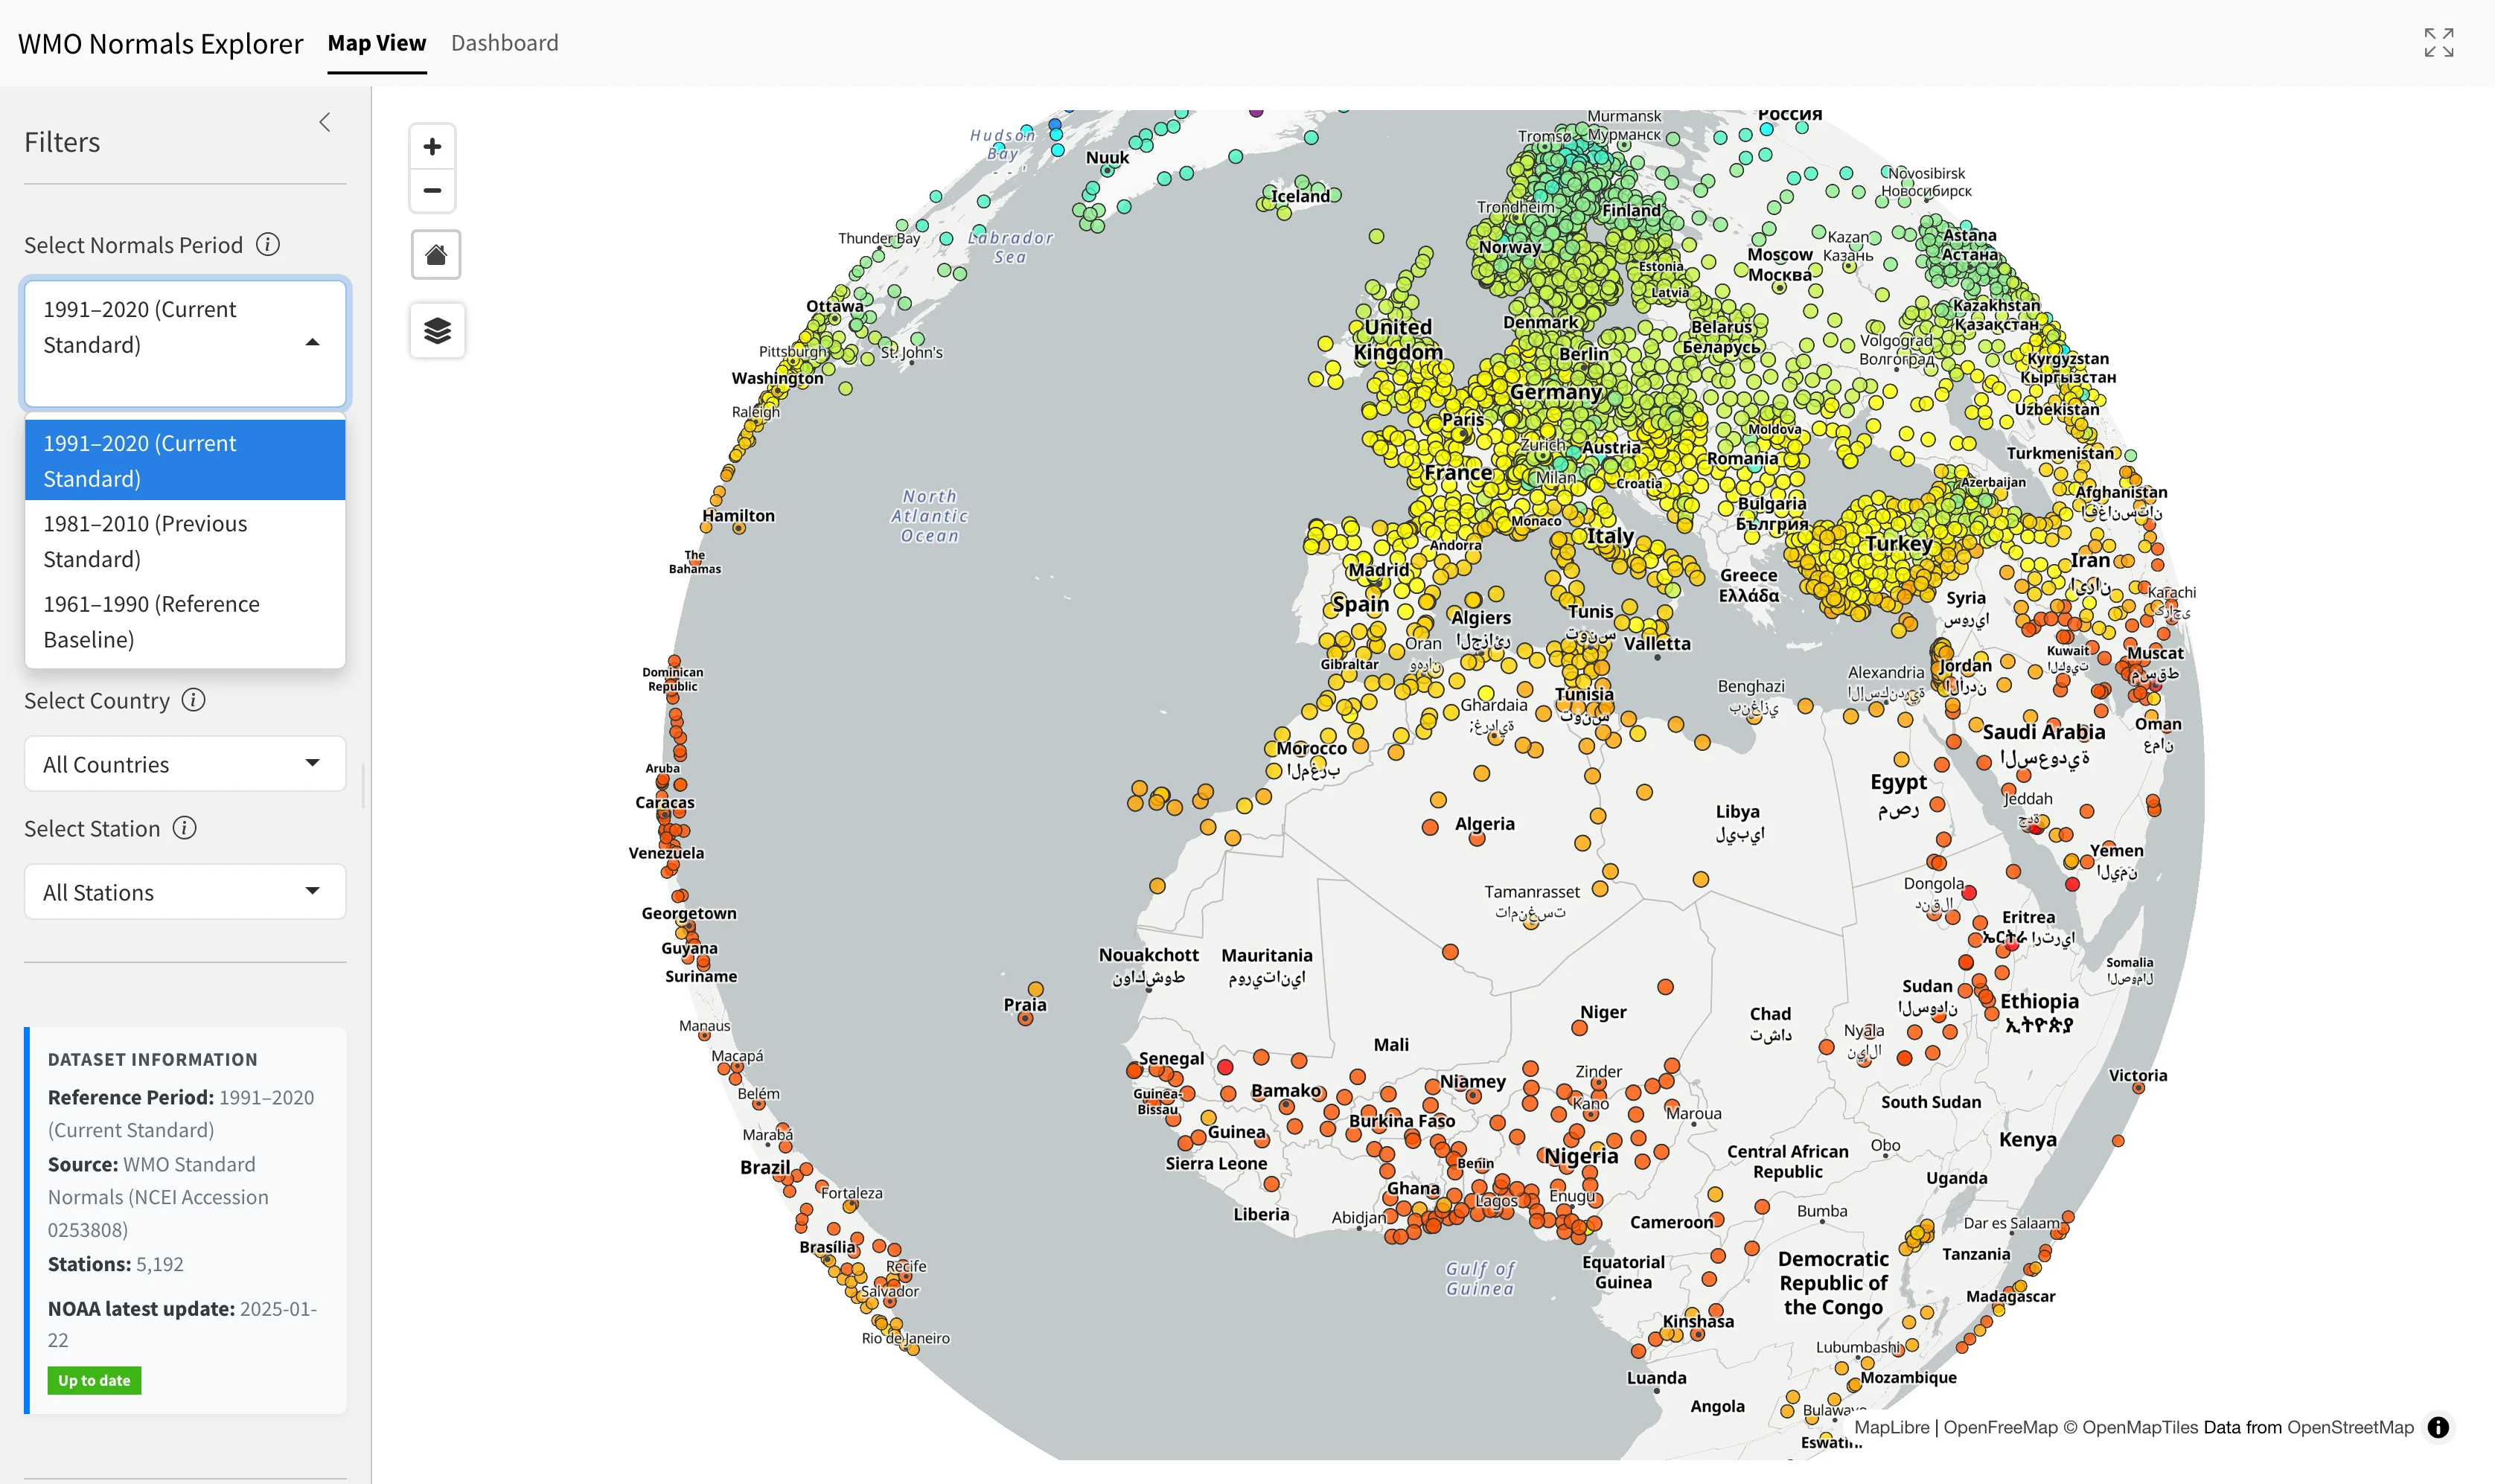
- Select Normals Period chooses the 30-year standard baseline: 1991–2020 (current standard), 1981–2010 (previous standard), or 1961–1990 (reference baseline).
- Select Parameter chooses one of eight layers: mean, maximum or minimum temperature; precipitation; precipitation days of at least 1 mm; mean sea-level pressure; mean vapor pressure; or sunshine duration.
- Select Time Period chooses Annual or one calendar month.
Changing any control updates the values and eligible station set on the map. A missing point does not necessarily mean that the station is absent from the WMO archive; it may not have a usable value for that particular period, parameter, or month.
2. Find and open a station
Choose a country to narrow the station list and zoom the map. Then either:
- choose a station from Select Station, or
- click a coloured station point on the map.
Both routes open the Dashboard. The header identifies the station name, country, legacy WMO ID, coordinates and elevation used by the Explorer. Record the ID when you need to reproduce or audit a selection; station names are not always unique.
- Full Screen View: Click the Maximize / Full Screen button in the top-right corner of the explorer window to expand the dashboard to full display size. This is recommended when inspecting complex multi-panel charts, high-density station maps, or large data tables. Press
Escor click the icon again to exit.
- Set Select Normals Period to 1991–2020, Select Parameter to Mean Temperature, and Select Time Period to Annual.
- Choose Germany under Select Country.
- Choose Bremen under Select Station.
- Confirm that the Dashboard header shows legacy WMO ID 10224.
- In the matrix, compare the June mean-temperature normal with the annual mean, then inspect the temperature and Walter–Lieth charts.
- Select Export CSV and confirm that the filename contains
10224.
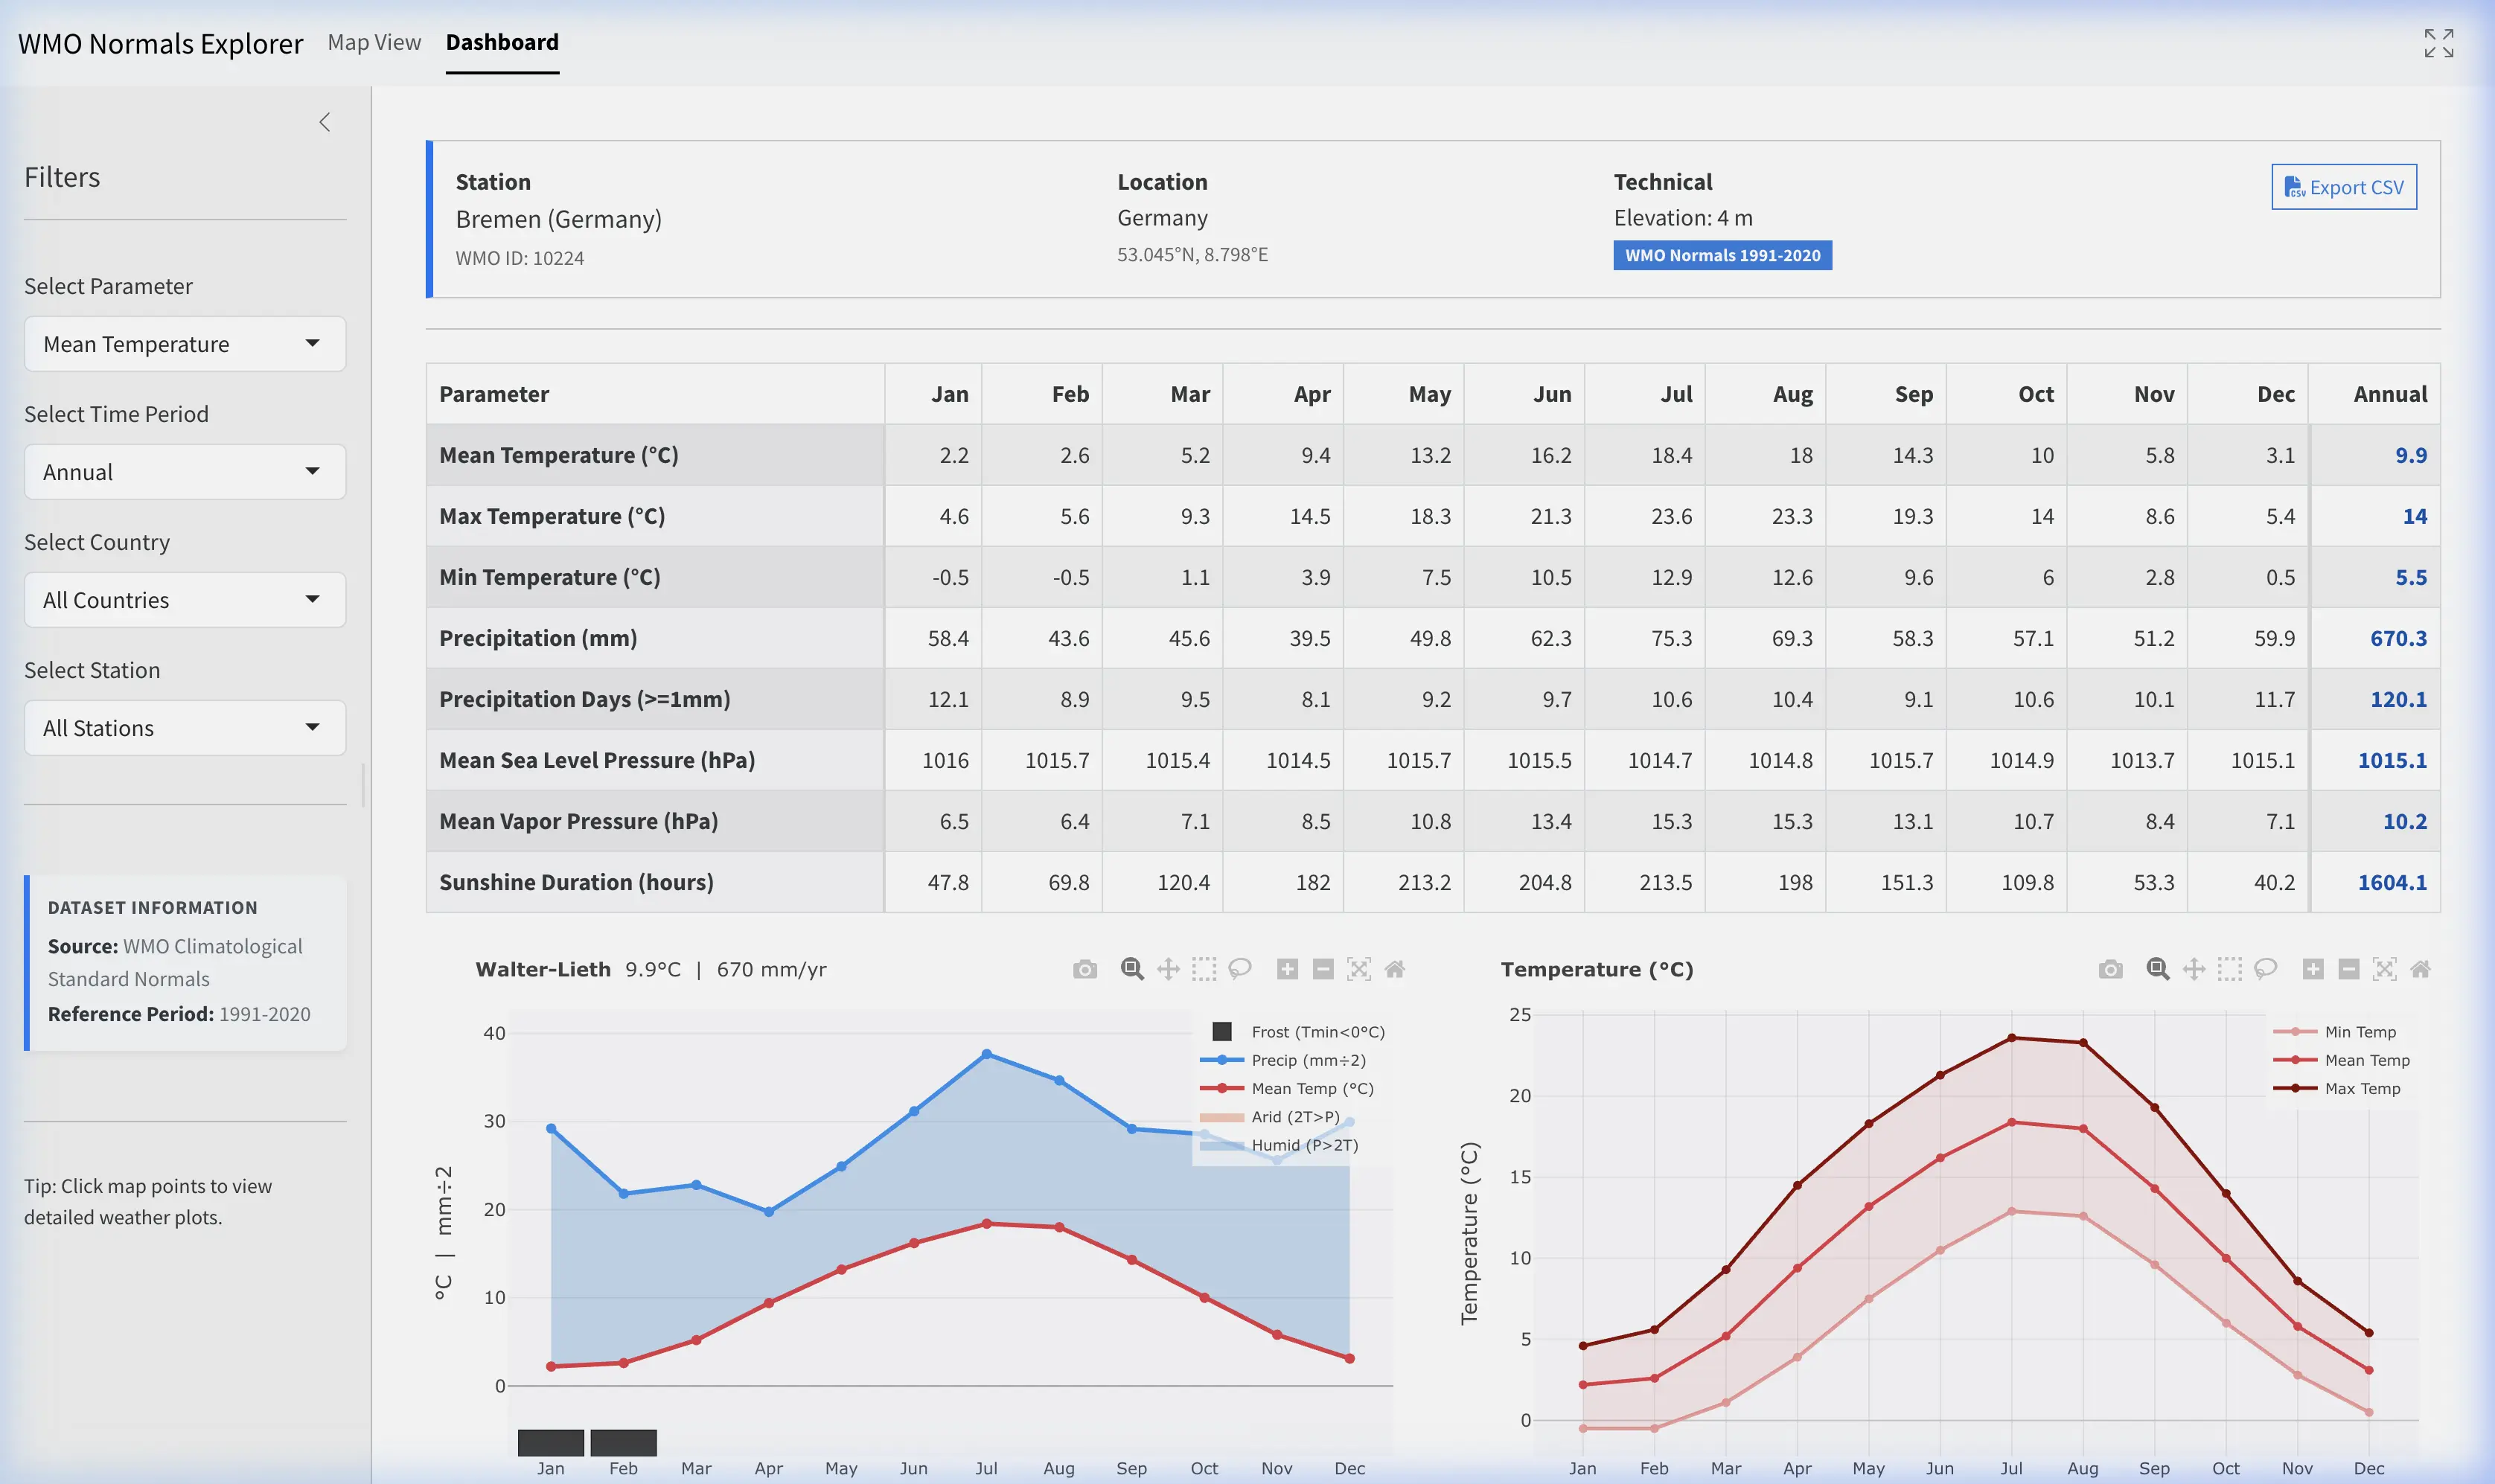
The screenshot below shows this station dashboard for the 1991–2020 baseline period. Its contents are a fixed reference baseline, not current Bremen weather.
3. Read the station matrix
The matrix has one row per available parameter and columns for January through December plus Annual. Blank or absent rows mean that the primary composite has no usable value for that station.
| Explorer row | Monthly value | Annual value | Unit |
|---|---|---|---|
| Mean, maximum or minimum temperature | Average for that calendar month over the selected 30-year period | Annual average | °C |
| Precipitation | Average total for that calendar month | Annual total | mm |
| Precipitation Days (≥1 mm) | Average count for that calendar month | Annual count | days |
| Mean Sea Level Pressure | Monthly average | Annual average | hPa |
| Mean Vapor Pressure | Monthly average | Annual average | hPa |
| Sunshine Duration | Average total hours for that calendar month | Annual total | hours |
Do not compare a temperature average directly with a precipitation total, or treat the Annual column as one universal calculation. Always keep the row definition and unit attached to the number.
4. Use the charts without over-reading them
The dashboard creates only the charts supported by the selected station’s available parameters:
- Walter–Lieth diagram places mean temperature and precipitation on a shared seasonal chart; its scaling is intended to show relative humid and arid periods, not to convert rainfall into temperature.
- Temperature curves compare monthly mean maximum, mean and minimum temperature.
- Precipitation, precipitation days, pressure, vapor pressure and sunshine panels show the annual cycle for their respective variables.
These plots describe the selected 30-year baseline (such as 1991–2020 or 1961–1990). They do not show individual years, recent observations, trends, forecasts or record extremes.
5. Export a station CSV
After a station is open in the Dashboard:
- Select Export CSV in the station header.
- Save the file named
WMO_Normals_<Period>_<WMO-ID>.csv(for example,WMO_Normals_1991-2020_10224.csv). - Confirm that the first column is
Parameterand the remaining columns run fromJanthroughDecandAnnual. - Keep blank cells as missing values. Do not replace them with zero.
- Store the station name, WMO ID, reference period and access date with your analysis.
The export combines every primary parameter available for the selected station, not only the parameter that was active on the map.
6. Compare two stations safely
For a defensible comparison:
- Use the same parameter, month and unit for both stations.
- Record each station’s WMO ID, coordinates and elevation.
- Check whether both values come from the same reference period (for example, both from 1991–2020, or both from 1961–1990).
- Note differences in altitude, coast proximity, urban setting and exposure.
- Treat the result as a point-to-point station comparison, not automatically as a city, national or regional comparison.
If you combine a normal with observations, match the same station identity and compatible variable. For example, a June WMO mean daily maximum is not the same measure as one instantaneous temperature observation. See the European capitals comparison for a worked example with that limitation stated explicitly.
7. Troubleshooting
- The station list is shorter than expected
-
The list follows the selected parameter. Try another parameter or choose All Countries.
- Changing the parameter returns to the map
-
This is expected. The app clears the active Dashboard selection so the map can show the new eligible station set.
- A dashboard row or chart is missing
-
That parameter is not available for the selected station in the Explorer’s primary composite tables.
- The annual value looks inconsistent with the months
-
Check whether the variable is an average, total or count. Do not recalculate an annual field without consulting the source documentation.
- Two nearby stations differ
-
Verify their IDs, coordinates, elevation and setting. Nearby does not mean climatologically interchangeable.
- You need recent weather or a trend
-
Use EuroMeteo observations for recent European station data or the GHCNm guide for long monthly temperature series.
8. Official source and data threshold
WMO Members calculate and submit the normals. NOAA NCEI archives the global collection and publishes primary-parameter composites across standard normal periods (1961–1990, 1981–2010, and 1991–2020). The Explorer uses composite variants containing normals computed with at least 24 years of data in each 30-year period; where the number of years was not supplied, NCEI states that 30 years is assumed.
Methods and documentation can still vary by country. Consult the NOAA NCEI WMO Climate Normals documentation and the WMO Guidelines on the Calculation of Climate Normals when calculation details matter.