The Limits of WMO Normals in a Warming Climate
WMO climatological normals are one of the most useful reference products in climate science. The World Meteorological Organization describes them as both a benchmark for assessing current conditions and an indicator of the conditions likely to be experienced at a location over the long term.
That usefulness also creates the main source of confusion. People often ask normals to answer questions about rapid warming, recent extremes, or present-day climate risk. Those are important questions, but normals were never designed to answer all of them on their own.
These are structural limits of climatological normals themselves, not bugs in the Climate Explorer interface.
If you want to inspect the actual 1991-2020 station normals themselves, start with the WMO Normals Explorer, which provides direct access to the official station-based normal values shown in Climate Explorer.
Problem 1: The Baseline Is Fixed While the Climate Keeps Moving
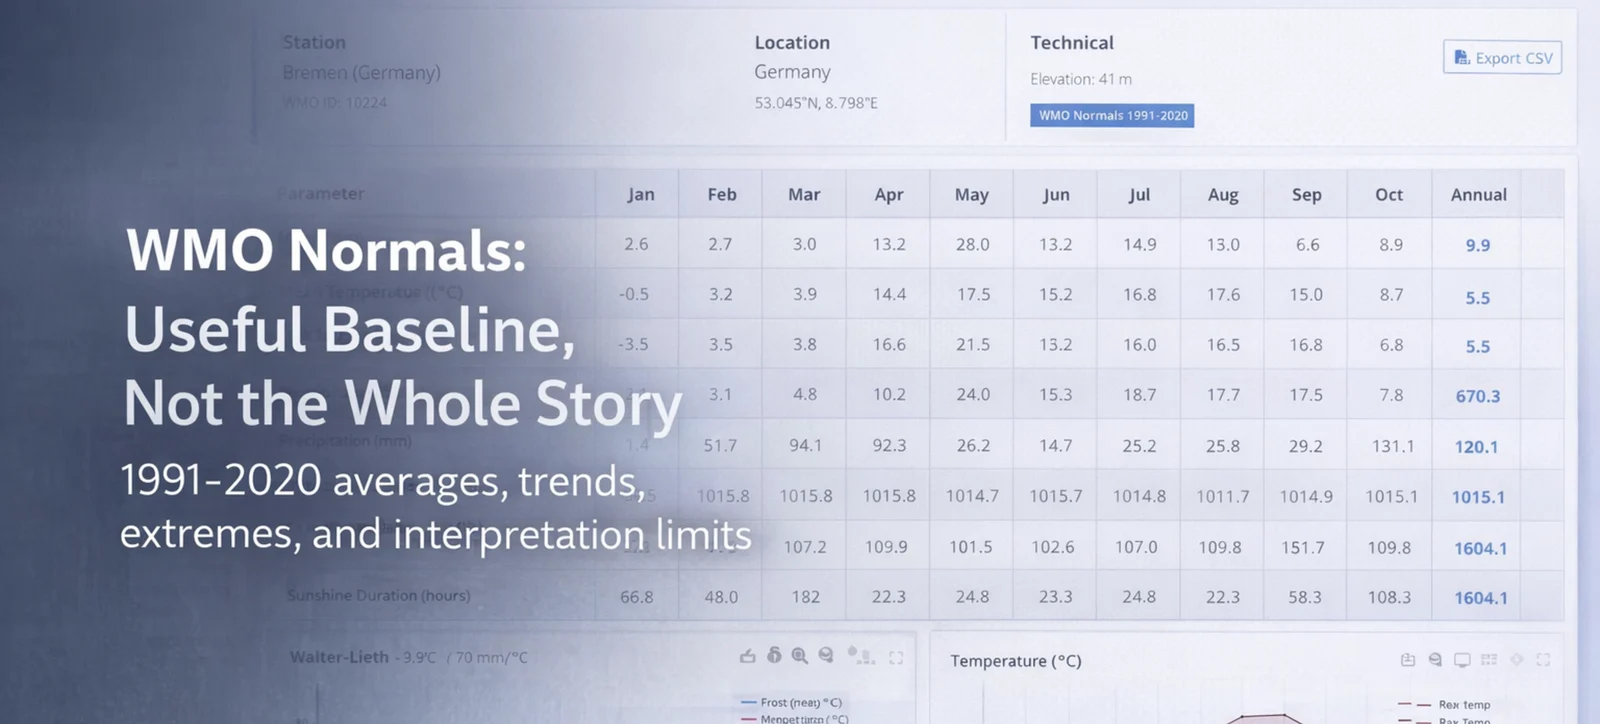
The current WMO climatological standard normals refer to 1 January 1991 to 31 December 2020. That makes them far more relevant than older baselines, but they are still fixed averages over a closed 30-year window.
The most recent standard normal and the long-term climate-change reference period serve different purposes. WMO recommends 1991–2020 for many operational applications because it better represents recently experienced conditions. For long-term climate-change assessment, WMO retains 1961–1990 as a fixed reference period, while global warming relative to pre-industrial conditions is commonly assessed against 1850–1900. WMO Climatological Normals, WMO explanation of reference periods.
If a station has warmed notably after 2020, the normal will not capture that newer shift. In practice, a place can feel warmer than normal very often not because the normal is wrong, but because the climate has continued changing since the baseline ended.
This is exactly why the WMO updated the definition of climatological standard normals in 2015 to use the most recent 30-year period ending in a year ending with 0, rather than waiting for older non-overlapping standards. Even so, every normal is still a backward-looking reference.
Problem 2: Averages Hide Trends Inside the 30-Year Window
Normals compress three decades into a single monthly or annual value. That is ideal for building a baseline, but it hides the direction and shape of change inside the period.
For example, a station could warm steadily from the early 1990s to the late 2010s and still end up represented by one mean value. Likewise, a rainfall regime could become more erratic while the final precipitation normal changes only modestly.
What normals do well is summarize typical conditions. What they do less well is reveal whether the climate was stable, drifting, or shifting rapidly during the baseline itself.
Problem 3: Standard Normals Do Not Describe Extremes
Monthly and annual standard normals summarize average conditions or totals. They do not, by themselves, describe the frequency, duration, timing or intensity of extreme events.
A monthly precipitation normal can tell you how wet a place usually is. It cannot tell you whether rain now falls in fewer but more intense bursts. A temperature normal can tell you the average thermal background. It cannot tell you how often a place experiences severe heat waves, tropical nights, or record-breaking winter warm spells.
This is why normals are best treated as a first layer of interpretation, not the final answer for hazard, impact, or event analysis.
A Better Complement for Extreme Events: Climate Indices
When the real question is about extreme events, climatological normals are often best paired with climate indices derived from daily observations.
These indices are designed to capture the kinds of changes that matter for impacts and risk. Examples include the annual hottest day, tropical nights, warm day and warm night frequency, maximum 1-day precipitation, maximum 5-day precipitation, and consecutive dry days.
In practice, climate indices help answer questions that normals cannot answer well on their own:
- are heavy rainfall events becoming more intense?
- are hot nights becoming more frequent?
- are dry spells becoming longer or more persistent?
- are threshold-based extremes changing faster than the mean climate?
That is the key distinction: normals describe the baseline, while climate indices quantify selected characteristics of extremes, including their frequency, intensity, duration or persistence.
Problem 4: A Station Normal Is Not the Same as a Regional Climate
In the WMO 1991–2020 collection displayed by Climate Explorer, each normal is associated with a reporting station rather than an entire landscape.
Stations sit at specific elevations, exposures, and land-use settings. A downtown observatory, a coastal airport, and a nearby hillside site can all show meaningfully different normals even when they are part of the same urban area.
That makes normals highly informative, but still local. Problems appear when users treat a point normal as a perfect stand-in for a whole city, valley, or mountain region.
Problem 5: Global Standardization Does Not Remove Coverage Differences
The WMO collection is globally coordinated, but the records are submitted by national meteorological and hydrological services rather than recalculated centrally inside Climate Explorer.
In practice, that means some important differences remain:
- parameter availability varies by station
- station density differs sharply by country
- local station history still affects interpretation
- comparisons work best when you match the same variable, month, and station context
So the collection is standardized in purpose and structure, but not every station has the same observational depth or representativeness.
Station histories also matter. Relocations, instrument changes, observing-practice changes and changes in the surrounding environment can introduce discontinuities. National services may apply quality control, homogenization or adjusted-normal methods, so small differences should be interpreted alongside the available station metadata.
How to Use WMO Normals Well
The best way to use WMO normals is to treat them as a baseline layer, then add other data depending on the question:
- start with the WMO Normals Explorer if you want to inspect the actual station normals for 1991-2020
- use normals to understand the typical climate of a station
- compare monthly values when seasonality matters
- pair normals with long station series when you care about trends
- use climate indices from daily data when you care about threshold exceedance, persistence, or event severity
- switch to daily or hourly archives when you care about extremes or recent volatility
Inside Climate Explorer, the WMO Normals Explorer works best when paired with tools such as GHCNm for long-term monthly trends or country-specific daily and hourly archives when event-level detail matters.
Conclusion
The main problem with WMO normals is not that they are flawed. It is that they are often asked to do more than they were designed to do.
Used correctly, they are one of the clearest ways to describe a station’s baseline climate. Used alone, they can understate rapid recent change, hide extremes, and encourage overconfident regional comparisons.
That is why the most reliable reading of a WMO normal is as a starting point: a stable climate reference that becomes much more powerful when combined with station history, trend analysis, and higher-frequency observations.
References
Frequently Asked Questions (FAQ)
Are WMO normals outdated?
No. The 1991–2020 period remains the most recent WMO climatological standard normal for many operational applications. It is a fixed baseline rather than a live summary of post-2020 conditions. For long-term climate-change assessment, WMO retains 1961–1990 as a fixed reference period.
Can WMO normals show climate change by themselves?
Not very well. A single set of normals summarizes a period, but it does not reveal how the station changed within that period. Trend datasets and historical station series are better for that job.
Why can two nearby stations have different WMO normals?
Because station normals are local. Elevation, exposure, distance from the coast, urbanization, and instrument setting all influence the climate measured at a station.
What should I use if I care about extremes or recent weather shifts?
Use normals for baseline context, then move to historical daily, hourly, or monthly series depending on the question. Climate indices such as hottest-day, heavy-rainfall, warm-night, or consecutive-dry-day metrics are often more useful for extreme-event analysis than normals alone. In Climate Explorer, start with the WMO Normals Explorer for the actual 1991-2020 normals, then use tools like GHCNm and the national station archives for trend and event-level analysis.
Data Sources
- WMO Climatological Standard Normals: Baseline periods established by the World Meteorological Organization.