IMGW-PIB Polish Meteorological Data Guide: Stations & Excel Export
Quick start
- Open the explorer and choose Hourly, Daily, or Monthly.
- Set a date range, then find a station on the map or in Stations Info.
- Double-click a station-table row or select a map point and wait for the dashboard to load.
- Confirm the station name and actual loaded period before reading the plots.
- Inspect Data, then select Export Excel to download the loaded table as
.xlsx.
What this guide helps you do
The IMGW-PIB Explorer is an independent interface for selected public meteorological files from Poland’s Institute of Meteorology and Water Management – National Research Institute. It supports manageable station-level searches while the official IMGW-PIB archive remains the authoritative source.
Climate Explorer downloads relevant ZIP archives, reads their CSV contents, joins files for the selected period, translates many source codes into English labels, builds plots and produces the workbook export. It does not replace IMGW-PIB field definitions, status codes, corrections or reuse conditions.
1. Choose the resolution and date window
The resolution determines both the source folders and the maximum interval accepted by the interface.
| Explorer mode | Source interval | Maximum accepted window | Best use |
|---|---|---|---|
| Hourly | Provider terminowe records |
93 days (about 3 months) | Within-day weather evolution and event timing |
| Daily | Provider dobowe records |
366 days (about 1 year) | Events, seasons and daily extremes |
| Monthly | Provider miesieczne records |
2,191 days (about 6 years) | Multi-year and seasonal station context |
Daily mode initially opens with roughly one year ending on the current date. Selecting Monthly resets the range to approximately six years. If a requested window exceeds the applicable limit, the app adjusts one boundary and shows a warning.
The date range also filters the station catalogue. A station must overlap the selected period in the explorer metadata, so the displayed count can change before observations are loaded.
An hourly row describes the source time step; it does not mean the archive is republished every hour. IMGW-PIB documents monthly file publication schedules: synoptic records around the fifth working day after month-end, and climatological or observer-operated precipitation records on a longer schedule.
2. Find a station on the map
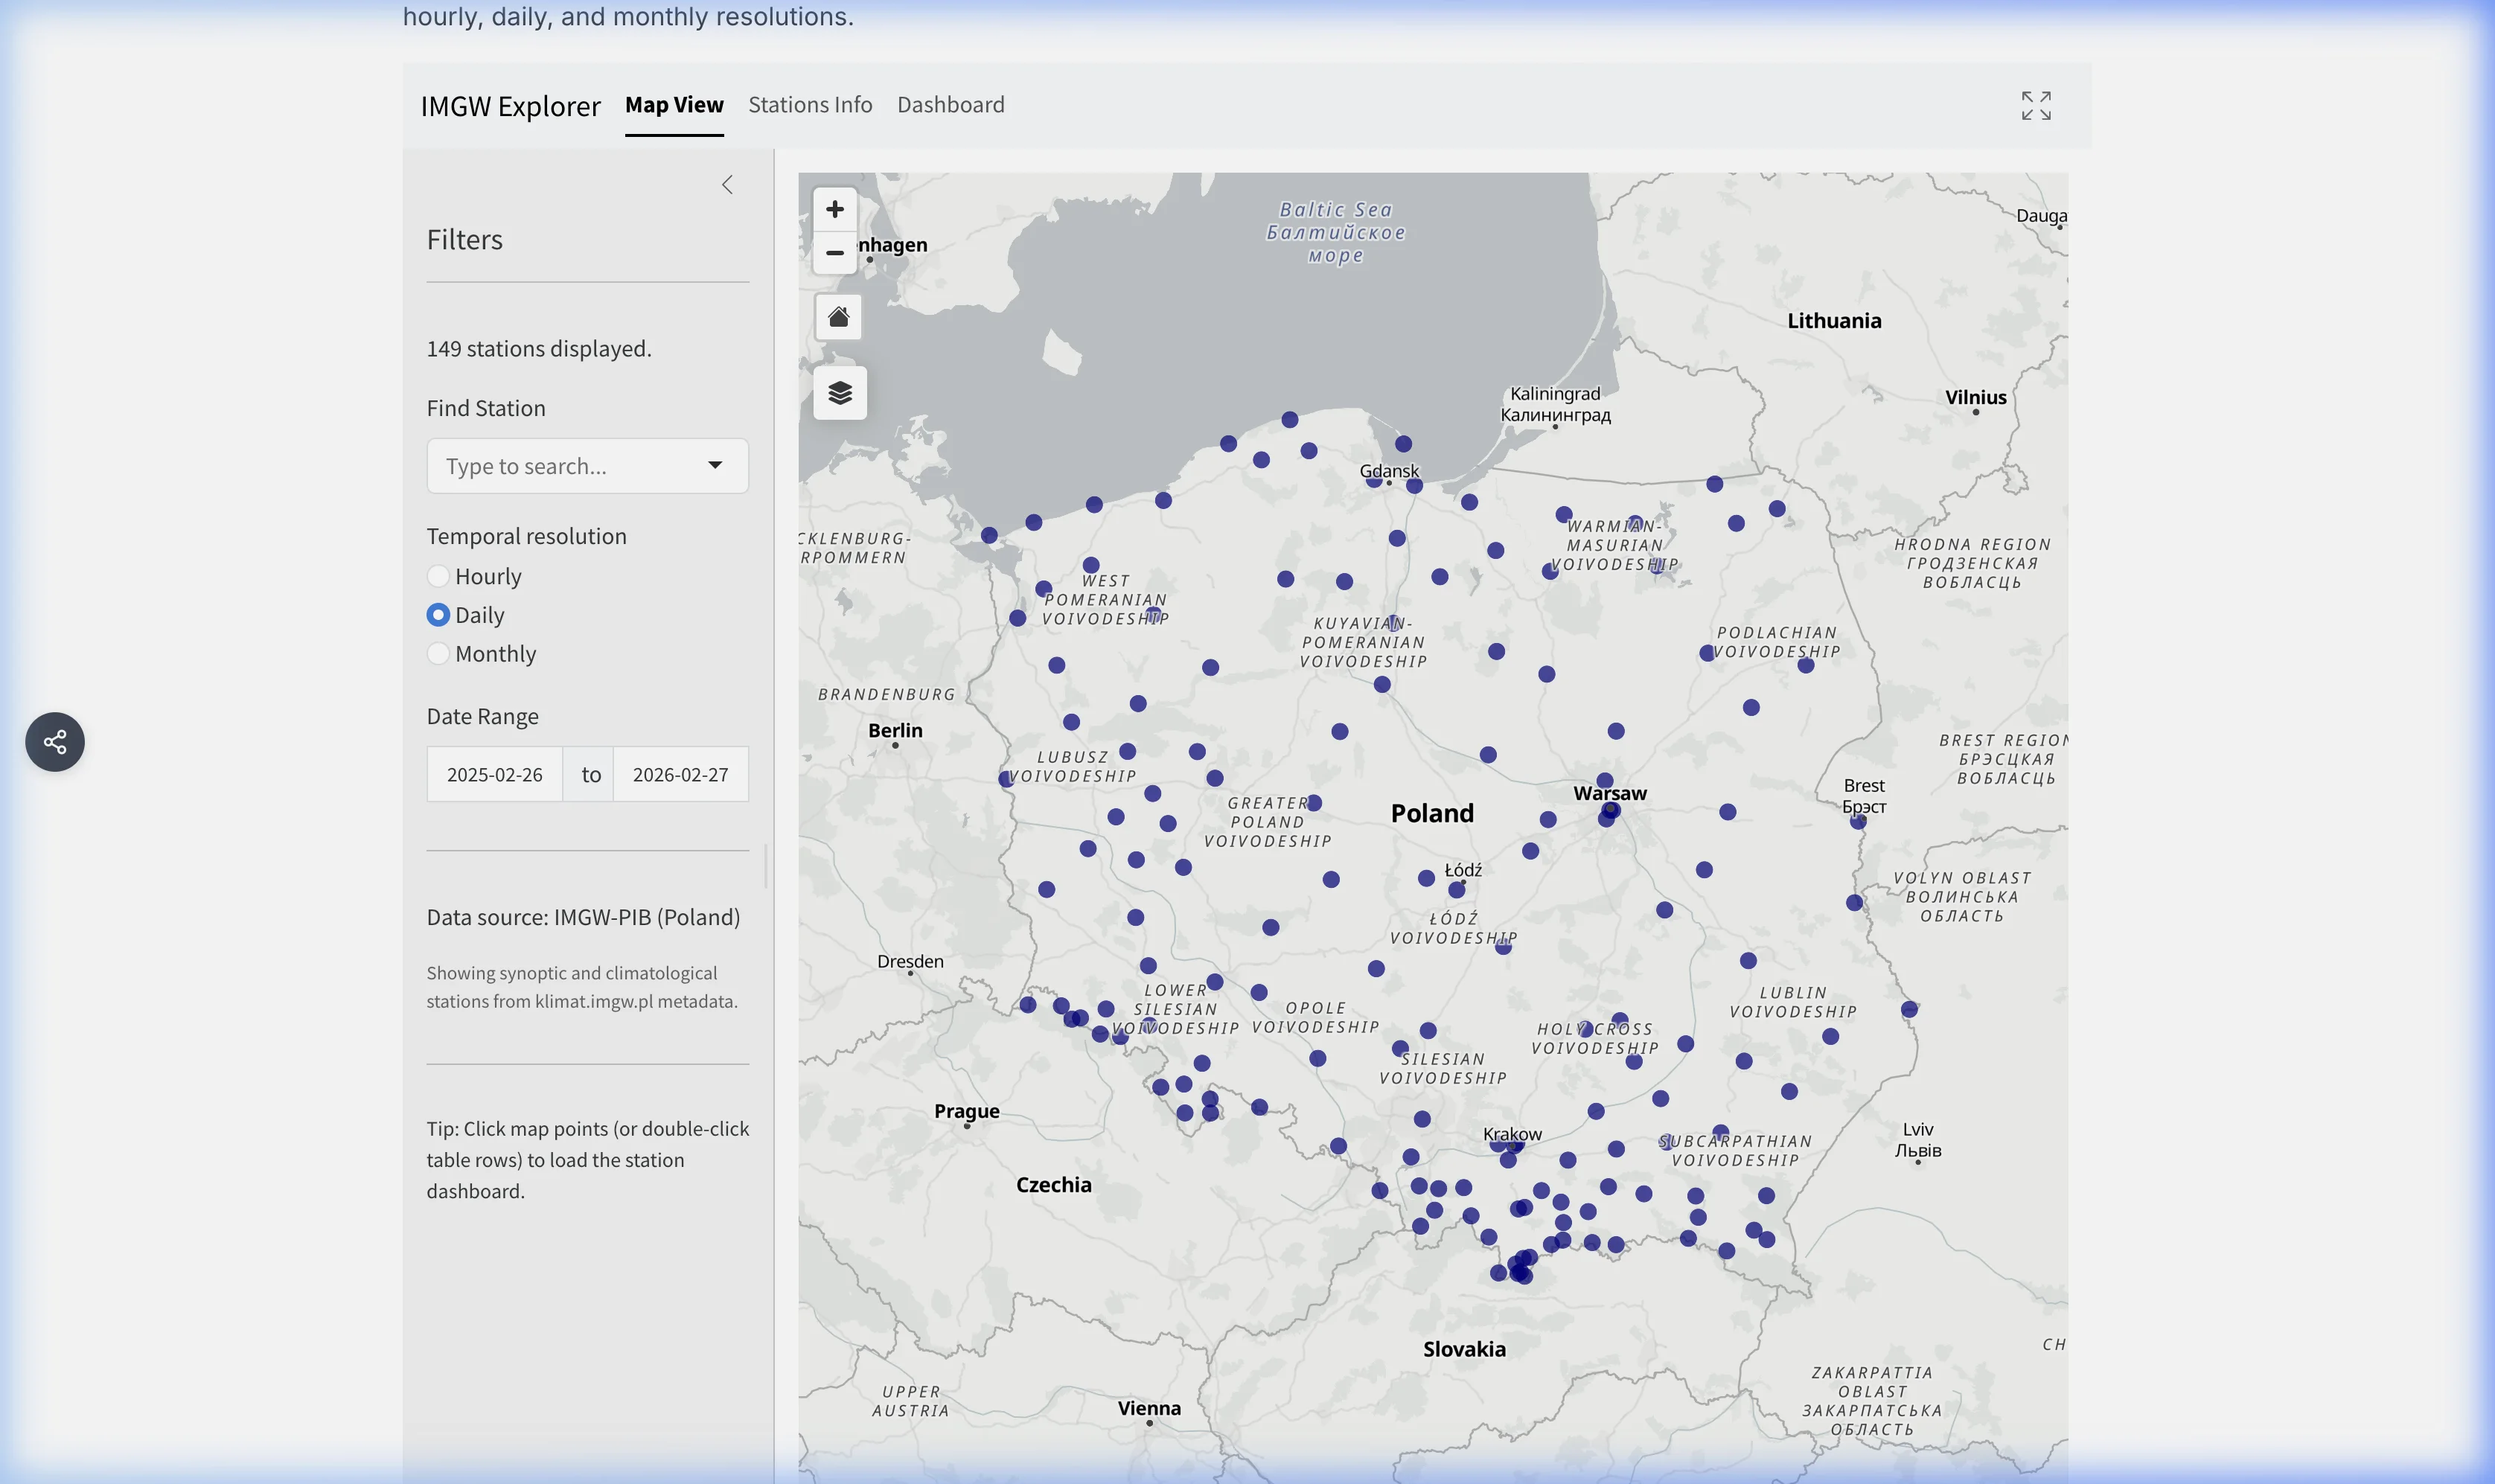
Use Find Station to search the filtered catalogue, or select a marker. The Home control returns to the extent of all currently eligible stations. The map in this guide shows the Daily network across Poland with Białystok selected.
Map controls also provide zoom and basemap choices. Use the Maximize control in the explorer header when station clusters, plots or tables need more room; press Esc to exit full-screen mode.
3. Check station metadata before loading
Open Stations Info to compare identifiers and availability before choosing a series.
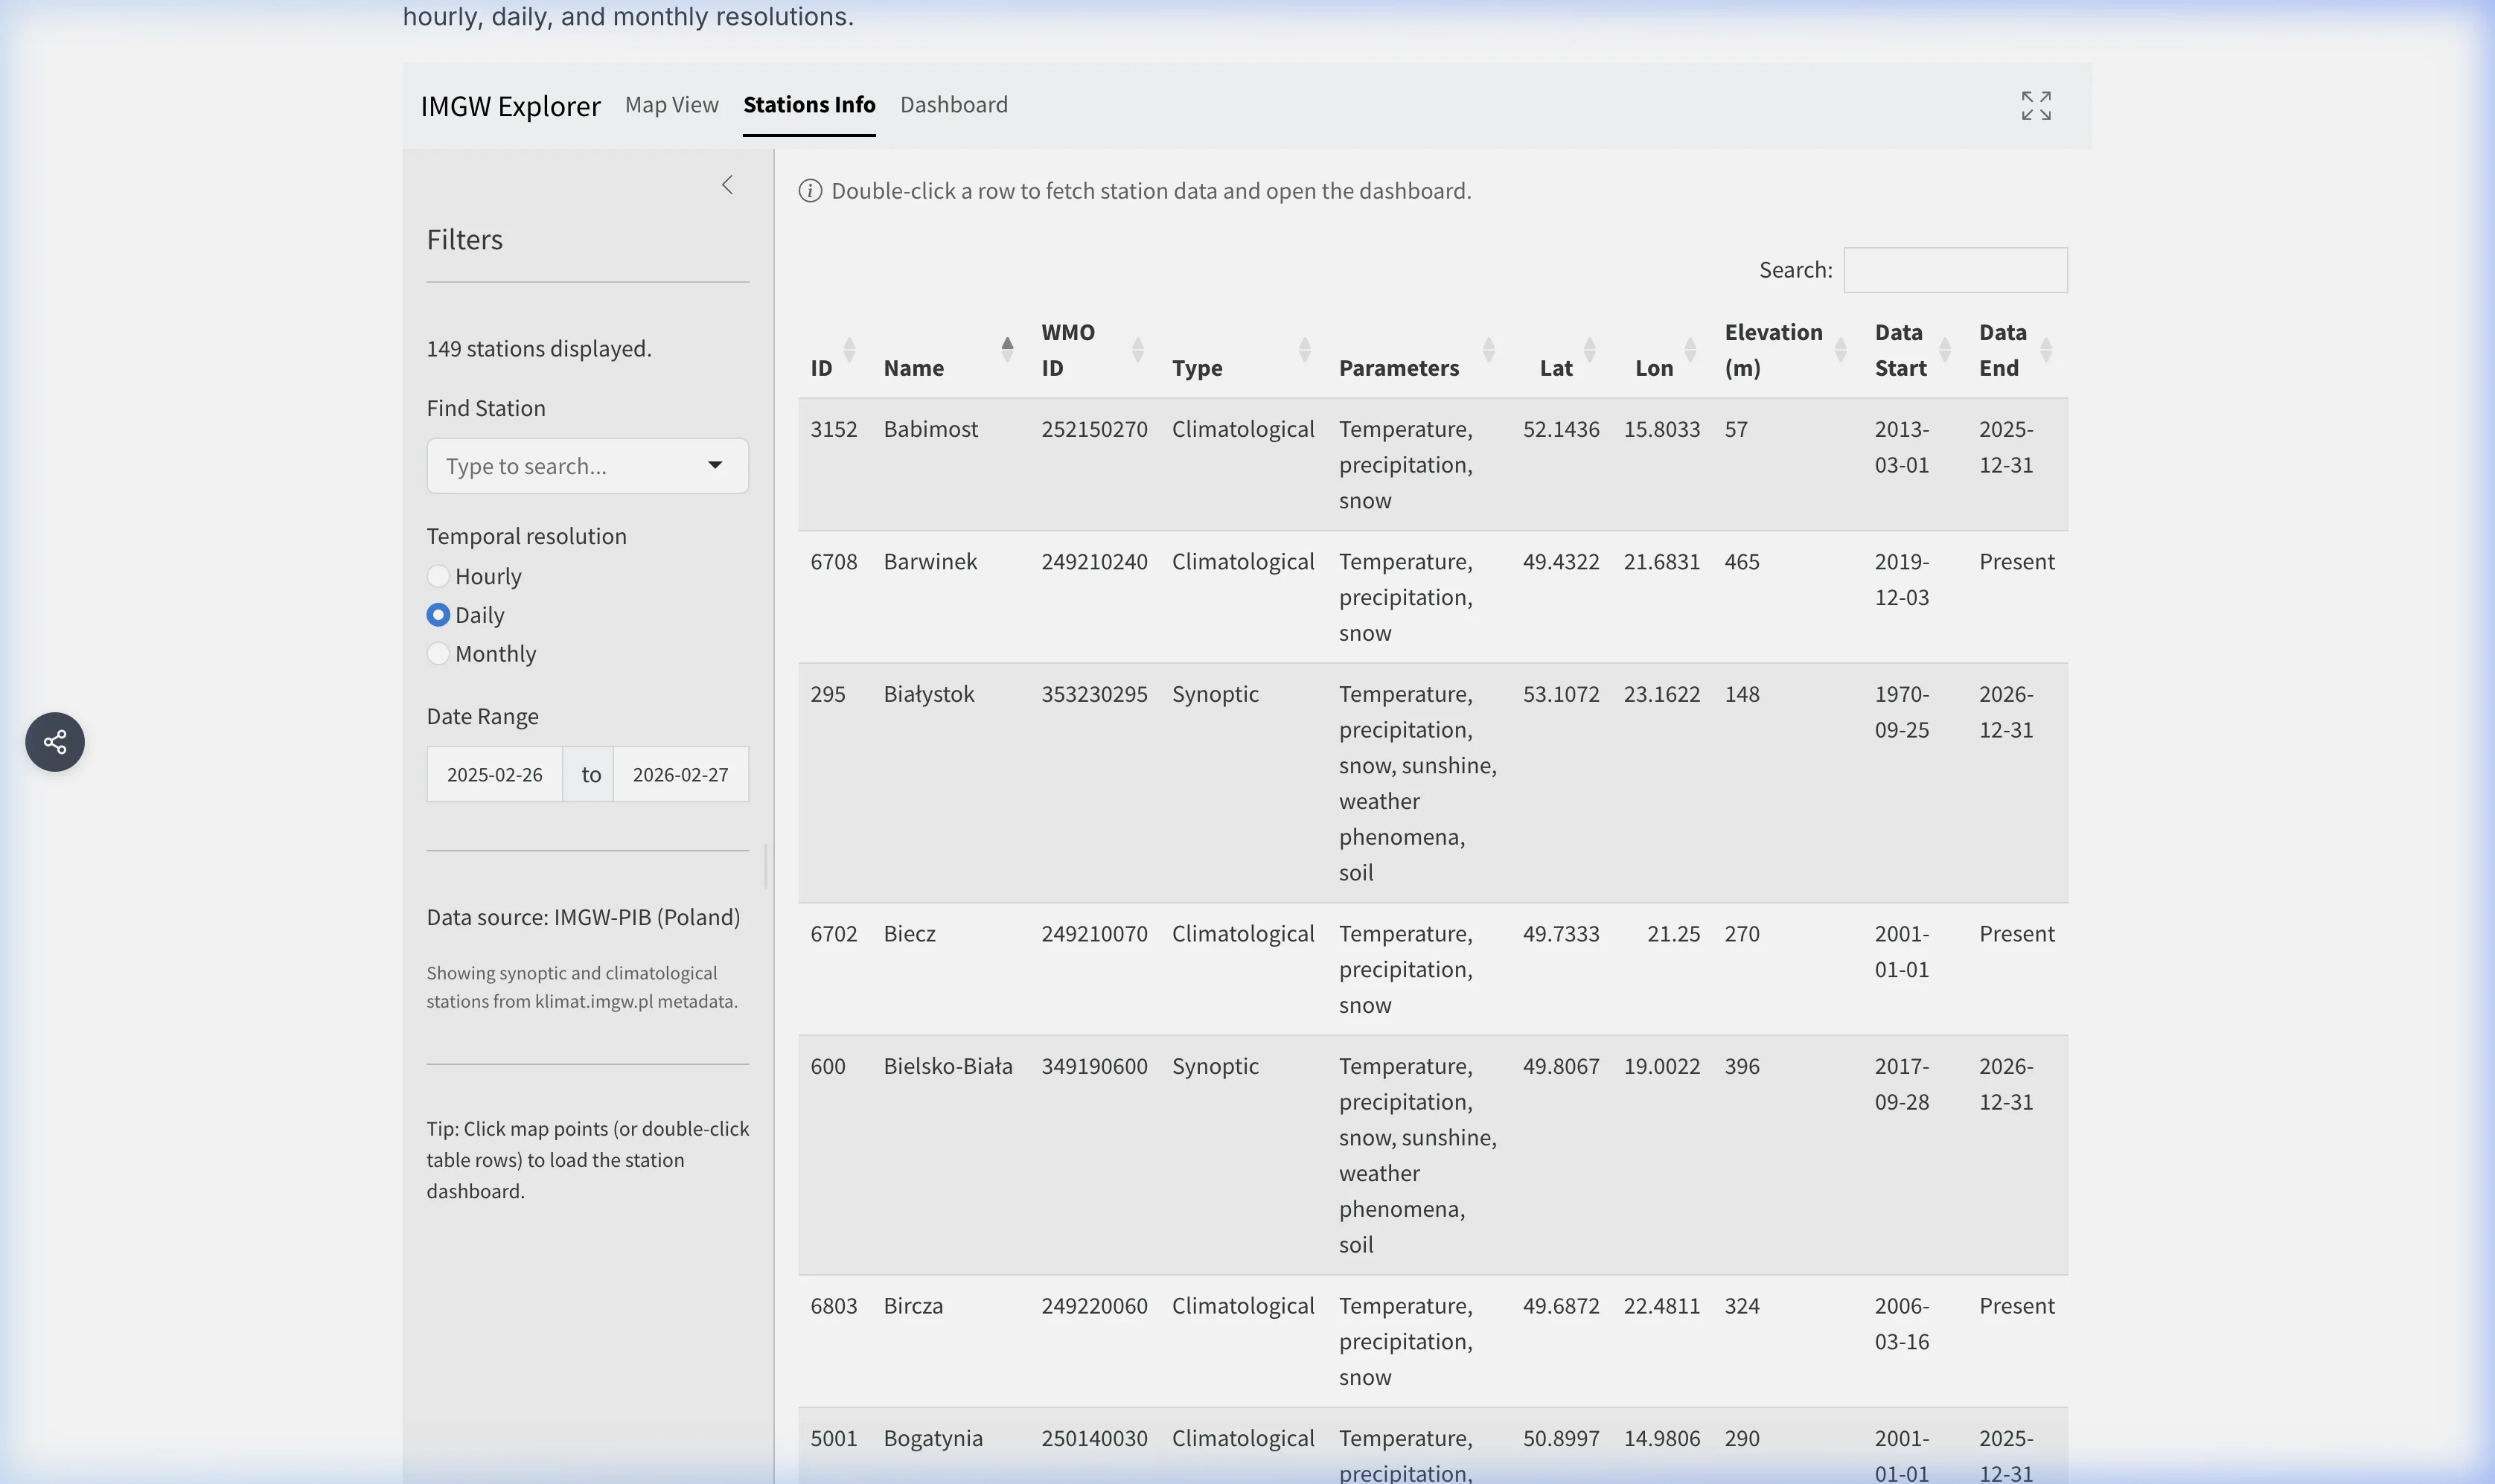
The visible columns include:
- IMGW station ID and station name;
- WMO identifier as represented in the explorer metadata;
SynopticorClimatologicaltype;- represented parameter groups;
- latitude, longitude and elevation; and
- metadata start and end dates.
Double-click a row on desktop to fetch observations and open the dashboard. Treat the type and parameter labels as catalogue classifications, not proof of present staffing, instruments or complete reporting throughout the metadata period.
4. Confirm the loaded station and period
The dashboard header must show the selected station, IMGW and WMO identifiers, coordinates, elevation, station type, resolution, row count, and the actual dates found in the parsed files.
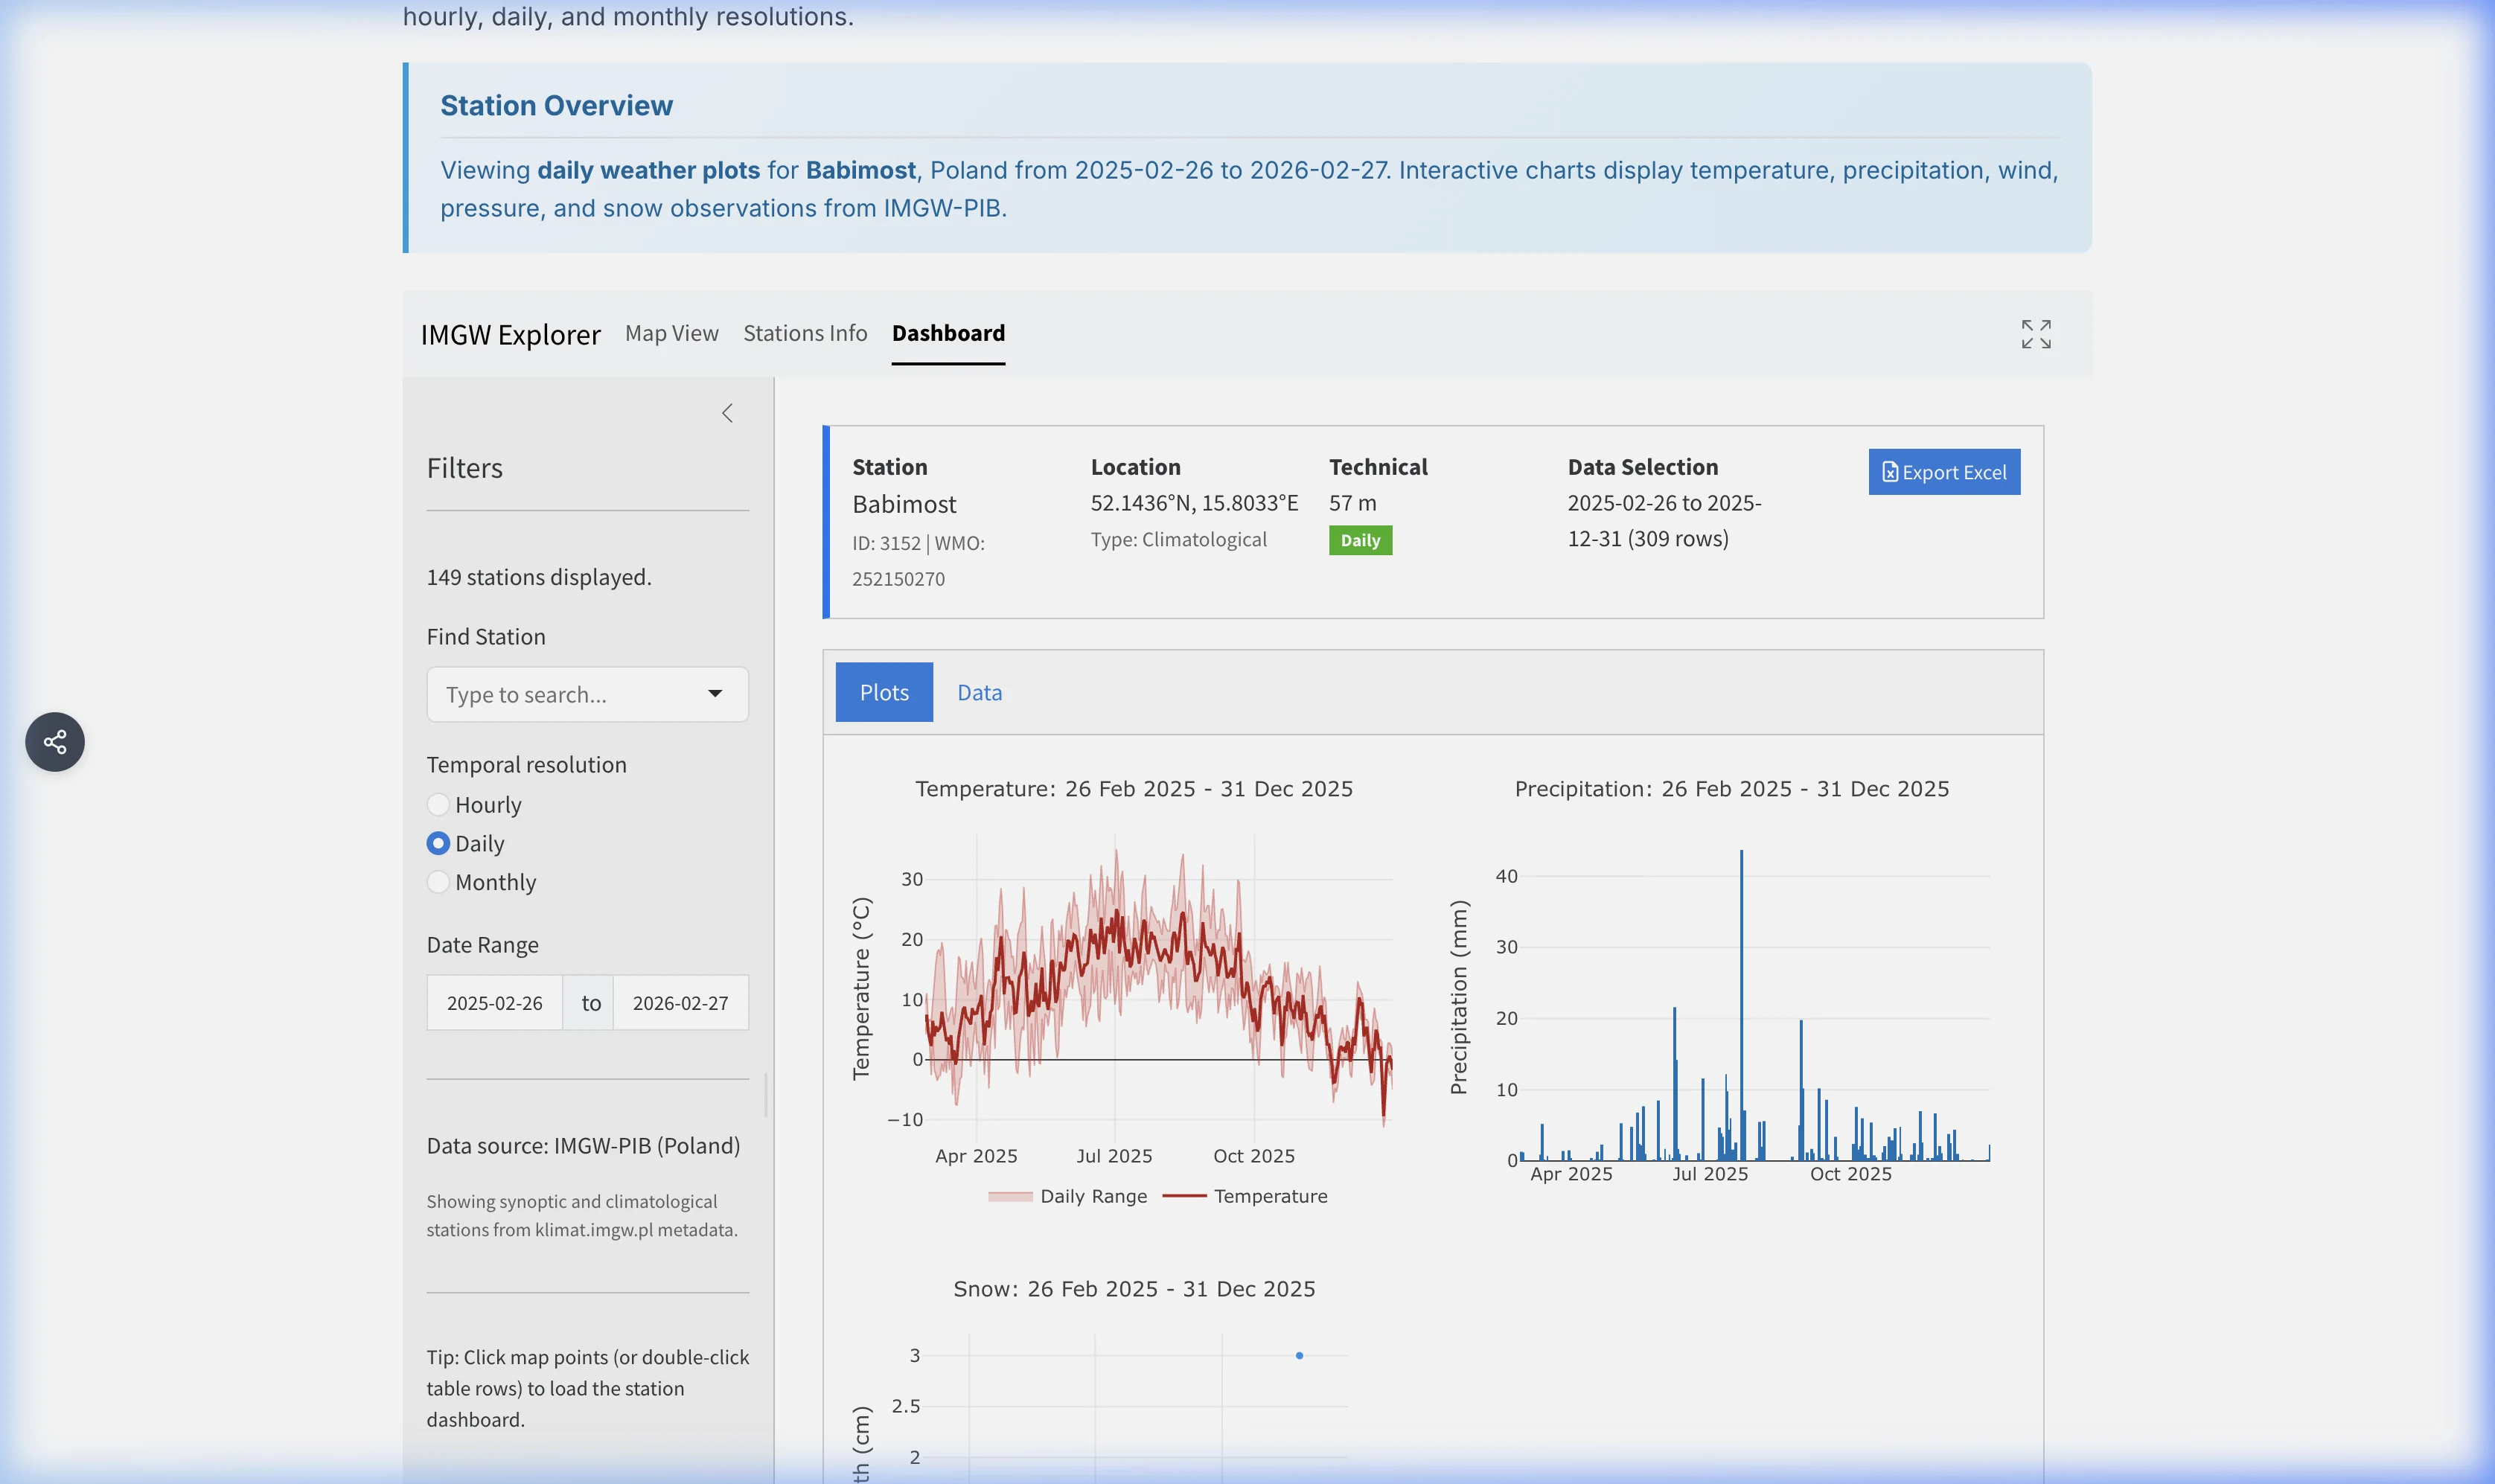
In the captured example, Białystok station 295 (WMO metadata identifier 353230295) returned 339 Daily rows from 27 August 2025 through 31 July 2026, even though the requested end date was 28 August 2026. Always record the Data Selection period rather than assuming that a requested end date is an available observation.
Summary cards describe only the loaded selection. They are not climate normals, and their averages, extremes, totals and latest values change with the station, resolution and dates.
5. Read plots as point observations
The Plots tab builds panels only when the loaded table contains usable values. Depending on the source family, these can include temperature, precipitation, wind, humidity, sunshine, pressure, solar radiation and snow.
The plots describe one observing site. Elevation, exposure, land cover, station moves and the available period affect interpretation. Do not infer a national trend or voivodeship-wide event from one station without corroboration.
Visual zoom changes only the chart view. It does not change the workbook. To export a different period, update the date range and wait for the station data to reload.
6. Inspect fields and status codes
Open Data before exporting. This verifies that rows finished loading and shows which measurements are populated.
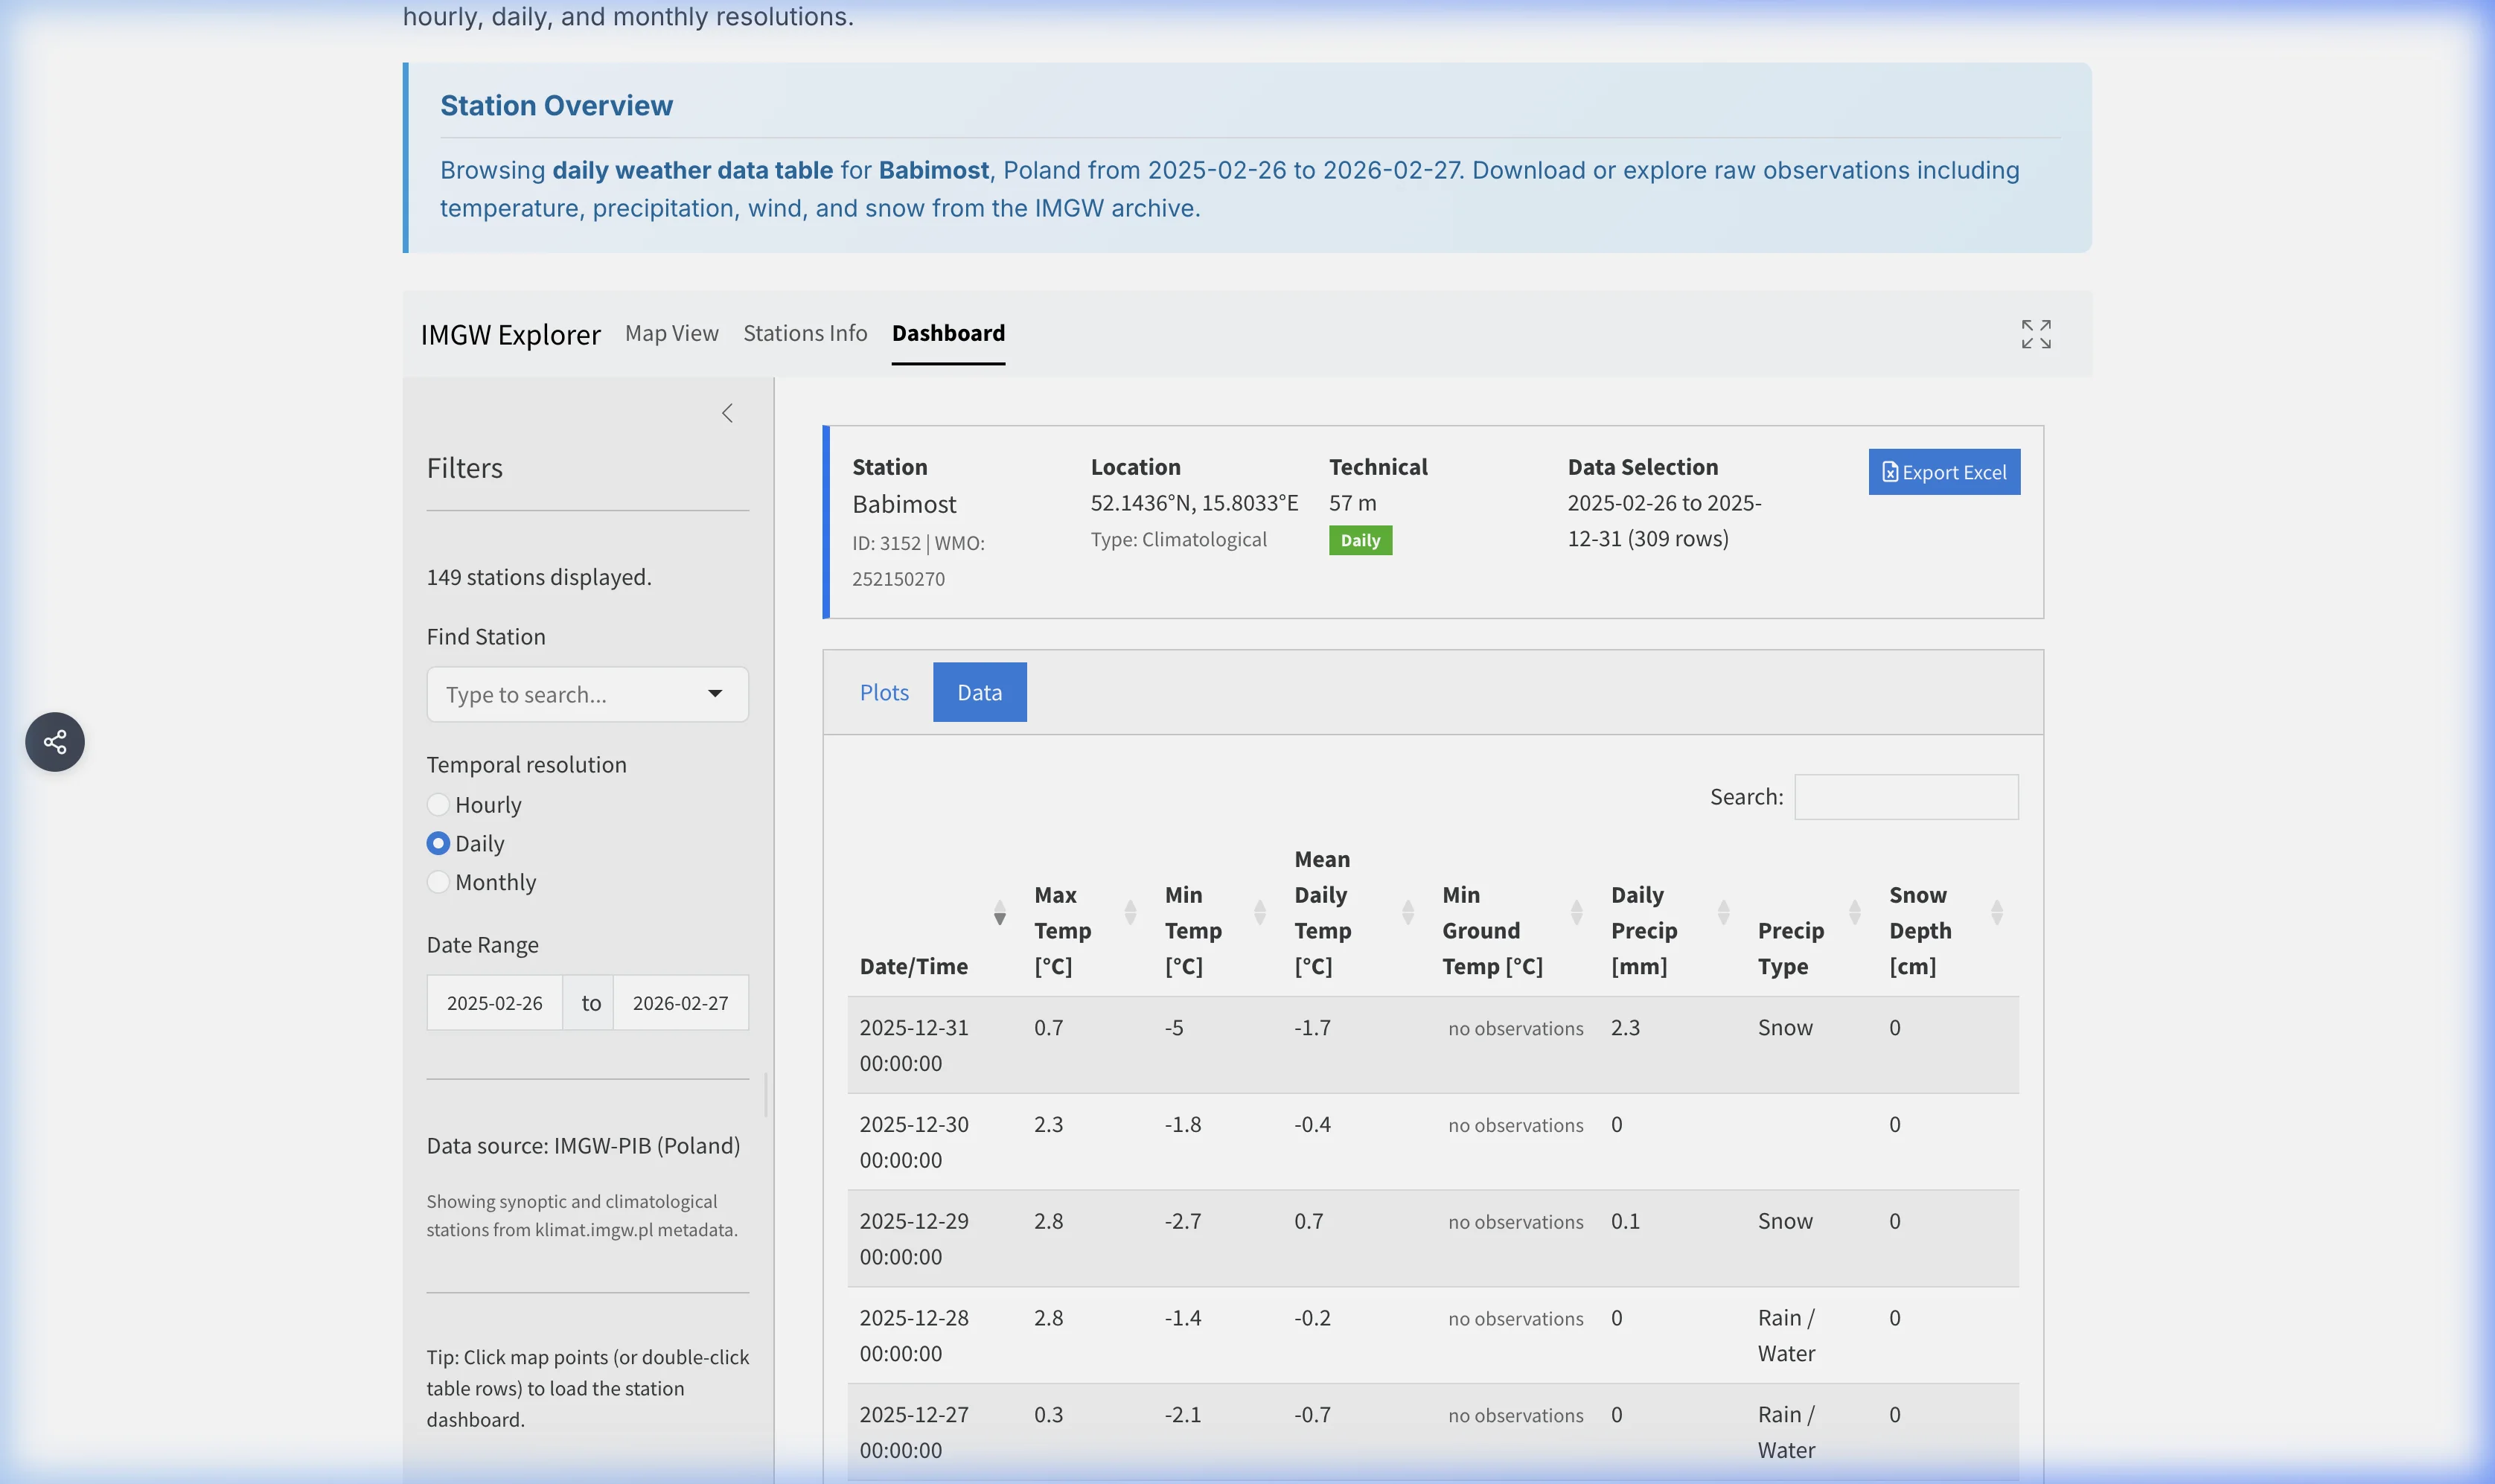
The table translates source abbreviations to labels such as Max Temp [°C], Mean Daily Temp [°C], Daily Precip [mm], Sunshine [h] and Snow Depth [cm]. It can be horizontally wide because IMGW synoptic products contain many weather, ground and duration fields.
Hourly fields
The hourly workbook can combine synoptic and climatological source families. These are the principal translated labels; a station may contain only a subset.
| Explorer label | IMGW source code(s) | Unit or representation | Interpretation |
|---|---|---|---|
Temp [°C], Wet Bulb Temp [°C], Dew Point [°C] |
temp, ttzw, tptr |
°C | Air, wet-bulb and dew-point temperatures at the reported hour |
Relative Humidity [%], Vapour Pressure [hPa], Humidity Deficit [hPa] |
wlgw, cpw, defi |
%, hPa | Different moisture measures; they are not interchangeable |
Wind Speed [m/s], Wind Direction [°], Wind Gust [m/s] |
fwr, krwr, porw |
m/s, degrees | Reported wind and gust fields; direction describes where the wind comes from |
Station Pressure [hPa], Sea Level Pressure [hPa] |
ppps, pppm |
hPa | Pressure at station elevation versus pressure reduced to sea level |
Pressure Tendency, Pressure Change [hPa] |
tech, app |
code, hPa | Tendency is coded; change is the reported pressure difference |
Precip 6h [mm], Precip Type 6h |
wo6g, ropt |
mm, code | Six-hour accumulation and its precipitation-type code, not an hourly amount |
Operator Visibility [m], Auto Visibility [m] |
wido, wida |
m | Manual/operator and automatic visibility can be separate fields |
| Cloud cover, base and type fields | nog, clcm, hpod, hpon, hpow, chcl, chcm, chch |
okta, m or code | Cloud amount, base and genus fields use different representations |
Sunshine [h] |
usln |
h | Sunshine duration reported for the observation period |
| Soil temperatures at 5, 10, 20, 50 and 100 cm | tg05 … tg100 |
°C | Depth-specific soil-temperature observations |
| Snow depth, fresh snow and water-equivalent fields | pksn, hss, rwsn, cipr |
cm or mm | Physical depth and water-equivalent quantities are different measures |
| Current and past weather | pogb, pogu |
code | Use the official format/code documentation for the reported phenomenon |
Daily fields
| Explorer label | IMGW source code(s) | Unit or representation | Interpretation |
|---|---|---|---|
Max Temp [°C], Min Temp [°C], Mean Daily Temp [°C] |
tmax, tmin, std |
°C | Provider-supplied daily temperature statistics |
Min Ground Temp [°C] |
tmng |
°C | Ground-level minimum, not sheltered air minimum |
Daily Precip [mm], Precip Type |
smdb, roop |
mm, code | Daily amount and the source precipitation-type classification |
Sunshine [h] |
usl |
h | Daily sunshine duration |
Snow Depth [cm], Snow Water Equiv [mm], Fresh Snow Depth [cm] |
pksn, rwsn, hss |
cm or mm | Snow depth, water equivalent and fresh snowfall are separate quantities |
| Rain, snow, mixed precipitation and hail durations | desz, sneg, disn, grad |
h | Duration of the named phenomenon during the provider day |
| Fog, mist, rime, glaze, blizzard and haze durations | mgla, zmgl, sadz, golo, zmni, zmws, zmet |
h | Duration fields; a blank value is not proof that the phenomenon lasted zero hours |
| Strong-wind, thunder, dew and frost durations | ff10, ff15, brza, rosa, szro |
h | Duration at the documented threshold or of the named phenomenon |
Snow Cover [0/1], Lightning [0/1] |
dzps, dzbl |
indicator | Presence indicators rather than measured amounts |
Lower Isotherm [cm], Upper Isotherm [cm], Actinometry [J/cm²] |
izd, izg, aktn |
cm, J/cm² | Specialized ground/freezing-depth and radiation fields |
Monthly fields
| Explorer label | IMGW source code(s) | Unit or representation | Interpretation |
|---|---|---|---|
Max Temp [°C], Min Temp [°C] |
tmax, tmin |
°C | Absolute monthly maximum and minimum |
Mean Max Temp [°C], Mean Min Temp [°C], Mean Monthly Temp [°C] |
tmxs, tmns, stm |
°C | Monthly mean of daily maxima, mean of daily minima and overall mean |
Min Ground Temp [°C] |
tmng |
°C | Lowest reported ground temperature for the month |
Monthly Precip [mm], Max Daily Precip [mm] |
summ, opmx |
mm | Monthly total and largest daily amount; dn1/dn2 identify its first/last date |
Day Precip [mm], Night Precip [mm] |
wodz, wono |
mm | Day/night components where supplied in the supplementary monthly table |
Monthly Sunshine [h] |
suus |
h | Monthly sunshine-duration total |
Snow Depth [cm], Snow Cover Days |
pksn, psdn |
cm, days | Depth and number of snow-cover days are distinct fields |
| Mean temperature, humidity, wind, cloud and pressure fields | temp, wlgs, fws, nos, ppps, pppm |
°C, %, m/s, okta, hPa | Supplementary monthly means when that source table is available |
| Precipitation, snow, hail, fog, rime, glaze, blizzard, haze, thunder, dew and frost days | desd, snid, dsnd, grdd, mgld, sadd, gold, zand, zawd, zmed, burd, rosd, szrd |
days | Counts of days meeting the source definition, not duration in hours |
| Wind-threshold days | w10d, w15d |
days | Counts at the documented 10 m/s and 15 m/s thresholds |
The workbook can contain additional structural, coded or source-family-specific columns. Each measurement may also have a translated Status: … companion derived from the corresponding IMGW status field. Preserve those columns when auditing missing or coded values.
Status fields are not generic quality grades
IMGW files pair many measurements with a status column. The official archive description defines:
- blank status: the associated measurement value;
8: no measurement; and9: no phenomenon.
Climate Explorer shows no observations for status 8. When status 9 accompanies an empty phenomenon field, the interface can display zero. Do not convert status 8 or a blank data cell to zero.
Some fields also use documented special codes. For synoptic snow depth, 997 means less than 0.5 cm, 998 means discontinuous or patchy cover, and 999 means the depth could not be measured. Wind direction 999 means variable wind. Consult the resolution-specific *_format.txt files before using coded columns quantitatively.
7. Export the complete workbook
Select Export Excel after the dashboard finishes loading. The .xlsx file contains the complete parsed table for the active station, resolution and loaded period—not only the visible page and not only the chart’s current zoom.
The workbook preserves translated measurement and status columns. Record at least:
- station name, IMGW ID and WMO metadata identifier;
- resolution;
- requested dates and actual loaded dates;
- download date; and
- the official source folder and format description.
8. Download official ZIP and CSV files
For bulk, automated or source-faithful work, use the official meteorological archive. Its main folders are:
terminowe— hourly/term observations;dobowe— daily observations; andmiesieczne— monthly observations.
Each is divided by synop, klimat, and where applicable opad, then by years or five-year periods. The downloadable ZIP archives contain comma-delimited CSV data. Format descriptions and header files in each product directory define column order, units and status fields.
Reproduce the Białystok example
- Record Białystok station ID
295and the Daily resolution. - Open
dobowe/synop. - Select the year folders overlapping 27 August 2025 through 31 July 2026.
- Download the applicable ZIP files and read the accompanying
s_d_format.txtdescription. - Filter the decompressed CSV rows to the station identifier and requested dates.
Use the source archive when you need the original abbreviations, every status column, file-level provenance or a workflow independent of Climate Explorer.
9. Time labels, corrections and reuse
- Hourly clock basis: The cited format documents define separate year, month, day and hour fields but do not state a universal time zone. Climate Explorer constructs a UTC-tagged machine timestamp for plotting and spreadsheets; that implementation detail must not be treated as proof that the source observation hour is UTC. Verify the intended clock basis before joining another dataset.
- Daily and monthly labels: Daily rows are placed at
00:00for display, and monthly rows use the first day of the month. These are indexing labels, not measurement times. - Corrections: IMGW-PIB states that archive data are verified but corrections can still be introduced, especially for the current year; replacement files are recorded in
lista_zmian.txt. - Attribution: The provider terms require the source statement “Źródłem pochodzenia danych jest Instytut Meteorologii i Gospodarki Wodnej – Państwowy Instytut Badawczy”.
- Processing notice: When data are transformed, the terms also require “Dane Instytutu Meteorologii i Gospodarki Wodnej – Państwowego Instytutu Badawczego zostały przetworzone”.
Review the current IMGW-PIB public-data terms for the intended reuse. Climate Explorer’s export does not grant rights beyond those terms.
10. Troubleshooting
- No station appears
-
Widen or move the date range, clear the station search, or try another resolution. Station eligibility is derived from metadata overlap.
- The dashboard remains empty
-
Select the station again and wait for the loading overlay to finish. The app may need to locate, download and combine several provider ZIP files.
- The requested end date has no rows
-
Use the dashboard’s actual Data Selection range. The newest published archive file can lag behind today’s date according to the provider schedule.
- A field says
no observations -
This represents missing measurement status, not a numeric zero. Exclude or explicitly handle it in calculations.
- The export is not CSV
-
The dashboard creates an Excel
.xlsxworkbook. Use the official ZIP archive for source CSV files. - A monthly date looks daily
-
Read the first day at
00:00as a month label created by the interface.