How to Find and Download European Station Weather Data
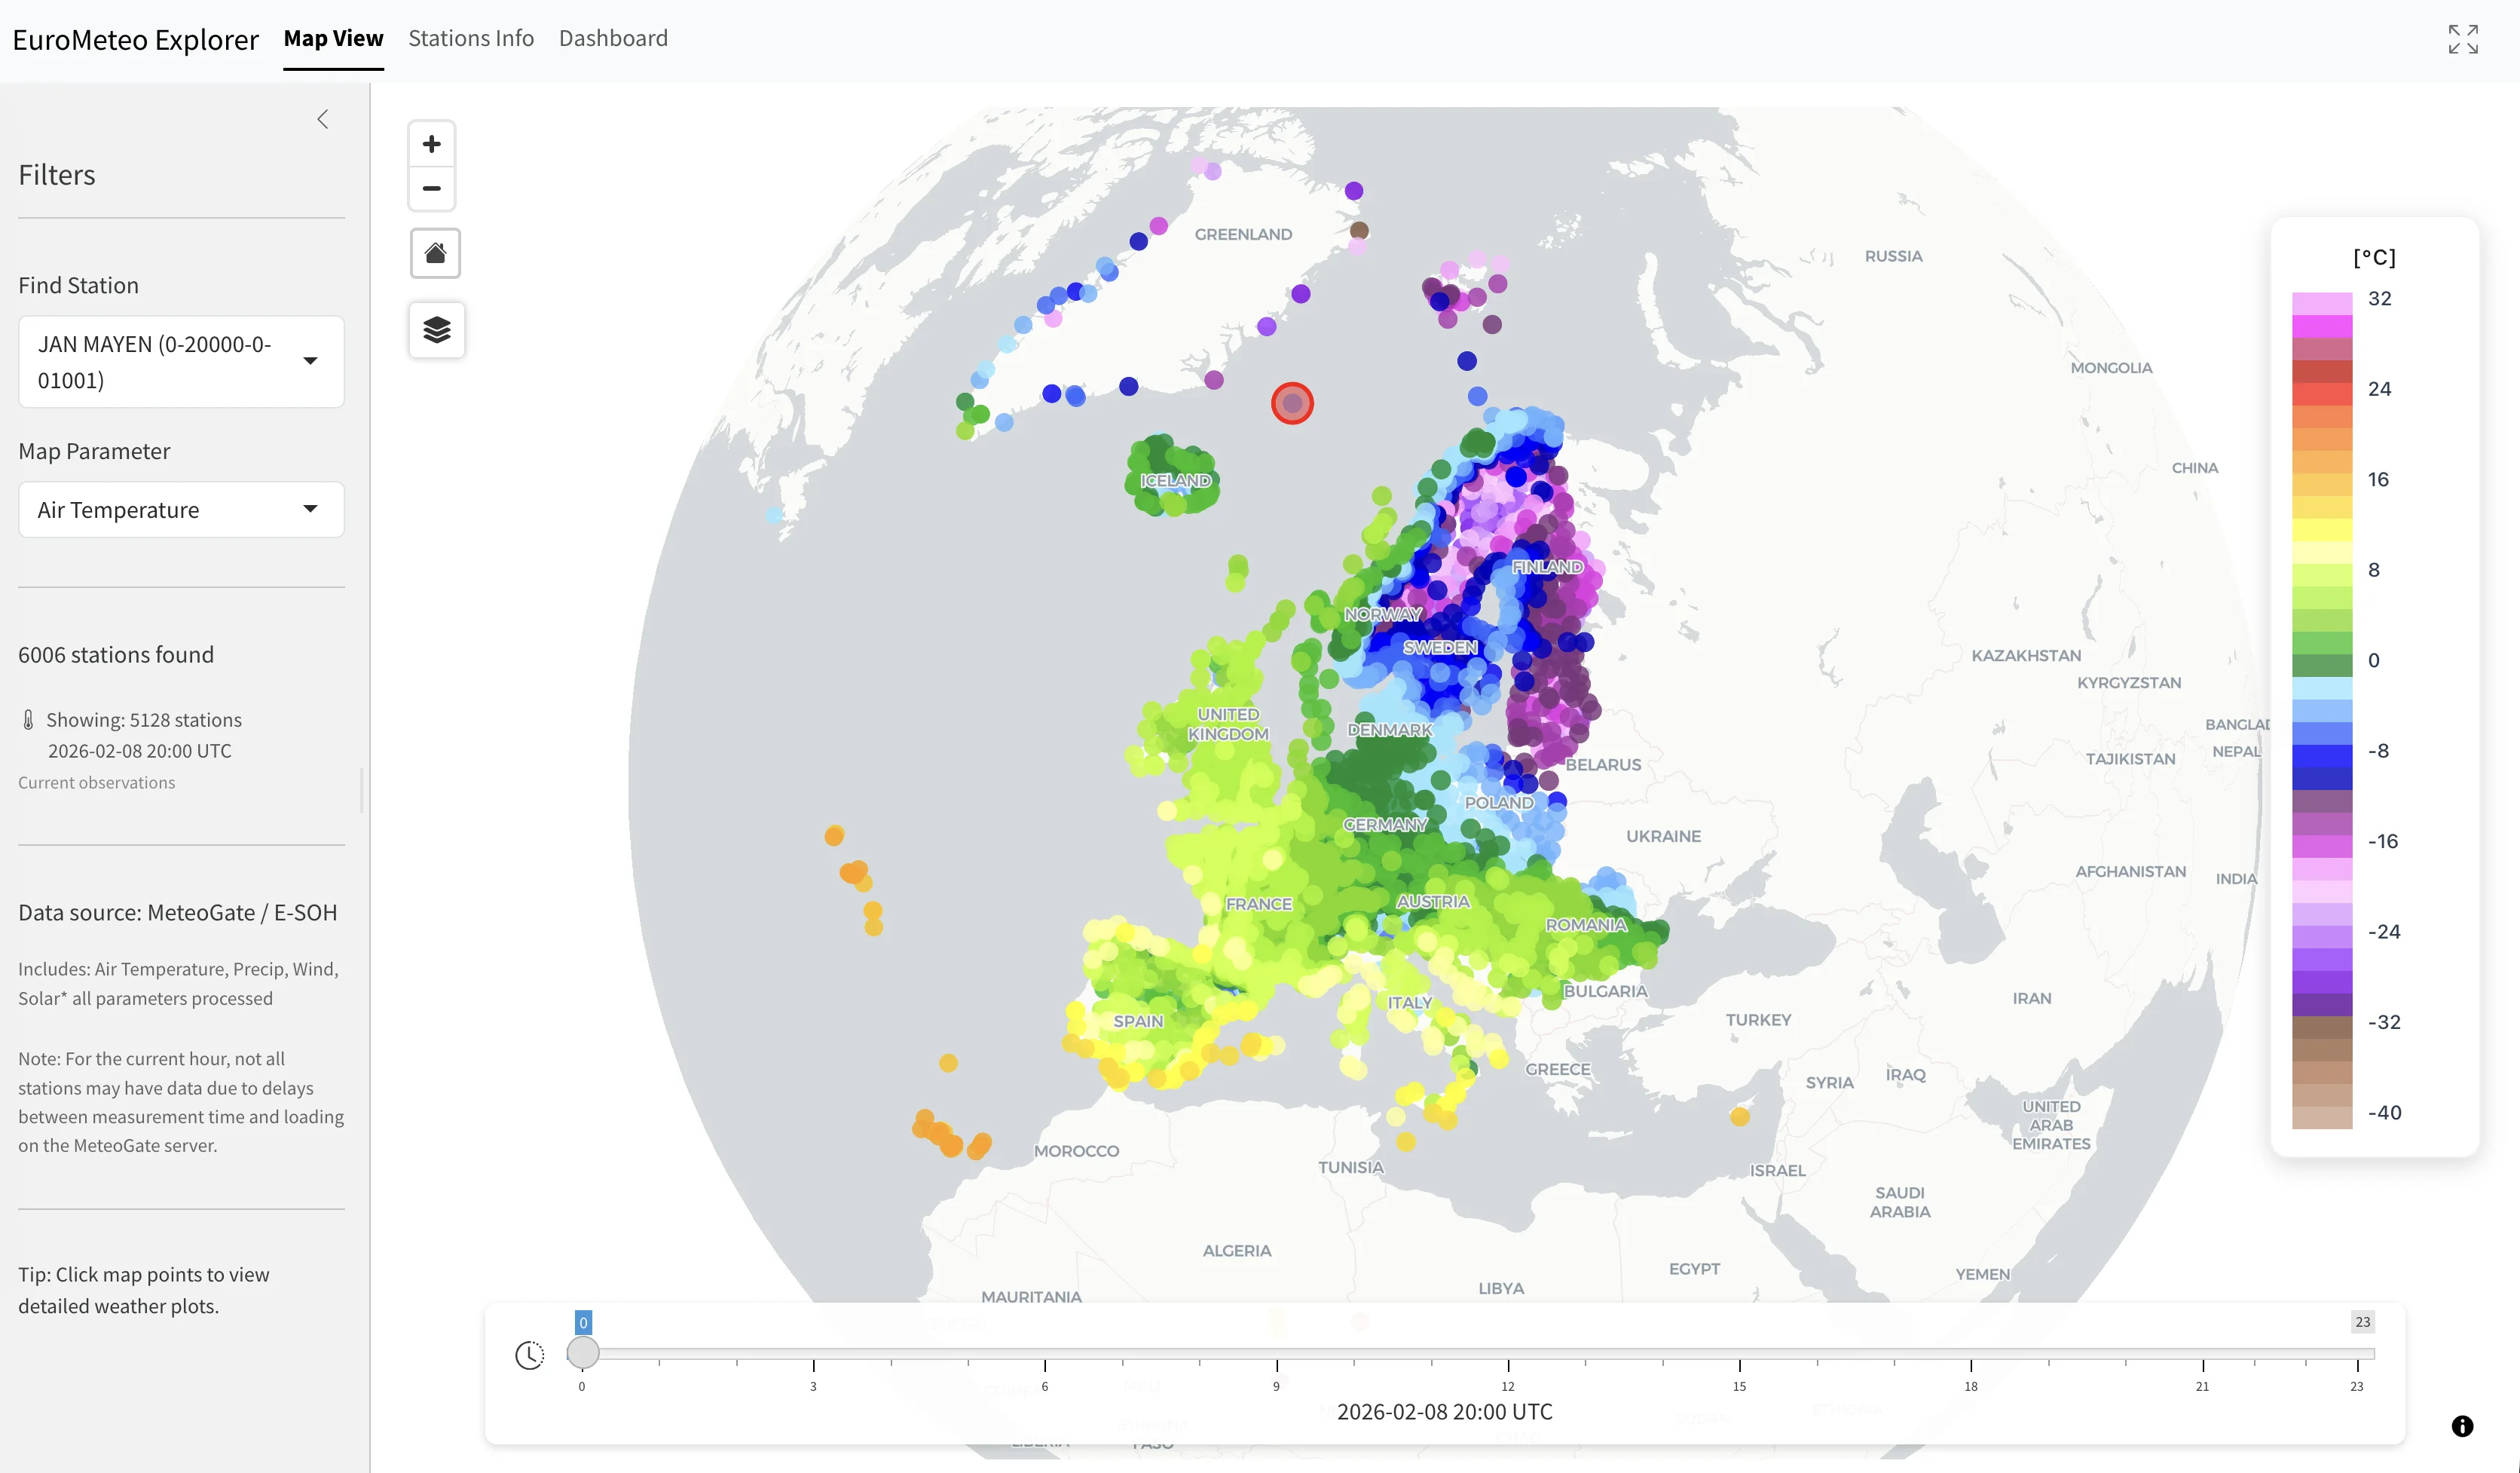
Use this guide when your goal is to retrieve observations for a named station. The EuroMeteo Explorer owns the interactive map; the companion article explains what MeteoGate and E-SOH change about cross-border access.
Quick start
- Open EuroMeteo and choose Zoom to Country.
- Under Find Station, search by station name or WIGOS identifier.
- Set the start and end dates under Select Period. Times are shown in UTC.
- Open Dashboard, confirm the station name, WIGOS ID, reporting frequency, and requested dates.
- Inspect Plots and Data, then select CSV or Excel.
The result is a station-level table for the selected period. It is not a regional average, a forecast, or an official record determination.
What EuroMeteo serves
EuroMeteo is an independent Climate Explorer application built from the EUMETNET MeteoGate European surface-observation service. Climate Explorer is not affiliated with EUMETNET or the participating national meteorological services.
| Item | What you receive |
|---|---|
| Observation source | E-SOH station observations exposed through MeteoGate |
| Time reference | UTC timestamps |
| Local archive | 5 March 2026 onward |
| Map variables | Air temperature, precipitation amount, mean-sea-level pressure, and wind speed |
| Station dashboard | Every supported variable reported for that station and period, which may include temperature, humidity, precipitation, pressure, wind, visibility, radiation, snow, soil, or marine observations |
| Export formats | CSV and Excel (.xlsx) |
Station and variable availability can change upstream. A station appearing in the catalogue does not guarantee that every variable exists at every timestamp.
Complete workflow: Madrid Retiro
This worked example uses MADRID, RETIRO, WIGOS ID 0-20000-0-08222. A WIGOS identifier is the stable station identifier used to distinguish sites that may have similar names.
1. Select the station
- In Zoom to Country, select Spain.
- Open Find Station.
- Search for
0-20000-0-08222rather than relying only on the city name. - Select MADRID, RETIRO and confirm the identifier in the Dashboard banner.
You can also open Stations Info and search the catalogue. Double-click a desktop row, or tap a station card on a smaller screen, to select it and open the dashboard.
2. Set a reproducible period
Enter a start and end date in Select Period. The standard range is limited to 31 days. When a station reports data at 10-minute or finer intervals, EuroMeteo may shorten the effective request to 15 days; the Dashboard banner shows the detected frequency and active limit.
Record all four pieces of context before comparing or citing a value:
- station name and WIGOS ID;
- start and end date;
- observation timestamp in UTC;
- variable and displayed unit.
3. Read the map correctly
Choose one Map Parameter, then use the hour control below the map. Marker colors represent station values available for the chosen UTC hour. They are not a continuous gridded field between stations.
The Showing count is the number of stations with a usable value for the selected parameter and hour within the active country filter. It can be lower than stations found because reports arrive at different times or a station does not publish that variable.
4. Inspect plots and table rows
Open Dashboard. The Plots view groups available variables into readable charts; the Data view exposes the processed rows used by those charts. Blank cells mean no usable value is available after retrieval and the Explorer’s checks.
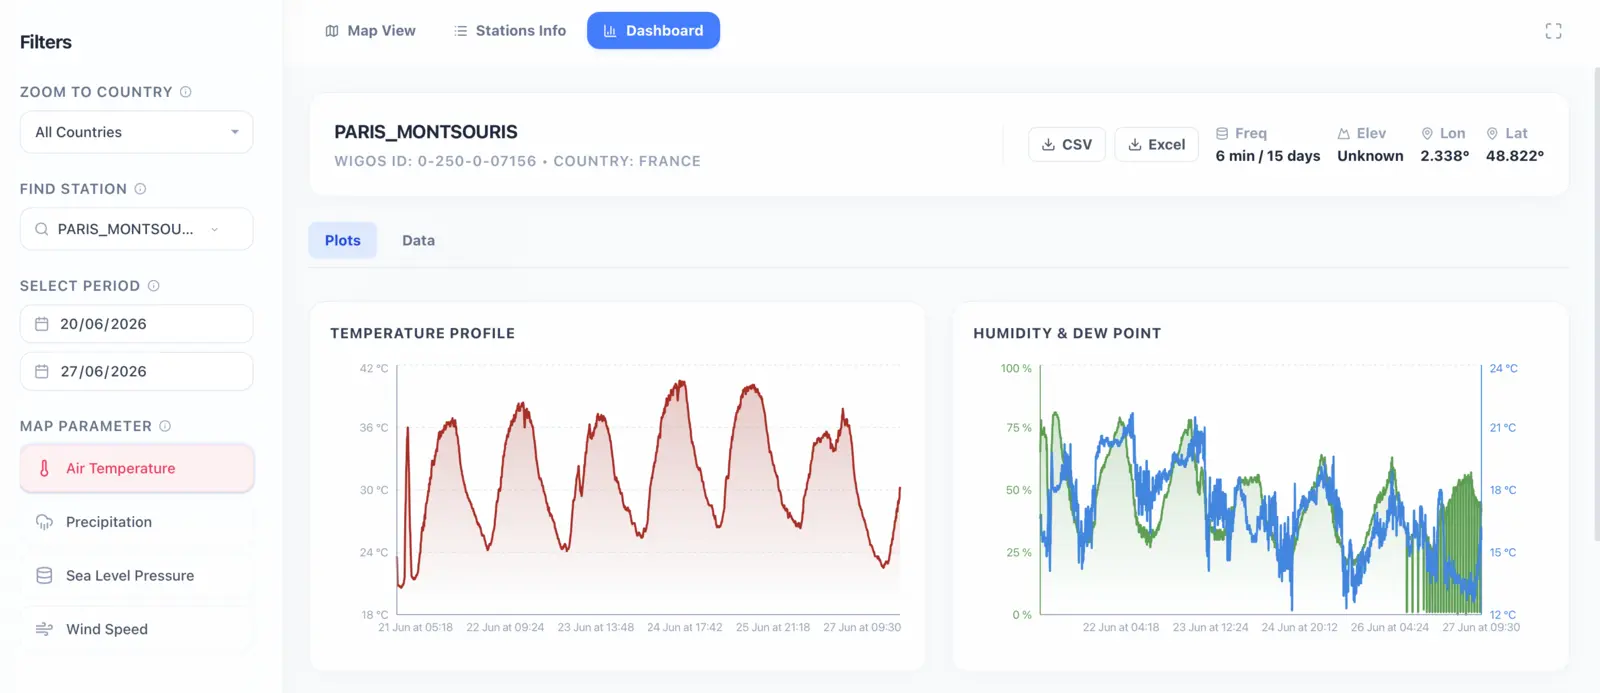
The screenshot shows a different station, but the same identity-and-period checks apply to Madrid Retiro or any other selection.
5. Export CSV or Excel
Select CSV for scripts and plain-text workflows, or Excel for a workbook with a Station Data sheet. The filename records the WIGOS ID and requested date range.
The first column is datetime. Remaining columns depend on what that station reported. Do not assume that two station exports have identical columns.
EuroMeteo standardizes parameter names, converts supported values into display units, selects one preferred reporting variant when duplicates exist, and applies site-level plausibility and spike checks. Some dew-point values can be calculated from temperature and relative humidity when no dew point is supplied. Values rejected by these checks become blank. Use the official MeteoGate API or the original national publisher when you need untouched source records, provider flags, or an auditable operational product.
Interpreting core export fields
The unit shown in an export header comes from the API when the source supplies one. The values below are the Explorer’s normal display units, not a guarantee that every provider publishes every field in exactly that form.
| Export field(s) | Meaning | Normal display unit | Check before reuse |
|---|---|---|---|
datetime |
Observation timestamp | UTC | Do not convert to local time without recording the zone |
temperature, tempMin, tempMax |
Air temperature and reported interval extrema | °C | Confirm sensor height and interval when material |
tempMinGround, tempMin50cm, surfaceTemperature |
Ground-level, depth-specific or surface temperature | °C | Do not treat these as sheltered air temperature |
dewPoint, humidity, virtualTemperature |
Moisture and thermodynamic fields | °C or % | Dew point can be derived from temperature and humidity when it is absent upstream |
precipitation, precipitation1h, precipitation3h, precipitation6h, precipitation12h, precipitation24h |
Source amount or duration-specific accumulation | mm | Keep the accumulation duration; the fields are not interchangeable |
lwePrecipitationRate, rainfallRate |
Liquid-water-equivalent or rainfall rate | mm/h | A rate is not an accumulation |
snowDepth, snowFresh |
Snow lying and fresh snow | cm | Confirm the source interval for fresh snow |
windSpeed, windSpeed2m, windGust, windGustInst |
Wind and gust fields | m/s | Retain measurement height and averaging/gust interval when known |
windDirection, windGustDirection |
Direction from which wind or gust came | degrees | Treat calm or missing direction carefully |
pressure, pressureStation, pressureTendency |
Mean-sea-level pressure, station pressure and pressure change | hPa or hPa/3h | Do not compare station and sea-level pressure as the same quantity |
cloudCover, cloudCoverLow, cloudBaseAltitude, visibility |
Cloud and visibility fields | %, m | Coverage and cloud-base height describe different properties |
solarRadiation, sunshine-duration fields |
Radiation flux and sunshine duration | W/m² or min | Preserve duration suffixes such as 10m, 1h, 3h, 6h, 12h and 24h |
ultravioletIndex, evapotranspiration |
UV index and potential evapotranspiration | index, mm | Confirm the provider interval and method |
soilTemp10cm, soilTemp20cm, soilTemp50cm |
Depth-specific soil temperature | °C | Compare only like depths |
Specialist and provider-specific fields
| Field group | Examples | Normal display unit | Interpretation |
|---|---|---|---|
| Radiation components | shortwave, longwave, direct, diffuse or infrared flux fields | W/m² | Flux components are separate quantities and should retain their API names |
| Marine observations | sea-surface temperature, significant wave height, wave period | °C, m, s | Available only from suitable marine platforms or providers |
| Radar-related surface fields | reflectivity |
dBZ | A conditional provider field, not a replacement for the OPERA radar explorer |
| Other provider parameters | normalized camelCase name derived from the API key | API-supplied unit | EuroMeteo can preserve an otherwise unmapped standard name; inspect the header and upstream metadata before reuse |
Two exports can legitimately have different columns because station equipment, reporting programs and national-provider mappings differ.
A safe cross-border comparison
To compare two stations, repeat the same workflow for each one and keep the parameter, UTC window, and accumulation duration identical. Note the WIGOS IDs and elevations. A warmer value at one station can reflect elevation, coastline, urban setting, exposure, or reporting time; it does not by itself describe an entire country.
For long-term trends or climatological anomalies, use a historical archive such as GHCNm monthly data or WMO climate normals. EuroMeteo’s short archive is intended for observation monitoring.
Troubleshooting
- The station is missing
-
Clear the country filter, then search by the full WIGOS ID.
- The Dashboard is empty
-
Confirm the station, period, and whether its catalogue entry lists the requested parameter.
- The requested start date changes
-
The application may have detected high-frequency data and applied the 15-day limit.
- The newest hour has few markers
-
Reporting latency varies; move to an earlier UTC hour before concluding that coverage is absent.
- Precipitation columns disagree
-
Check the accumulation suffix (
1h,3h,6h,12h, or24h). They are different measurements, not interchangeable duplicates. - CSV columns shift in a spreadsheet
-
Use the Excel export or import the CSV explicitly as UTF-8 with comma separators.
- A value is blank
-
The source may not have reported it, or the Explorer may have rejected it during site-level checks.
Official sources and next steps
- MeteoGate landing page — catalogue of European meteorological APIs.
- EUMETNET surface-observation API — official E-SOH service landing document.
- E-SOH retrieval documentation — upstream API workflow.
- MeteoGate architecture — ownership, gateways, discovery, and data-supply responsibilities.
After exporting, retain the download date and the selected WIGOS ID with your analysis. For an evidence-led example of what these observations can show, read the June 2026 cross-border heatwave analysis.