HungaroMet Hungarian Meteorological Data Guide: Stations & Export
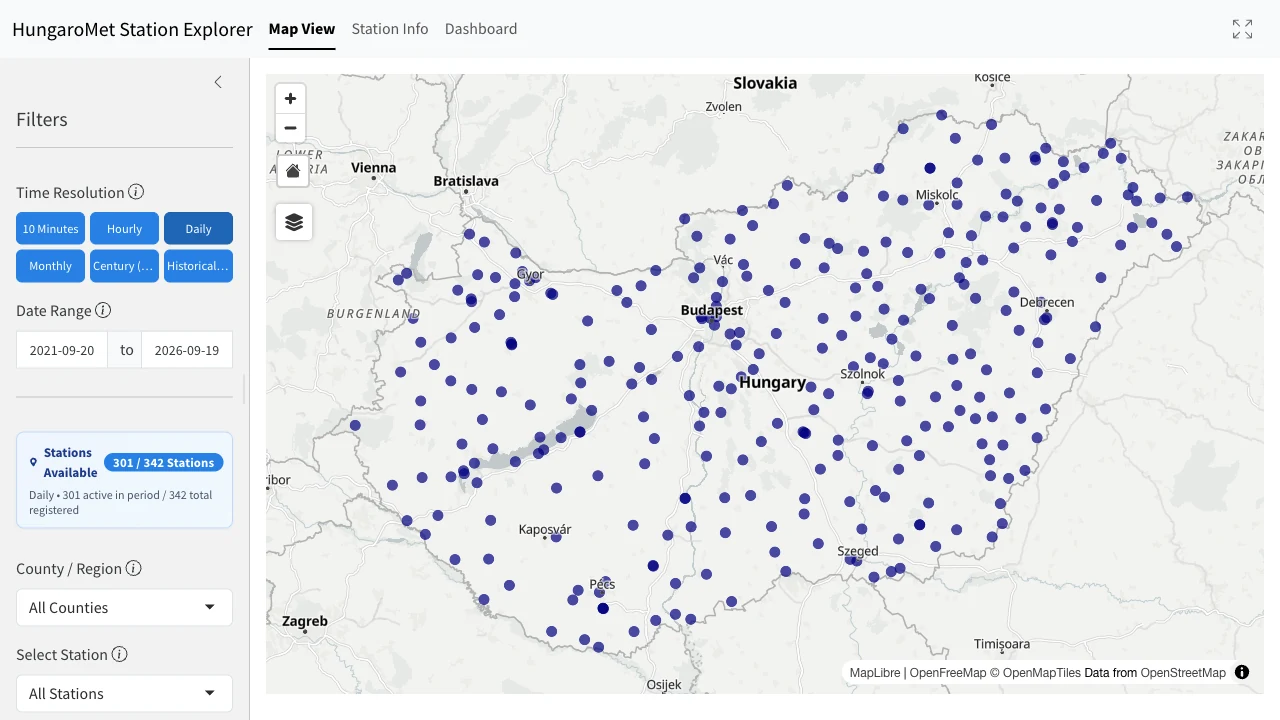
Quick start
- Open the explorer and choose your temporal resolution: 10 Minutes, Hourly, Daily, Monthly, Century (1901+), or Historical (1870+).
- Set a date range or accept the adaptive default window for your chosen resolution.
- Filter by Hungarian county (Vármegye / Budapest) or select a station directly on the map or in Station Info.
- Inspect the Dashboard plots, glassmorphic summary KPI cards, and climate trend indicators.
- Switch to the Data subtab and click Download CSV to export the filtered observations.
What this guide helps you do
The HungaroMet Explorer provides independent, interactive access to meteorological station observations published by HungaroMet Nonprofit Zrt. (formerly the Hungarian Meteorological Service, OMSZ) through its open data repository.
Climate Explorer ingests station metadata, coordinates, and multi-segment historical observation archives. It standardizes timestamps into UTC/Date formats, sanitizes sentinel placeholders (-999 / -999.0 to true null values), computes derived parameters such as dew point via the Magnus-Tetens formula, and produces clean CSV exports.
This guide explains how to navigate Hungarian observing networks, understand resolution span limits, interpret quality flags and sentinels, and export analysis-ready station series.
1. Choose the resolution and date window
The resolution determines the underlying HungaroMet dataset, the available parameters, and the maximum query span allowed by the interface.
| Explorer mode | Source directory / files | Maximum accepted window | Best use |
|---|---|---|---|
| 10 Minutes | observations_hungary/10_minutes/ |
31 days | Convective rain rates, peak wind gusts, frontal passages |
| Hourly | observations_hungary/hourly/ |
366 days (1 year) | Diurnal temperature cycles, sea-level pressure trends |
| Daily | observations_hungary/daily/ |
Multi-decade (2002–present) | Seasonal extremes, daily temperature envelopes, precipitation sums |
| Monthly | observations_hungary/monthly/ |
Multi-decade (2002–present) | Long-term monthly climate summaries and multi-year anomalies |
| Century (1901+) | climate/station_data_series/1901-2025/ |
125 years (1901–2025) | Long-term homogenized climate warming trends and ETCCDI indices |
| Historical (1870+) | climate/station_data_series/1870-2025/ |
156 years (1870–2025) | Secular temperature and precipitation baselines across Hungary |
Selecting 10 Minutes initially bounds the calendar to the most recent 7 days (maximum span 31 days). Selecting Hourly defaults to a 30-day window (maximum span 366 days). Daily, Monthly, and Century series support multi-year and multi-decade spans. If a requested date range exceeds the valid window, the interface clamps the span and issues a visual notification.
The Automatic Network comprises ~342 automated stations operating primarily from 2002 to the present with high-frequency telemetry. The Century and Historical datasets comprise curated reference stations (such as Budapest, Szeged, Debrecen, Pécs, and Szombathely) whose records have been digitized, quality controlled, and homogenized across historical instrument transitions.
2. Station classifications & county filtering
Hungary’s territory is organized into 19 counties (vármegyék) plus the capital city of Budapest. The HungaroMet explorer standardizes regional names:
- Bács-Kiskun, Baranya, Békés, Borsod-Abaúj-Zemplén, Budapest, Csongrád-Csanád, Fejér, Győr-Moson-Sopron, Hajdú-Bihar, Heves, Jász-Nagykun-Szolnok, Komárom-Esztergom, Nógrád, Pest, Somogy, Szabolcs-Szatmár-Bereg, Tolna, Vas, Veszprém, and Zala.
Finding a station
- County Dropdown: Filter the map and station selector to a specific county or choose “All”.
- Interactive Map: Stations are rendered as elevation-coded circle markers using MapLibre GL. Marker colors interpolate between lowland plains (e.g. Szeged, ~80 m) and mountain summits (e.g. Kékestető, 1014 m).
- Hover & Click: Hovering displays the station name, ID, county, elevation, coordinates, and active period. Clicking a marker selects the station and transitions to the Dashboard.
3. Meteorological parameters & units
Depending on the chosen resolution, observations include the following standardized meteorological fields:
| Parameter Key | Parameter Name | Units | Available Resolutions | Notes |
|---|---|---|---|---|
temp / MeanTemp |
Mean Air Temperature | °C | All resolutions | Measured at 2 m height |
temp_max / MaxTemp |
Maximum Air Temperature | °C | 10m, Hourly, Daily, Monthly, Century | Daily maximum or sub-daily interval peak |
temp_min / MinTemp |
Minimum Air Temperature | °C | 10m, Hourly, Daily, Monthly, Century | Daily minimum or sub-daily interval trough |
precip / Precipitation |
Precipitation Sum | mm | All resolutions | Tipping bucket or weighing gauge sum |
wind_speed / WindSpeed |
Mean Wind Speed | m/s | 10m, Hourly, Daily, Monthly | Anemometer average at 10 m height |
wind_gust_max / WindGust |
Maximum Wind Gust | m/s | 10m, Hourly, Daily | Peak 3-second gust |
rh / RelativeHumidity |
Relative Humidity | % | 10m, Hourly, Daily, Monthly | Capacitive sensor reading (0–100%) |
pressure / Pressure |
Sea-Level Pressure | hPa | 10m, Hourly, Daily, Monthly | Barometric pressure reduced to MSL |
solar_global / Radiation |
Global Solar Radiation | J/cm² or W/m² | 10m, Hourly, Daily, Monthly | Pyranometer global horizontal irradiance |
soil_temp_5cm / SoilTemp |
Soil Temperature (5 cm) | °C | 10m, Hourly, Daily | Multi-depth soil thermistor |
dew_point |
Dew Point Temperature | °C | 10m, Hourly, Daily | Derived via Magnus-Tetens approximation |
4. Quality flags & sentinel handling
HungaroMet raw text and CSV files denote missing measurements, sensor dropouts, or unverified readings using numeric sentinel flags: - -999 and -999.0: Represent missing observations.
The Climate Explorer ingestion pipeline automatically converts these values to NA_real_ (null). When computing descriptive statistics (mean, minimum, maximum, cumulative precipitation), null values are excluded with na.rm = TRUE.
Completeness criteria for climate indices
When calculating annual ETCCDI climate indices (e.g. Frost Days \(T_{min} < 0^\circ\text{C}\), Summer Days \(T_{max} \ge 25^\circ\text{C}\), Hot Days \(T_{max} \ge 30^\circ\text{C}\), Tropical Nights \(T_{min} \ge 20^\circ\text{C}\)): - A year must contain at least 320 valid daily observations to be included in trend evaluations. - Ongoing incomplete years are explicitly excluded from annual warming rate calculations to prevent seasonal distortion.
5. Exporting data for analysis
To export observations for external analysis in Python, R, Excel, or GIS tools:
- Select your desired station, resolution, and date range in the explorer.
- In the main panel, navigate to the Dashboard tab and click the Data subtab.
- Verify that the table columns and row counts match your expected selection.
- Click the Download CSV button above the data table.
- The downloaded file contains standardized column headers (
Date,MeanTemp,MaxTemp,MinTemp,Precipitation,WindSpeed,WindGust,RelativeHumidity,Pressure,Radiation,StationID,StationName,County).
6. Troubleshooting
- No station appears on the map
-
Adjust the county filter, widen the selected date window, or choose a coarser temporal resolution. A station appears only when its historical operating period overlaps the requested calendar window and provides data for the active resolution mode.
- A parameter column or chart is blank
-
Sensor suites vary by station type across Hungary. While synoptic observatories and major agrometeorological stations measure solar radiation, atmospheric pressure, and multi-depth soil temperatures, auxiliary rainfall posts record only air temperature and precipitation totals.
- Values show sentinels such as -999 or -999.0
-
In raw HungaroMet archives,
-999and-999.0represent missing measurements or telemetry outages rather than numeric zeroes. Climate Explorer automatically sanitizes these placeholders to null (NA) values before plotting series or computing summary statistics. - Century series values differ from unadjusted daily records
-
The 10 Century climate reference stations (1901–2025) are homogenized by HungaroMet climatologists using the MASH (Multiple Analysis of Series for Homogenization) procedure. Homogenization removes non-climatic breakpoints caused by historical station relocations, instrument replacements, and observing practice shifts.
- Exporting data and restoring deep-linked station views
-
To export observation tables, navigate to the Dashboard tab, switch to the Data subtab, and click Download CSV. To share or restore a specific station and date selection, use the canonical permalink structure
/explorers/hungaromet/{resolution}/{county}/{station}/to automatically restore the full view state.