OPERA European Weather Radar Guide: DBZH Animation & GeoTIFF Export
Open the Weather Radar Europe explorer
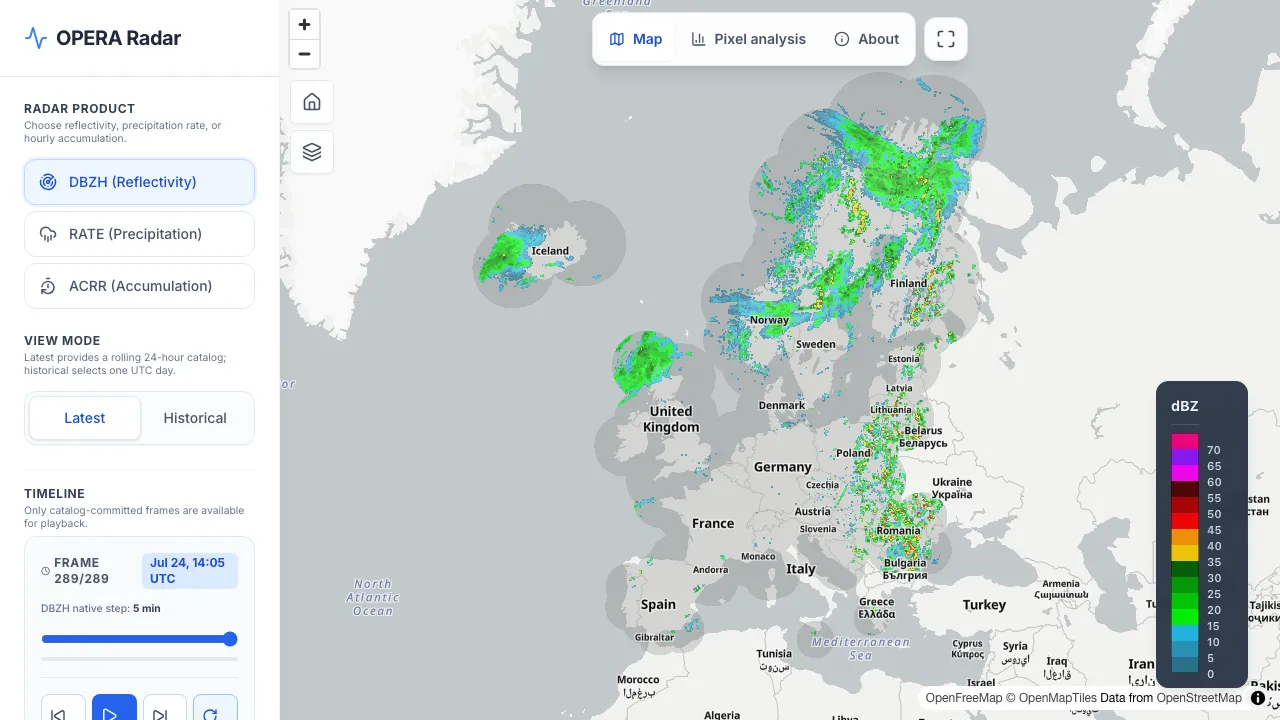
Quick start
- Open the Weather Radar Europe explorer.
- Select a radar composite product (CIRRUS Maximum Reflectivity, NIMBUS Rain Rate, or NIMBUS 1-Hour Accumulation).
- Use the playback controls to step through recent timestamps and analyze precipitation movement across Europe.
- In the Current frame panel, select Download GeoTIFF to save that complete radar frame for GIS or scientific analysis.
- Toggle full-screen mode to view high-density radar details.
This guide explains how to explore and download weather radar data across Europe for monitoring precipitation systems as they develop and move across national borders. The Weather Radar Europe explorer is an independent visualization platform. We are not affiliated with EUMETNET; rather, we reuse the pan-European composites produced by the EUMETNET OPERA program (including the CIRRUS and NIMBUS operational projects), which combine observations from dozens of national meteorological services into a seamless, high-resolution view.
- Full Screen View: Click the Maximize / Full Screen button in the top-right corner of the explorer window to expand the dashboard to full display size. This is recommended when inspecting complex multi-panel charts, high-density station maps, or large data tables. Press
Escor click the icon again to exit.
Download OPERA radar data as GeoTIFF
The OPERA Radar Explorer can export each cataloged DBZH, RATE, or ACRR frame as a georeferenced GeoTIFF. This gives you the underlying pan-European raster for analysis in QGIS, ArcGIS, GDAL, Python, R, or another application that reads GeoTIFF files.
To download a frame:
- Open the OPERA Radar Explorer and select a radar product.
- Choose Latest or Historical, then move the timeline to the required UTC timestamp.
- Find the Current frame panel in the explorer sidebar.
- Select Download GeoTIFF. For an archive frame, keep the explorer open while it displays Generating….
The filename records the selected product, UTC timestamp, and source revision, using a pattern such as OPERA_DBZH_20260729T1000Z_rev1234.tif. The file covers the full OPERA composite raster, not a crop of the current map view. Its coordinate reference system and affine geotransform are embedded in the GeoTIFF so geospatial software can place it correctly.
| Selected product | Measurement in the raster | Unit |
|---|---|---|
DBZH |
Maximum reflectivity | dBZ |
RATE |
Instantaneous surface rain rate | mm/h |
ACRR |
Preceding 1-hour rainfall accumulation | mm |
- Recent frames (COG backend): the explorer downloads the published Cloud Optimized GeoTIFF directly. The source COG contains the physical measurement in band 1 and its quality indicator in band 2.
- Archive frames (GeoZarr backend): the server generates a single-band, floating-point GeoTIFF containing the selected measurement. Generation can take longer because the complete raster is reconstructed on request. If the server reports that it is busy, wait briefly and try again.
Map opacity, display thresholds, and other visual controls do not alter the exported values.
Understanding the Composite Products
The OPERA network provides three distinct observational layers, each serving a specific meteorological purpose.
Maximum Reflectivity (DBZH)
The Maximum Reflectivity product, developed under the OPERA CIRRUS project and generated by Météo-France, offers a high-frequency (5-minute), high-resolution (1 km) view of severe weather potential.
Rather than showing the precipitation strictly at the ground level, this composite displays the highest radar reflectivity value detected anywhere within the vertical column above each 1 km grid square. This makes it an essential tool for nowcasting. Deep convective clouds, which produce heavy downpours and hail, exhibit intense reflectivity aloft. By mapping the maximum vertical value, the DBZH product clearly highlights the core structures of thunderstorms and frontal systems. Values are measured in decibels (dBZ).
Instantaneous Surface Rain Rate (RATE)
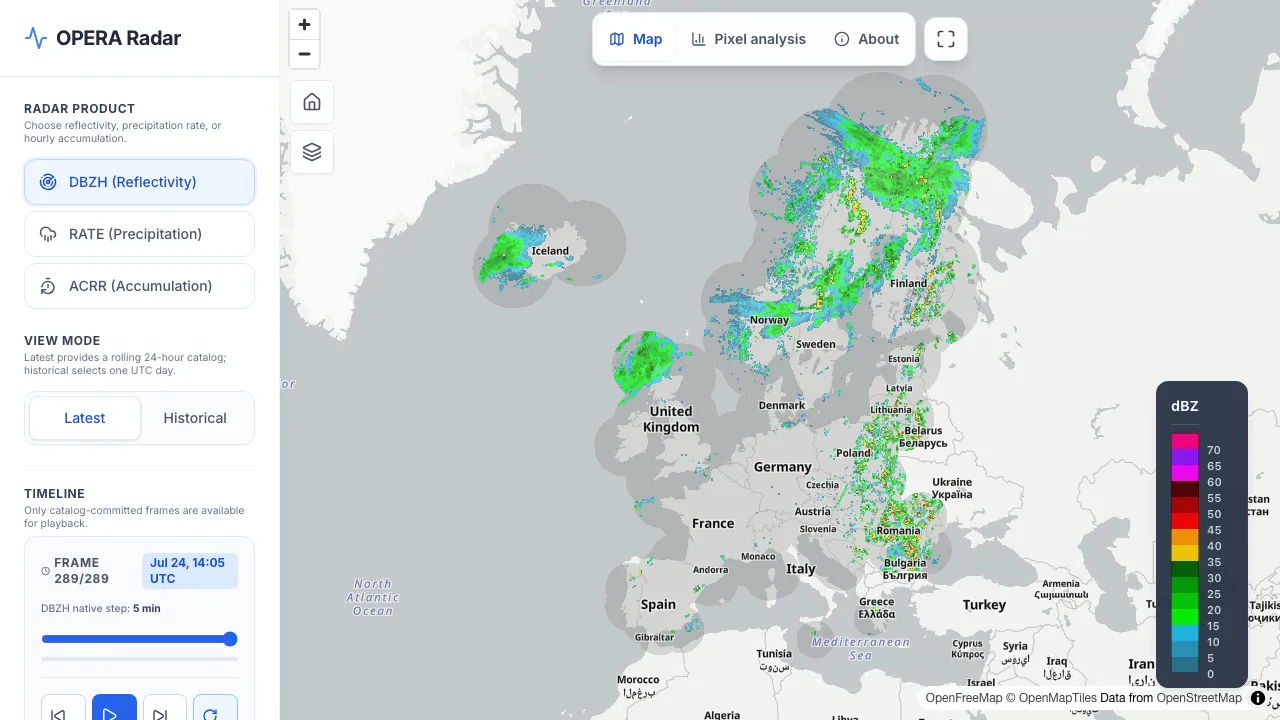
When you need to know how intensely it is raining right now, the Instantaneous Surface Rain Rate product is the primary metric. Generated under the OPERA NIMBUS project by GeoSphere Austria, this 2 km resolution composite updates every 15 minutes.
Unlike the vertical maximums shown in the DBZH layer, the rain rate is calculated using only the lowest available elevation scan from the contributing radars, aiming to measure the precipitation closest to the ground. The raw radar reflectivity factor (Z) is mathematically converted into a rainfall intensity (R, in mm/h) using the standard Marshall-Palmer equation (Z = 200 × R1.6).
1-Hour Rainfall Accumulation (ACRR)
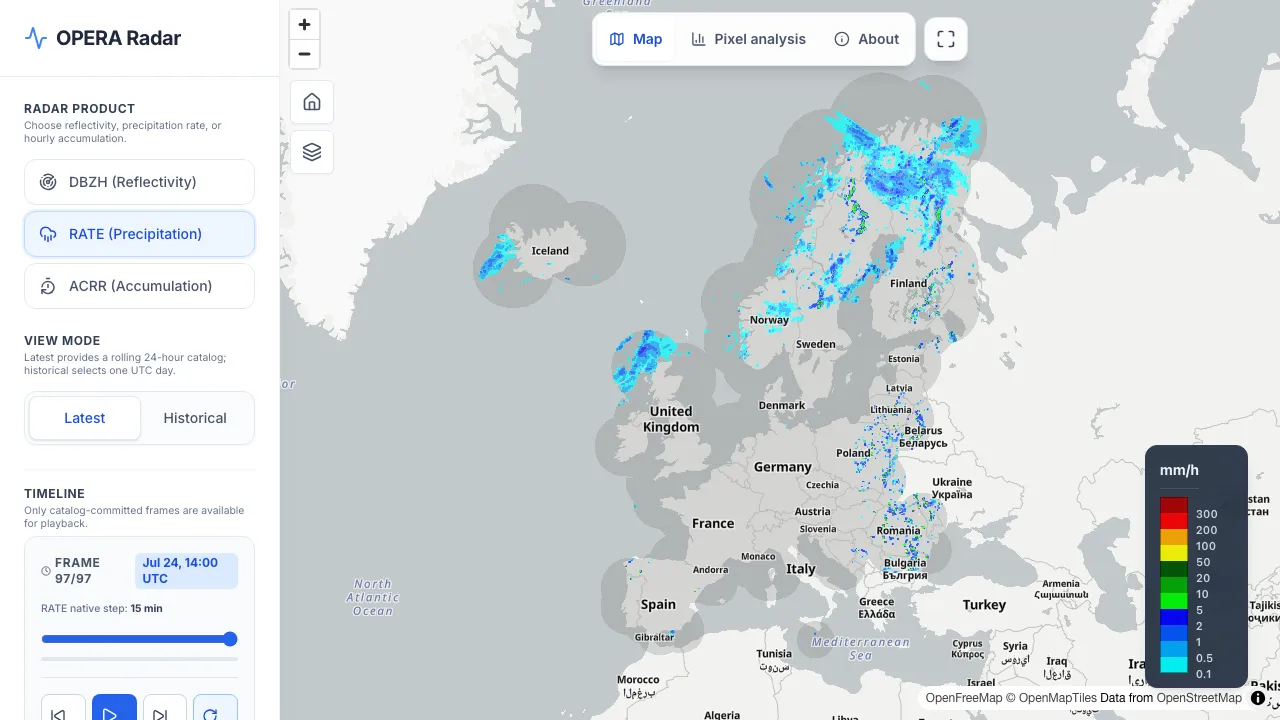
For assessing flood risks and hydrological impacts, instantaneous rates must be translated into total volumes. The 1-Hour Rainfall Accumulation composite, also updated every 15 minutes at a 2 km resolution, calculates the total precipitation (in mm) that has fallen over the preceding 60 minutes.
It is derived by summing the previous four 15-minute rain rate composites. This product is critical for identifying areas that have experienced persistent, heavy rainfall, making it a key indicator for potential flash flooding or overwhelmed drainage systems.
Interactive Pixel Analysis
In addition to viewing the pan-European radar composites, the Explorer offers a Pixel Analysis feature for inspecting time-series data at specific locations. By double-clicking any point on the map canvas, you can open a detailed analysis panel for that exact coordinate.
This tool extracts the radar data (such as DBZH reflectivity or precipitation rate) for the selected location over the 24-hour period ending at your currently selected radar frame. Because it queries 24 hours of high-frequency data across the continent, the initial generation of the plot may take up to a minute. However, because the underlying radar data is stored in spatial chunks, querying a location naturally loads that entire surrounding region into the server’s memory. This means generating subsequent plots for neighboring pixels will be nearly instantaneous.
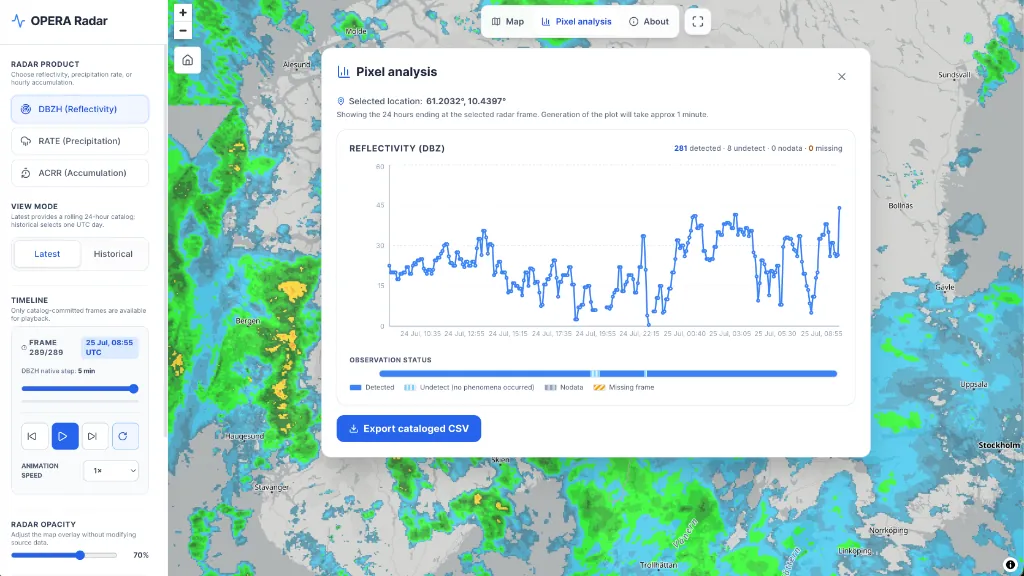
The Pixel Analysis panel provides: - Time-Series Graph: A 24-hour plot of the selected radar product (e.g., Reflectivity in DBZ), allowing you to see the exact intensity and duration of precipitation events passing over that location. - Observation Status Timeline: A breakdown of data availability for the location over the 24-hour period, categorized into: - Detected: Valid meteorological phenomena recorded. - Undetect: Radar scanned the area but no precipitation was detected. - Nodata: No valid reading available for that pixel. - Missing frame: The entire radar frame for that time step is unavailable. - CSV Export: An Export cataloged CSV button that allows you to download the raw 24-hour time-series data for the selected location to perform your own offline analysis.
Radar Products Reference
The Explorer visualizes three primary composite products, standardizing data from multiple national networks.
| Product Code | Description | Unit | Resolution | Update Frequency |
|---|---|---|---|---|
DBZH |
Maximum Reflectivity | dBZ | 1 km | 5 minutes |
RATE |
Instantaneous Surface Rain Rate | mm/h | 2 km | 15 minutes |
ACRR |
1-Hour Rainfall Accumulation | mm | 2 km | 15 minutes |
Practical Considerations and Limitations
When interpreting the OPERA radar composites, keep several technical and physical constraints in mind:
Time Standardization
All displayed times across the Explorer and Pixel Analysis tools are in Coordinated Universal Time (UTC). When comparing radar frames with local events, remember to account for your local timezone offset.
Quality Control and Low-Level Noise
The raw data supplied by national networks undergoes central preprocessing using the BALTRAD toolbox. This involves applying filters to remove non-meteorological echoes (such as anomalous propagation, ground clutter, and satellite interference). However, these filters are not applied universally to all incoming data. As a result, users may occasionally see low-reflectivity artifacts that resemble light rain but are actually noise. For visual clarity, applying a minimal display threshold (e.g., ignoring values below 0.1 dBZ or 0.01 mm/h) is generally recommended.
Network Latency and Gaps
A pan-European composite is only as complete as its constituent parts. The final product relies on the timely delivery of data from individual national weather services. Occasionally, network disruptions, radar maintenance, or transmission delays can result in missing data for specific countries or regions. If a country’s radar data is delayed beyond the processing window, that area will appear blank in the composite, which should not be confused with clear weather.
The Spanish Extrapolation
Because the Spanish national radar network provides data at a 10-minute frequency (rather than the 5-minute standard expected by the CIRRUS DBZH product), the processing system employs a specialized forward-extrapolation technique (Lucas-Kanade) for Spanish data. This mathematical estimation ensures a fluid 5-minute composite over the Iberian Peninsula, but it represents an algorithmic prediction rather than a direct measurement for those intermediate time steps.
Data Storage and Visualization Latency
The Explorer utilizes two different backend storage formats depending on the age of the data, which affects map visualization performance: - Last 24 hours: Data is visualized directly from Cloud Optimized GeoTIFF (COG) files. This format provides lower latency and faster map rendering for recent and near real-time observations. - Archive period (older than 24 hours): Data is visualized from a historical Zarr format archive. This continuous historical record begins on 21 July 2026. While this allows for efficient storage of massive historical datasets, retrieving and rendering data from the Zarr archive may take slightly longer compared to the recent COG files.
Additionally, regardless of the time period, map tiles are cached by your browser once they are loaded. This means that when you use the timeline animation, the first playback might take a moment to fetch each frame. However, once the frames have been viewed, looping the animation or scrubbing back and forth across that same period will be perfectly fluid and nearly instantaneous.
Safety and Interpretation
Radar-derived precipitation is an estimate, not a precise ground-truth measurement. Factors such as beam blockage, attenuation, distance from the radar site, and algorithmic composite processing can introduce artifacts or uncertainty. Always use official meteorological warnings and local observations for safety-critical decisions.
Troubleshooting
- Downloading OPERA radar rasters for GIS analysis (QGIS, ArcGIS)
-
Select a product and timestamp in the OPERA Radar Explorer, then click Download GeoTIFF in the Current frame panel. The download delivers a georeferenced, full-extent composite raster in EPSG:3857 (Web Mercator). Recent source COGs (last 24 hours) download directly, while older archive frames are converted from the GeoZarr archive on request.
- Distinguishing Instantaneous Rain Rate from 1-Hour Accumulation
-
The Instantaneous Rain Rate (RATE) measures rainfall intensity at an exact 15-minute sampling instant in millimeters per hour (mm/h). The 1-Hour Rainfall Accumulation (ACRR) measures the integrated physical water depth (mm) accumulated over the preceding four 15-minute intervals. Use RATE to detect active convective downpours; use ACRR to evaluate flash flood potential and cumulative precipitation loading.
- Gaps, missing country sectors, or delayed composites
-
The pan-European composite integrates inputs from dozens of national meteorological radar networks. When a national radar undergoes maintenance or network latency delays telemetry ingest past the composite window, that sector appears blank. A blank sector indicates missing transmission data, not cloud-free weather.
- Low-reflectivity artifacts or false echoes on clear days
-
Central BALTRAD quality filtering suppresses most non-meteorological targets (ground clutter, sea surface reflections, anomalous propagation, bird or insect blooms). Residual low-reflectivity echoes can occasionally persist. Applying a display threshold (e.g. 0.1 dBZ or 0.01 mm/h) removes visual background noise.
Data Sources
The OPERA radar composites are coordinated by the EUMETNET OPERA program. The Maximum Reflectivity (CIRRUS) product is produced by Météo-France, while the Surface Rain Rate and Accumulation (NIMBUS) products are produced by GeoSphere Austria, with developmental support from KNMI and SMHI. Data access and licensing are governed by EUMETNET policies.