JMA Weather Station Guide: AMeDAS & Observatory Data, JST Rules & Excel Export
Quick start
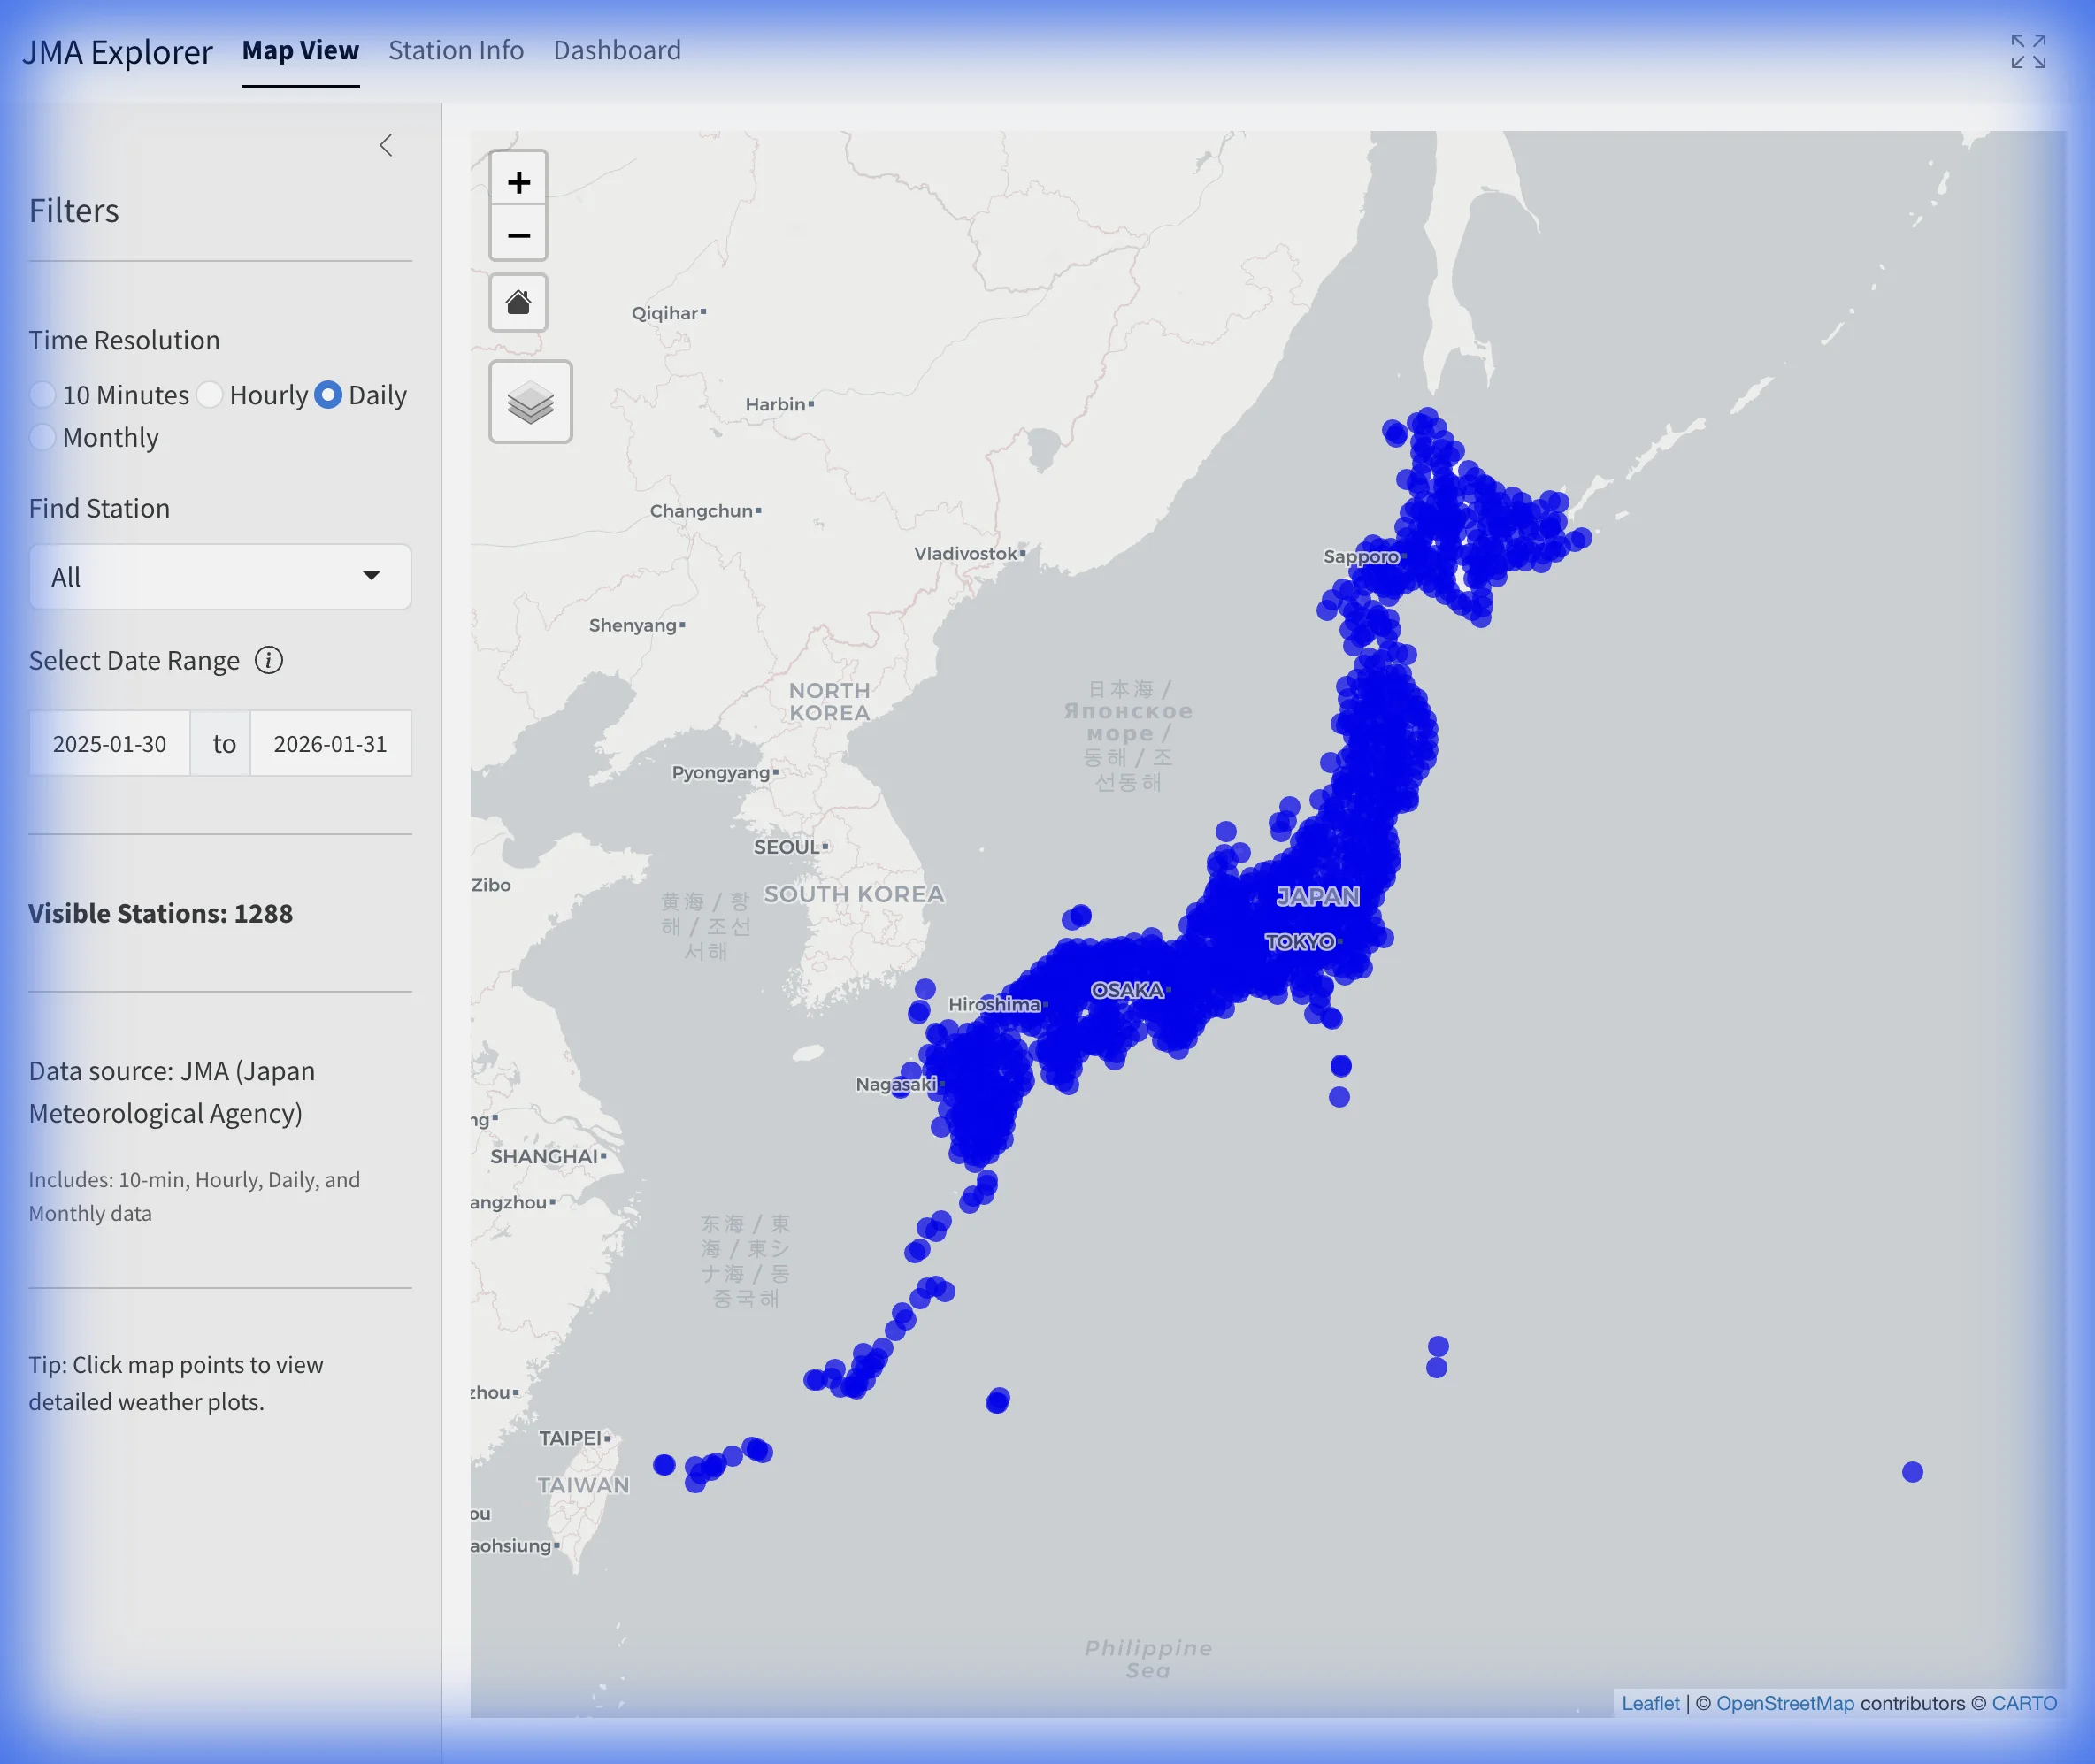
- Open the explorer and choose 10 Minutes, Hourly, Daily or Monthly.
- Set a date range, then find a station on the map or in Station Info.
- Open Dashboard and check both Plots and Data.
- Select Export Excel to download the current parsed table as an
.xlsxworkbook.
The explorer is an independent interface for observations produced and published by the Japan Meteorological Agency (JMA). Climate Explorer retrieves and parses selected JMA historical tables; it does not produce the observations and is not affiliated with or endorsed by JMA.
1. Choose the right station family
JMA’s Past Weather Data Search uses different table families for surface observatories and AMeDAS sites. Their URLs commonly contain s1 or a1, respectively. This distinction matters because the source columns are not identical.
| Source-table family | What it represents in this guide | Typical distinction |
|---|---|---|
s1 |
Surface-observatory tables | Can expose a broader set of elements, such as pressure, humidity and some visually observed fields. |
a1 |
AMeDAS tables | Automated sites; the available combination of precipitation, temperature, wind, humidity and snow depends on the site. |
The explorer may display the source grouping as AMeDAS or Manned station. Treat that as a portal/table classification, not proof that a person currently staffs a particular site. JMA’s surface-observation overview explains that both manned and unmanned surface stations use automatic observing equipment.
2. Set resolution and dates
The left sidebar controls the resolution, station search and requested period.
| Resolution | Useful for | Maximum period per request |
|---|---|---|
| 10 Minutes | Short-duration changes | 93 days |
| Hourly | Within-day patterns | 93 days |
| Daily | Daily summaries | 366 days |
| Monthly | Longer summaries | 1,826 days, or about five years |
These are Climate Explorer request limits, not statements about the full length of JMA’s archive. Change the dates and repeat the export when you need a longer period. Record availability still depends on the selected station and variable.
JMA source tables use Japan Standard Time (JST). If an hourly source row uses hour 24, interpret it as the end of that Japanese civil day before converting timestamps to another time zone.
Observation Hours: The 9:00 to 9:00 JST Daily Precipitation Rule
When analyzing precipitation records across different tools, international climate databases, or research publications, you may encounter two distinct definitions of a “daily” precipitation total:
JMA Portal & AMeDAS Daily Tables (Civil Day: 00:00 to 24:00 JST): In JMA’s domestic digital portals (including the
daily_a1.phpanddaily_s1.phptables accessed by Climate Explorer), the daily precipitation total (日降水量) aggregates rainfall over the local Japanese civil calendar day—from 00:01 to 24:00 JST (midnight to midnight). Each hourly value in JMA tables represents the accumulation during the preceding 60 minutes ending at that hour.The Synoptic and Climatological Observation Day (9:00 to 9:00 JST): Under World Meteorological Organization (WMO) synoptic reporting standards and historical climatological practice, the 24-hour meteorological observation day runs from 00:00 UTC to 24:00 UTC. Because Japan Standard Time is fixed at UTC+9 without daylight saving time, midnight UTC corresponds to 09:00 AM JST. A synoptic daily precipitation total recorded at 09:00 JST represents the rainfall accumulated over the 24-hour window from 09:00 JST on the previous calendar day to 09:00 JST on the observation date.
Why this 9-hour phase offset matters:
- Attribution of morning rainfall: Heavy rain falling between midnight and 09:00 JST belongs to calendar day D in JMA daily tables and Climate Explorer daily exports, but is counted as part of the observation day ending at 09:00 JST on day D (corresponding to day D−1 in UTC-based archives).
- International dataset alignment: Global climatological databases (such as NOAA GHCN-Daily, WMO CLIMAT bulletins, and international reanalyses) ingest Japanese synoptic observations aligned to the 00:00 UTC day. Consequently, daily precipitation values reported in NOAA GHCN or WMO summaries will not match JMA’s domestic calendar-day totals for the same nominal date.
- Historical manual day boundaries (Ninkai): In historical manual observations before modern automated AMeDAS telemetry, Japanese weather stations performed manual rain gauge readings at 09:00 JST. Long-term historical studies must account for this day boundary (ninkai / 日界) to avoid artificial step-changes when stitching historical manual logs with modern digital series.
If your research requires 24-hour totals strictly aligned to 00:00 UTC (9:00 AM to 9:00 AM JST):
- Select Hourly resolution in the JMA Explorer rather than Daily.
- Export the hourly series for your target window (including one extra day).
- Sum the 24 consecutive hourly observations from hour
10of day D−1 through hour9of day D.
3. Find and verify a station
Map View
The map filters station markers using the current resolution and dates. Select a marker to see its name, identifier, source grouping and record summary. The sidebar’s Find Station control is faster when you already know a name.
Do not use the visible-station count as a fixed network total. It changes with the selected resolution, dates and current metadata.
Station Info
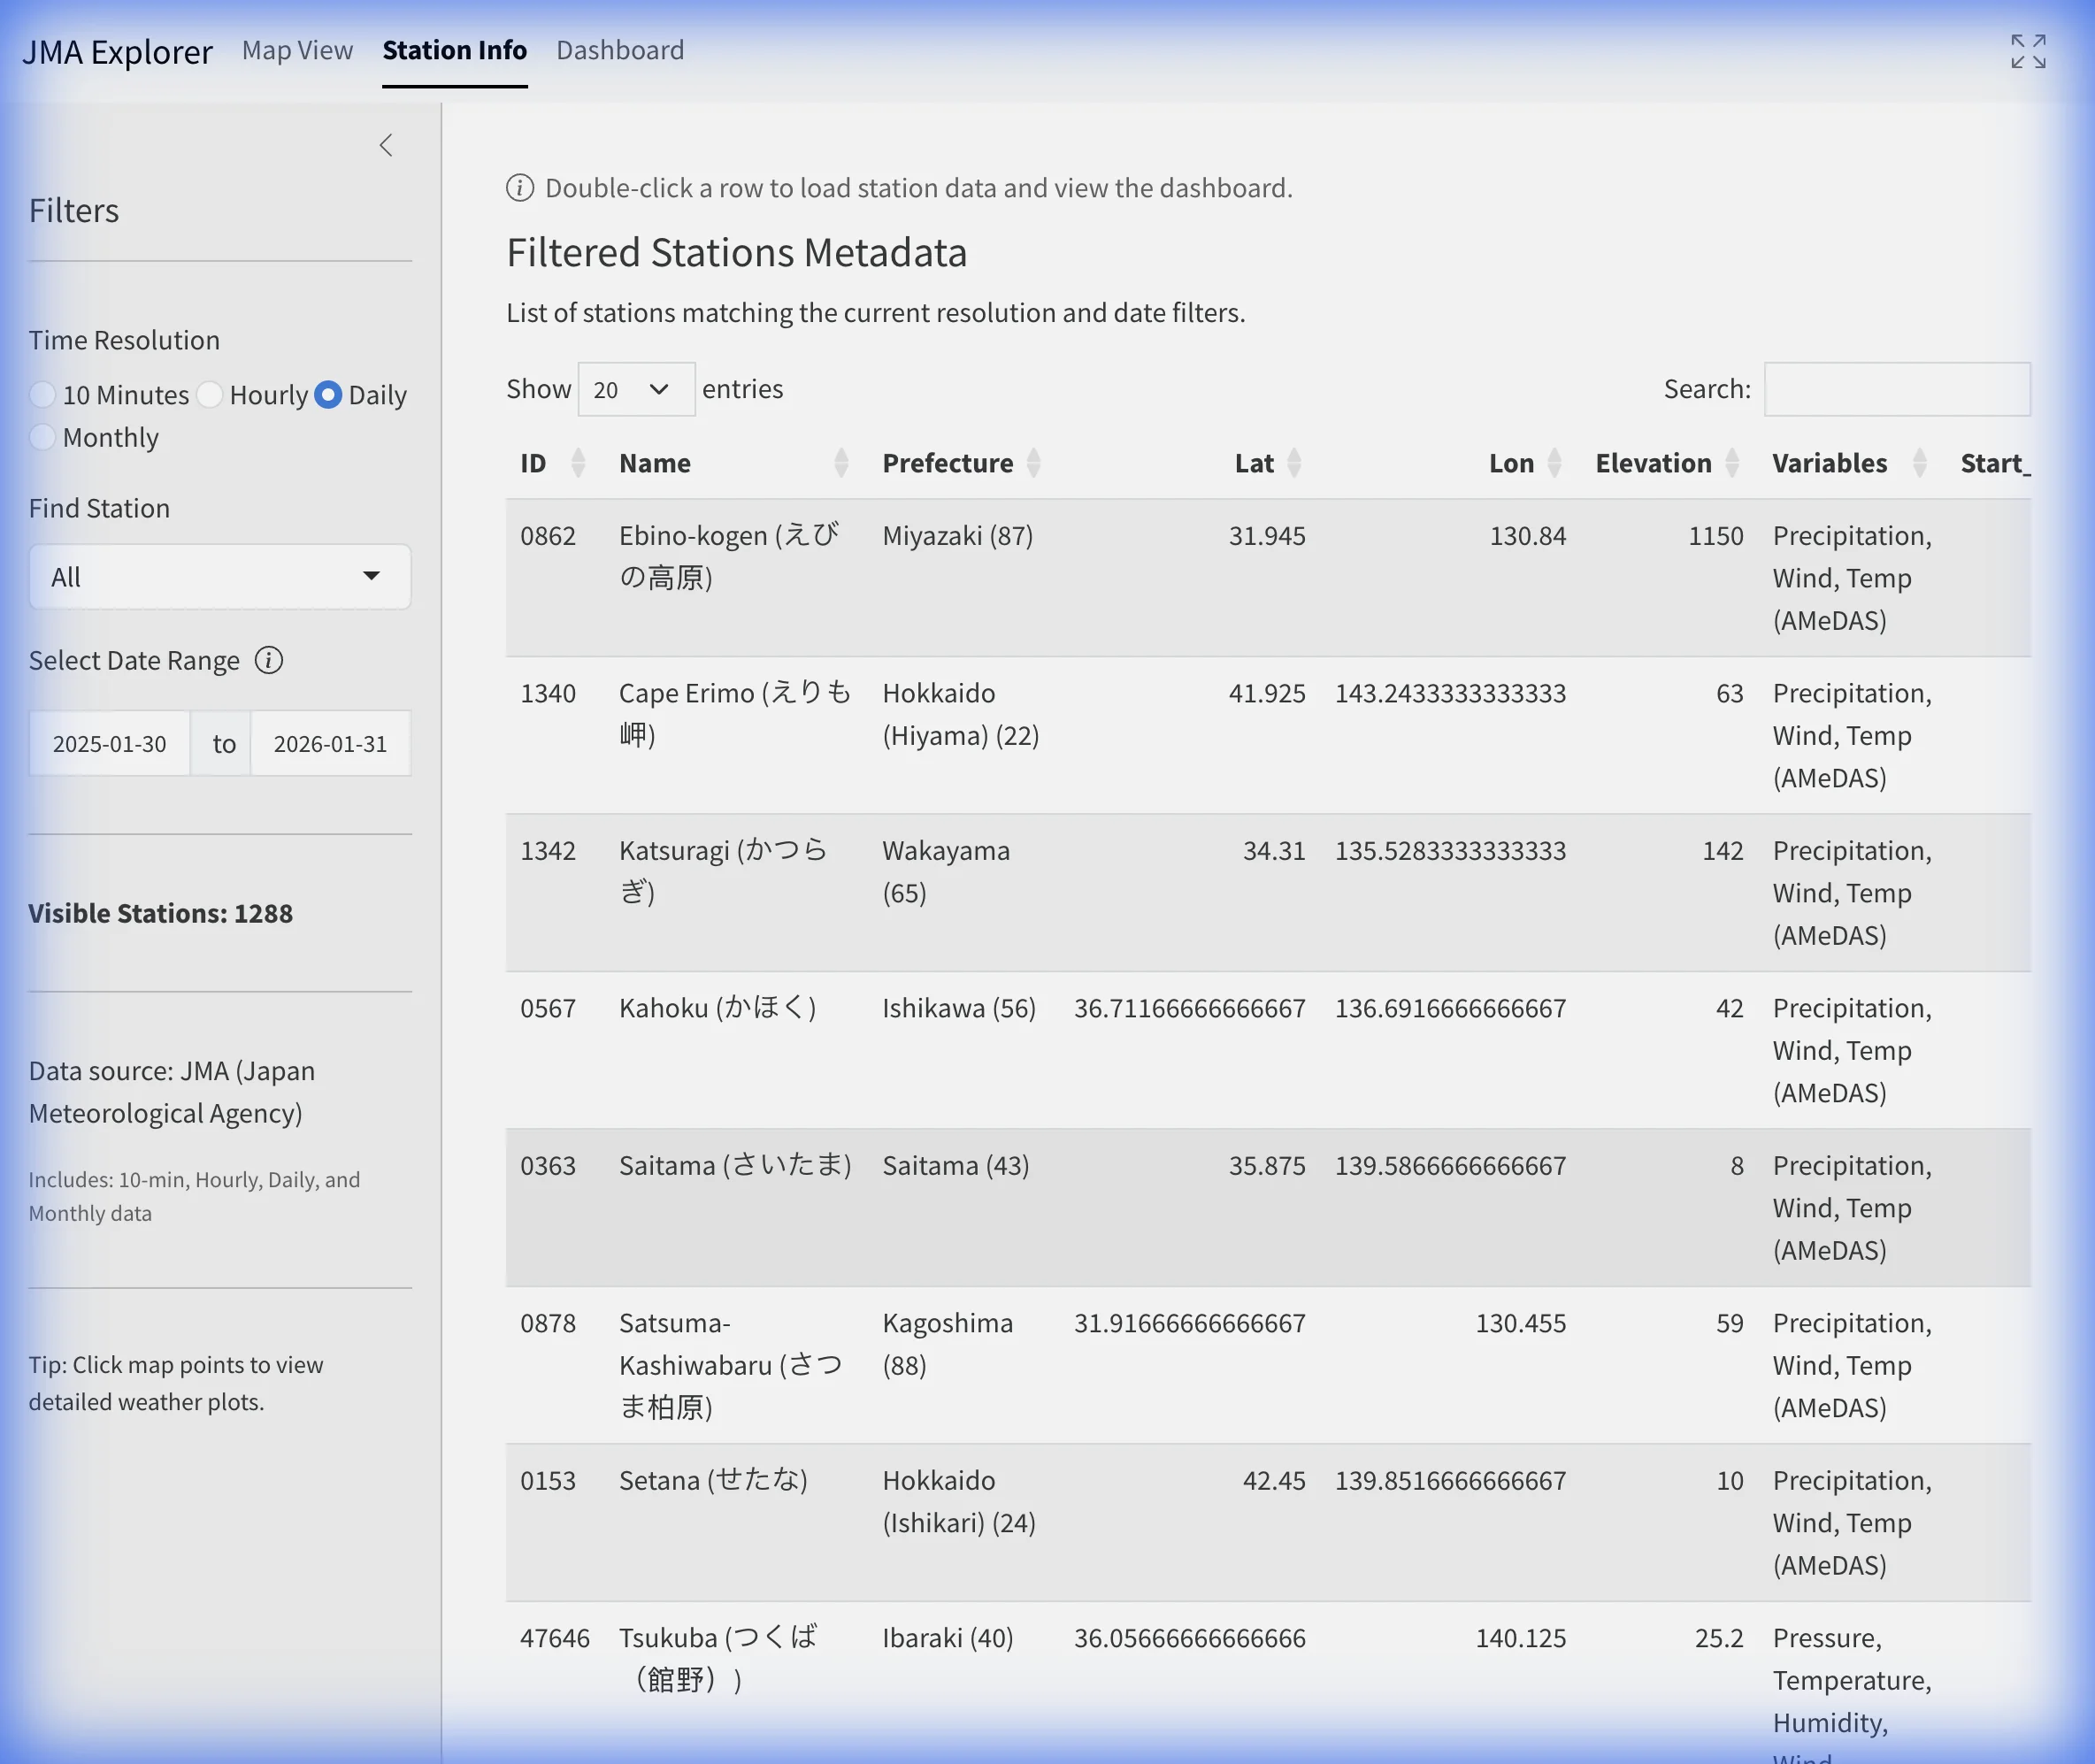
Use Station Info to check metadata before requesting observations. The table can show:
- JMA block identifier;
- English and Japanese names;
- prefecture;
- latitude, longitude and elevation;
- variables associated with the station; and
- start and end dates by resolution.
Double-click a row to select the station and open its dashboard. If two similarly named sites appear, compare their identifier, coordinates, elevation and operating period rather than relying on the name alone.
4. Inspect plots and data
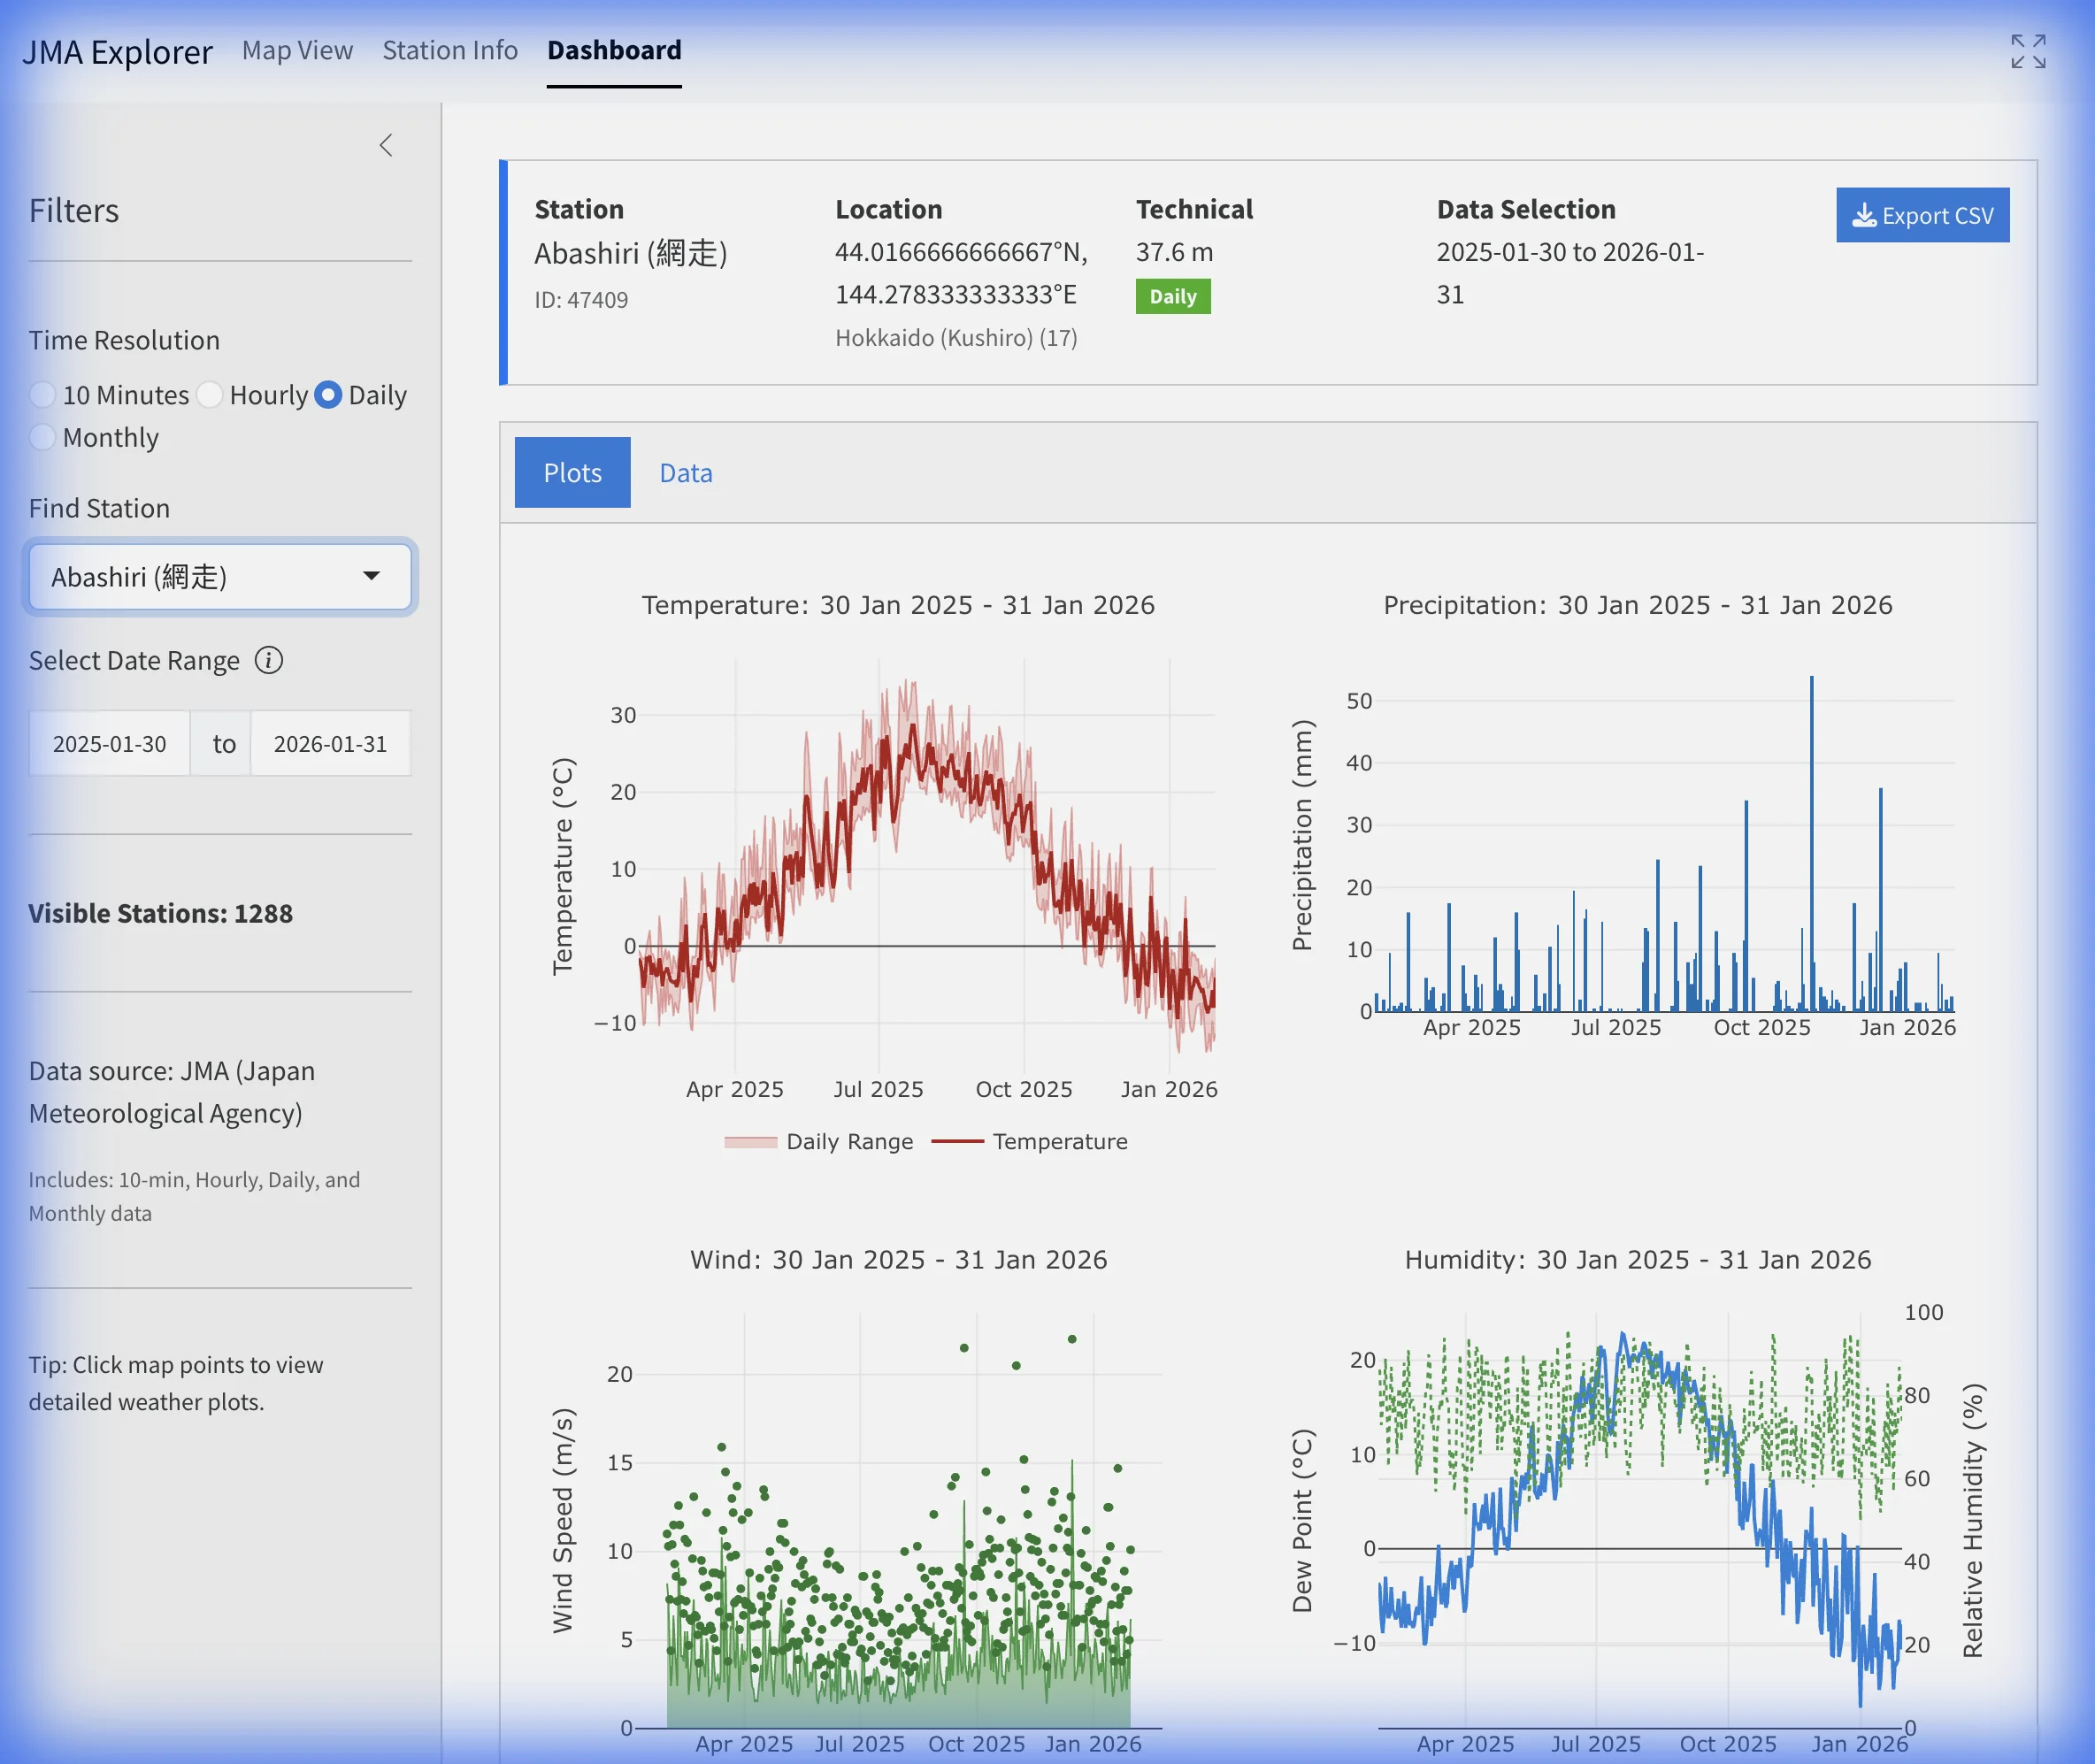
The Dashboard header records the selected station, location, elevation, resolution and dates. Confirm these before interpreting or exporting results.
The Plots view summarizes only fields present in the returned table. Depending on station and resolution, panels can include temperature, precipitation, wind, humidity, pressure, sunshine or snow. A missing panel does not necessarily mean that a variable never existed; it means the current parsed selection does not provide a usable series for that panel.
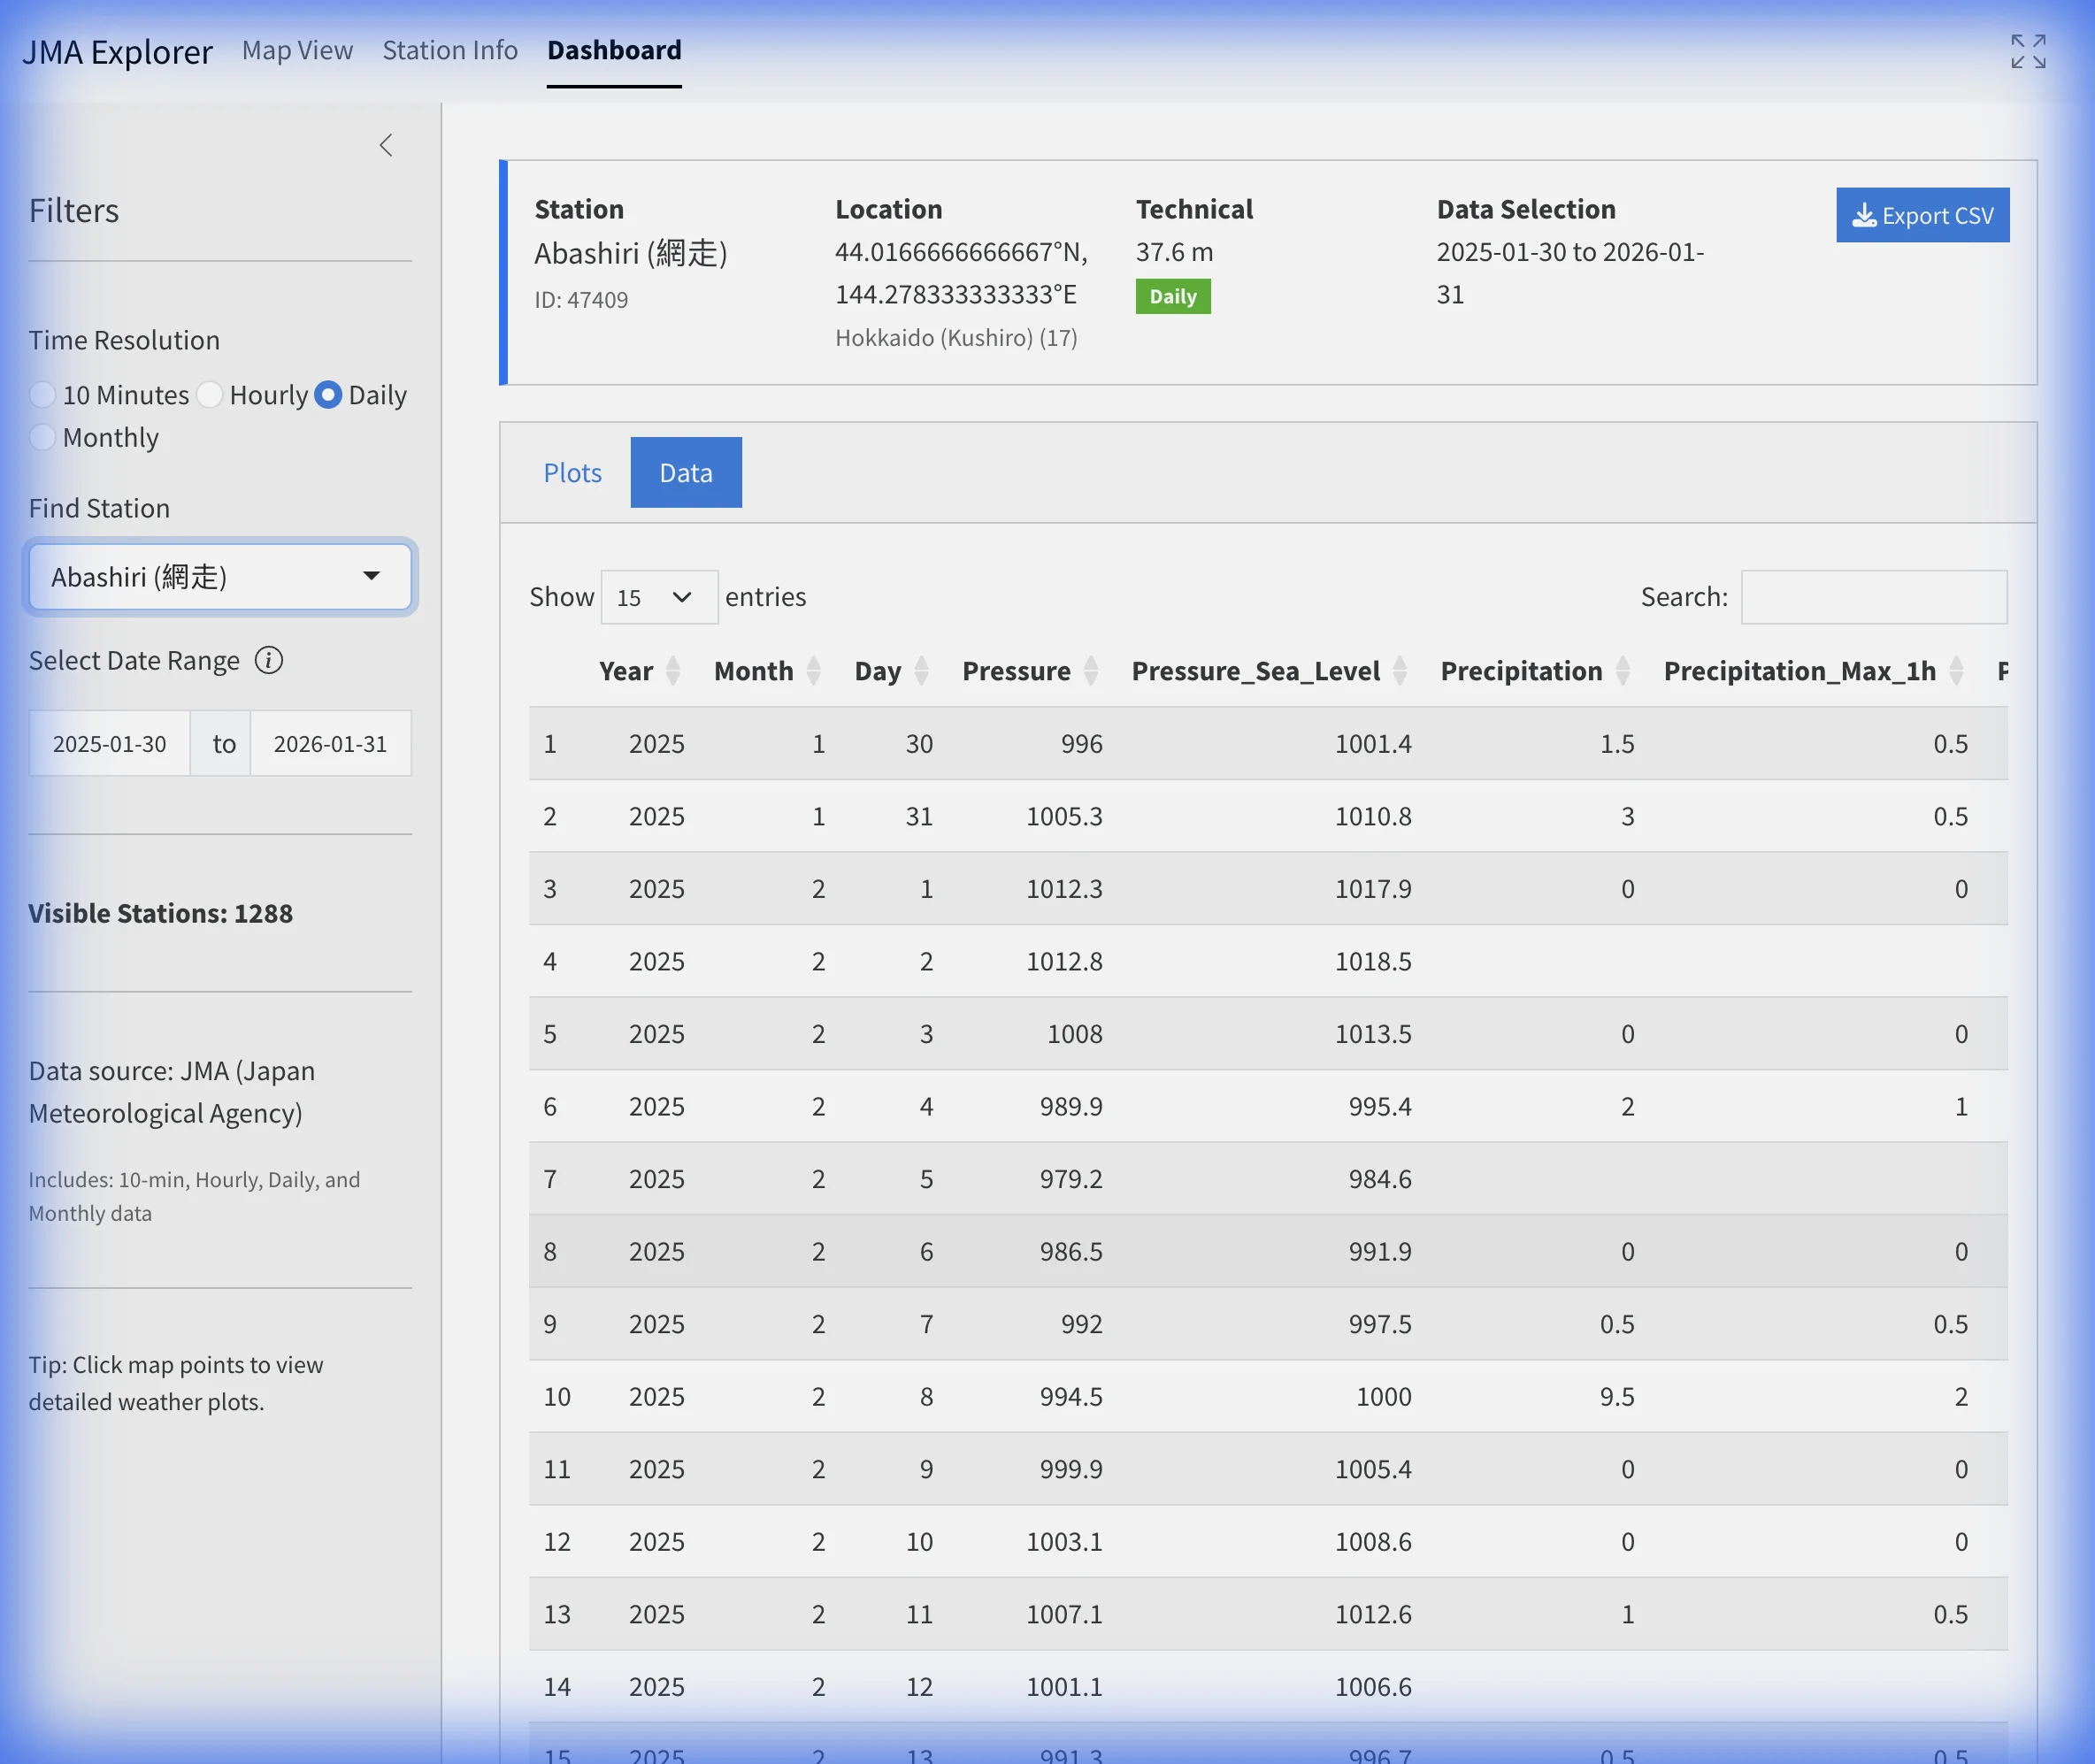
Open Data to inspect the rows behind the plots. Use the search and pagination controls to locate dates or values. Blank cells can represent unavailable, missing or unparsed source values, so consult the official JMA table when flags or exact source notation matter.
5. Export an Excel workbook
- Confirm the station, resolution and dates in the dashboard header.
- Open Data and check that the expected dates and columns are present.
- Select Export Excel.
- Open the
.xlsxfile and preserve the station identifier, resolution, time zone and retrieval date with your analysis notes.
The workbook is generated by Climate Explorer from the parsed selection. It is not an official JMA bulk file and does not replace the original table, annotations or revisions.
| Preserve with the workbook | Why it matters |
|---|---|
| Station name and block identifier | Distinguishes similarly named or translated locations. |
| Resolution and requested dates | Defines the aggregation and selection window. |
| Japan Standard Time | Prevents accidental date shifts during conversion. |
| Source URL and retrieval date | Supports later verification against JMA revisions. |
6. Understand the processed columns
Column availability varies by station, table family and period. These are the processed fields Climate Explorer can expose when the corresponding JMA columns are present.
| Processed field(s) | Display unit | Typical resolution(s) | Interpretation |
|---|---|---|---|
Year, Month, Day, Hour, Time |
JST components | all | Source-table date and time components. Interpret hour 24 before converting time zones. |
Temperature |
°C | 10-minute, hourly | Air temperature reported for the table time |
Temp_Mean, Temp_Max, Temp_Min |
°C | daily, monthly | Provider-supplied period temperature summaries |
Pressure, Pressure_Sea_Level |
hPa | 10-minute, hourly, daily, monthly | Station pressure versus pressure reduced to sea level |
Precipitation |
mm | all | Precipitation for the source-defined interval or period |
Precipitation_Max_1h, Precipitation_Max_10min |
mm | daily | Largest source-defined 1-hour and 10-minute amounts in the daily table |
Humidity, Humidity_Min |
% | 10-minute, hourly, daily, monthly | Relative humidity and, where supplied, the period minimum |
Wind_Speed, Wind_Speed_Max (Wind_Max_Speed in some daily parses) |
m/s | all | Mean or instantaneous wind and the source-period maximum |
Wind_Gust_Speed |
m/s | daily, monthly | Maximum gust where the source table provides one |
Wind_Direction, Wind_Direction_Deg |
text or degrees | all | Compass text or numeric direction; availability depends on the table |
Sunshine_Minutes, Sunshine_Hours |
min at 10-minute; h otherwise | all | Sunshine duration, with a resolution-dependent processed field and display unit |
Solar_Radiation |
MJ/m² | daily, monthly | Integrated solar-radiation energy where observed |
Snowfall, Snow_Depth |
cm | daily, monthly | New snowfall and snow lying are separate fields |
Snow_Days, Fog_Days, Thunder_Days |
days | monthly | Counts of days with the named phenomenon |
Dew_Point, Vapor_Pressure |
°C, hPa | daily, monthly | Moisture variables available in some observatory tables |
Cloud_Cover, Visibility |
tenths, km | daily, monthly | Total cloud amount and visibility where supplied |
The same processed name can represent a different aggregation at 10-minute, hourly, daily or monthly resolution. JMA’s s1 and a1 table families can also expose different elements and source notation. Read the original heading, annotations and unit before combining exports; the workbook contains only fields successfully parsed from the selected table.
7. Troubleshoot common problems
- No stations match the filters
-
Shorten or move the date range, try another resolution, or clear the station search. A station can have daily records without having the same period at 10-minute resolution.
- A request returns no rows
-
Verify that the selected dates fall within the station’s period for that resolution. Then shorten the request. JMA can also revise or temporarily change source pages, so confirm the same selection in the official portal.
- A variable or chart is missing
-
Check Station Info and the Data columns. Equipment differs across station families and sites, and the available elements can change through time.
- The exported date appears shifted
-
Retain JST until you have interpreted any source hour
24value. Convert to UTC or another zone only after constructing the correct local date-time. - You need authoritative flags or documentation
-
Open the corresponding JMA Past Weather Data Search table. Climate Explorer translates and normalizes selected fields for convenience, which can omit source-page notation.
8. Choose the next page
- Use the JMA Explorer for broad station discovery and interactive comparison.
- Read How JMA’s AMeDAS and Observatory Tables Differ for the evidence-led explanation of why fields vary between JMA table families.
Official sources and terms
- JMA Past Weather Data Search
- JMA Historical Weather Data Download
- JMA AMeDAS overview
- JMA Surface Observation overview
- JMA website terms of use
JMA’s terms require source attribution when its website content is reused. They also note that content can be modified, moved or deleted without prior notice. Check the current terms for your use case.