Why JMA’s AMeDAS and Observatory Tables Have Different Fields
Open the daily weather tables for Tokyo and Fuchū in May 2026 and the difference is immediate: Tokyo has pressure columns; Fuchū does not. Both tables have humidity columns. The distinction is more specific than “observatories measure more things”—the actual headings tell you which comparison is possible.
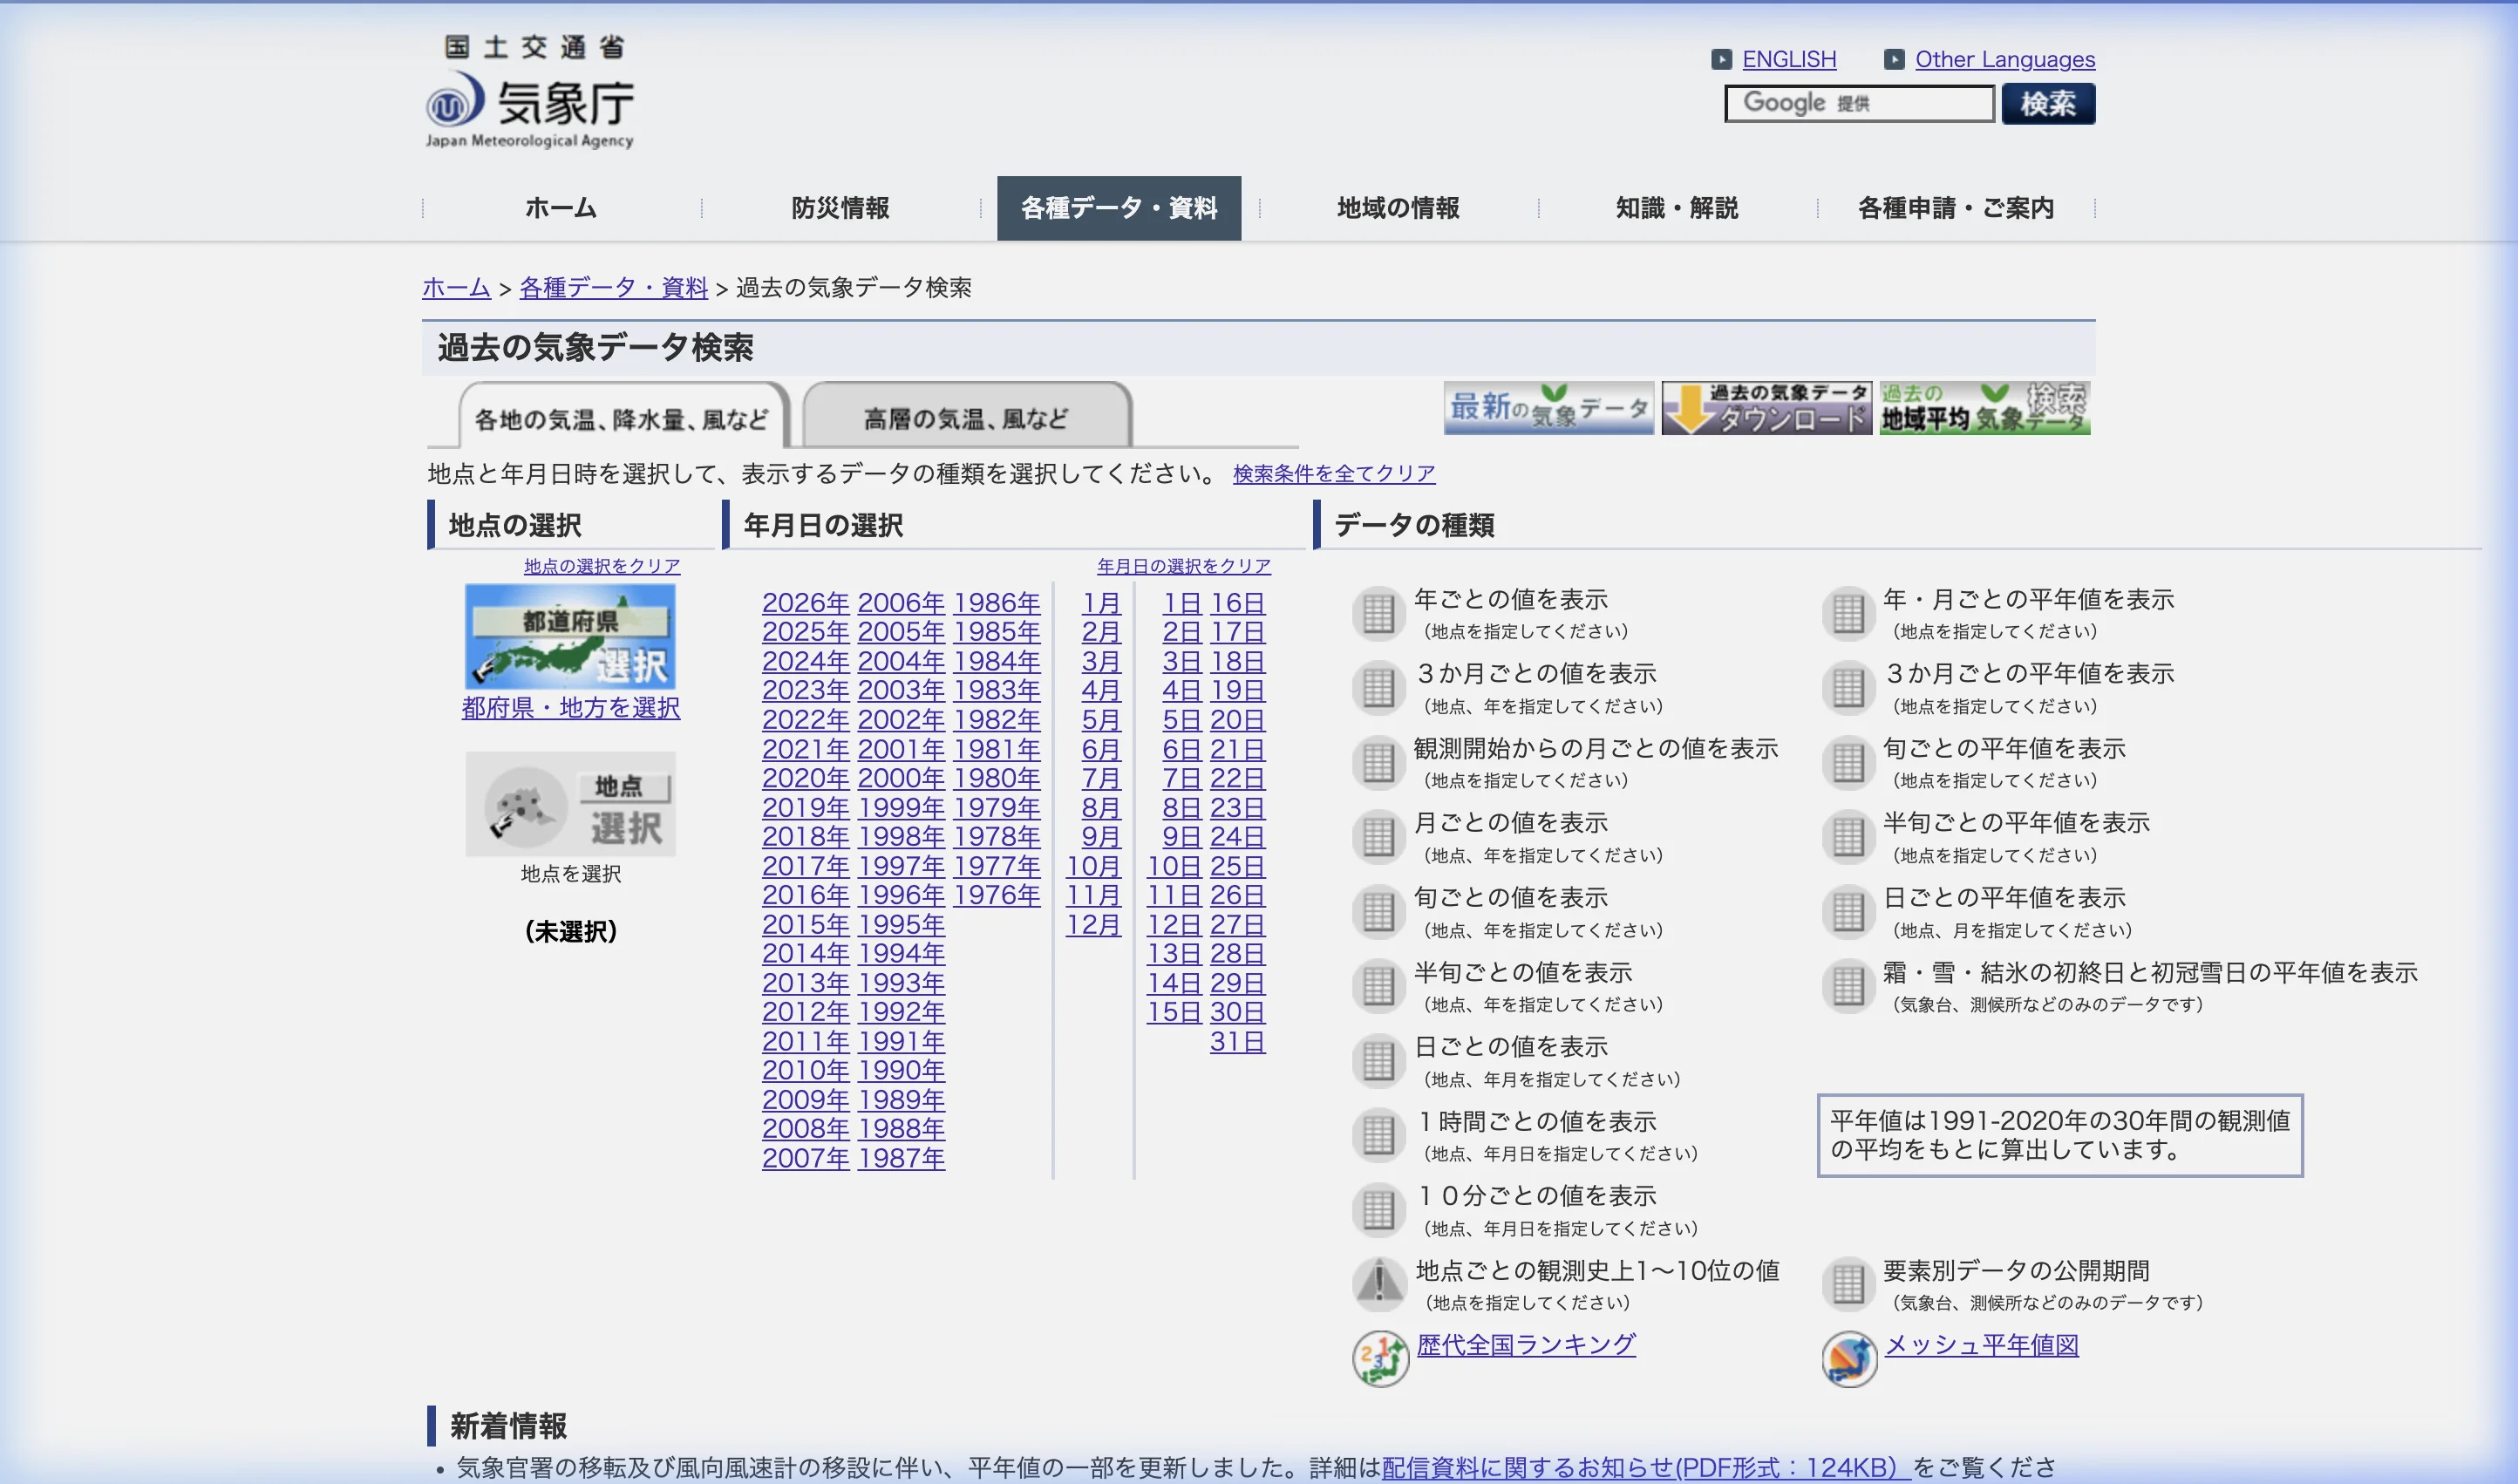
JMA serves these records through two table families, identified by s1 and a1 in their page addresses. Understanding that structure helps explain why nearby stations can return different fields from the same search portal.
What the Tokyo and Fuchū tables show
The Tokyo daily table for May 2026 uses daily_s1.php. Its main-element view includes station and sea-level pressure in hectopascals, followed by precipitation, temperature, humidity, wind and other fields.
The Fuchū daily table for the same month uses daily_a1.php. It includes precipitation, temperature, humidity and wind, but no pressure columns. Some other headings are present even when their cells do not contain numeric observations. The snow columns, for example, contain /// in this table. A parser must consult JMA’s notation instead of turning that symbol into zero.
This is a comparison of table structure, checked on 12 September 2026, rather than a comparison of the weather at the two sites. To calculate a temperature difference, we would also need to establish that the selected fields have matching definitions and time periods, then examine the station histories and missing values.
AMeDAS is not one standard instrument package
Fuchū’s table belongs to the AMeDAS family: JMA’s Automated Meteorological Data Acquisition System. The network includes rain-only sites as well as sites equipped for temperature, wind and humidity. Snow depth is measured at a subset of stations. That is why a network name alone cannot tell you which measurements a station offers.
The observation method matters too. JMA explains that sunshine duration at unmanned AMeDAS sites, except special automated weather stations, is estimated from satellite observations. A sunshine column therefore needs its method and period attached before it is compared with a record from a different observing system.
An observatory table does not imply a staffed station
JMA’s surface-observation system includes local meteorological offices and special automated weather stations. Its records can include pressure, visibility, cloud and weather phenomena as well as temperature, precipitation and wind. Some observations are automatic; other methods depend on the station and period.
For this reason, calling every s1 record a “manned station” says more than the page address establishes. Surface-observatory table is a more accurate label for the family. Neither s1 nor a1 guarantees a fixed set of instruments throughout a station’s history.
Preserve the identifiers, not just the name
Both example requests use prec_no=44, the portal’s area selector. Tokyo uses block_no=47662; Fuchū uses block_no=1133. Keep those values with the table family, selected month and source URL. Do not substitute a station code from another JMA product without checking the mapping.
Names alone are less dependable: translations and romanizations can vary. The requested resolution also belongs in the record. A daily total, an hourly value and a monthly mean can share a familiar weather label while describing different quantities.
When extending a comparison over years, check station changes and JMA’s correction notices. A long sequence of downloadable tables is evidence of availability, not proof that instruments, location and reporting practices stayed constant.
Use the interface for discovery and the source for verification
The JMA Explorer provides an English-language way to inspect selected records. The JMA station-data guide covers selection and exports. For a published calculation, keep the official table alongside the processed data so that headings, flags and missing-value notation remain available.
JMA is the data producer. Its terms require source attribution and identification of edited content; translating or reorganizing a table does not transfer ownership of the observations to Climate Explorer.
Data Annex
| May 2026 daily main-element view | Tokyo | Fuchū |
|---|---|---|
| Table family | daily_s1.php |
daily_a1.php |
| Portal area and station | prec_no=44, block_no=47662 |
prec_no=44, block_no=1133 |
| Station and sea-level pressure headings | Present, in hPa | Absent |
| Temperature and humidity headings | Present | Present |
| Scope of this check | Column structure, not station-to-station weather differences | Column structure, not station-to-station weather differences |
| Before comparing values | Why it matters |
|---|---|
| Match variable, statistic and unit | A maximum and a mean are different quantities even when both describe temperature. |
| Match resolution and observation period | Aggregation can hide timing and changes within a day. |
| Preserve notation and quality information | A blank or symbol can carry information lost by numeric conversion. |
| Check location and station history | Relocation and instrument changes can affect a long comparison. |
| Retain URL, identifiers and retrieval date | Provider tables can be corrected after retrieval. |
Data Sources
- JMA Past Weather Data Search: station selection, table notation and correction notices; the two dated tables are linked in the text.
- JMA AMeDAS overview: network equipment, observation elements and sunshine estimates.
- JMA Surface Observation overview: surface stations and observation methods.
- JMA website terms of use: attribution and edited-content requirements.