Météo-France Open Data Guide: French Weather Stations & Excel Export
Open the Météo-France Explorer
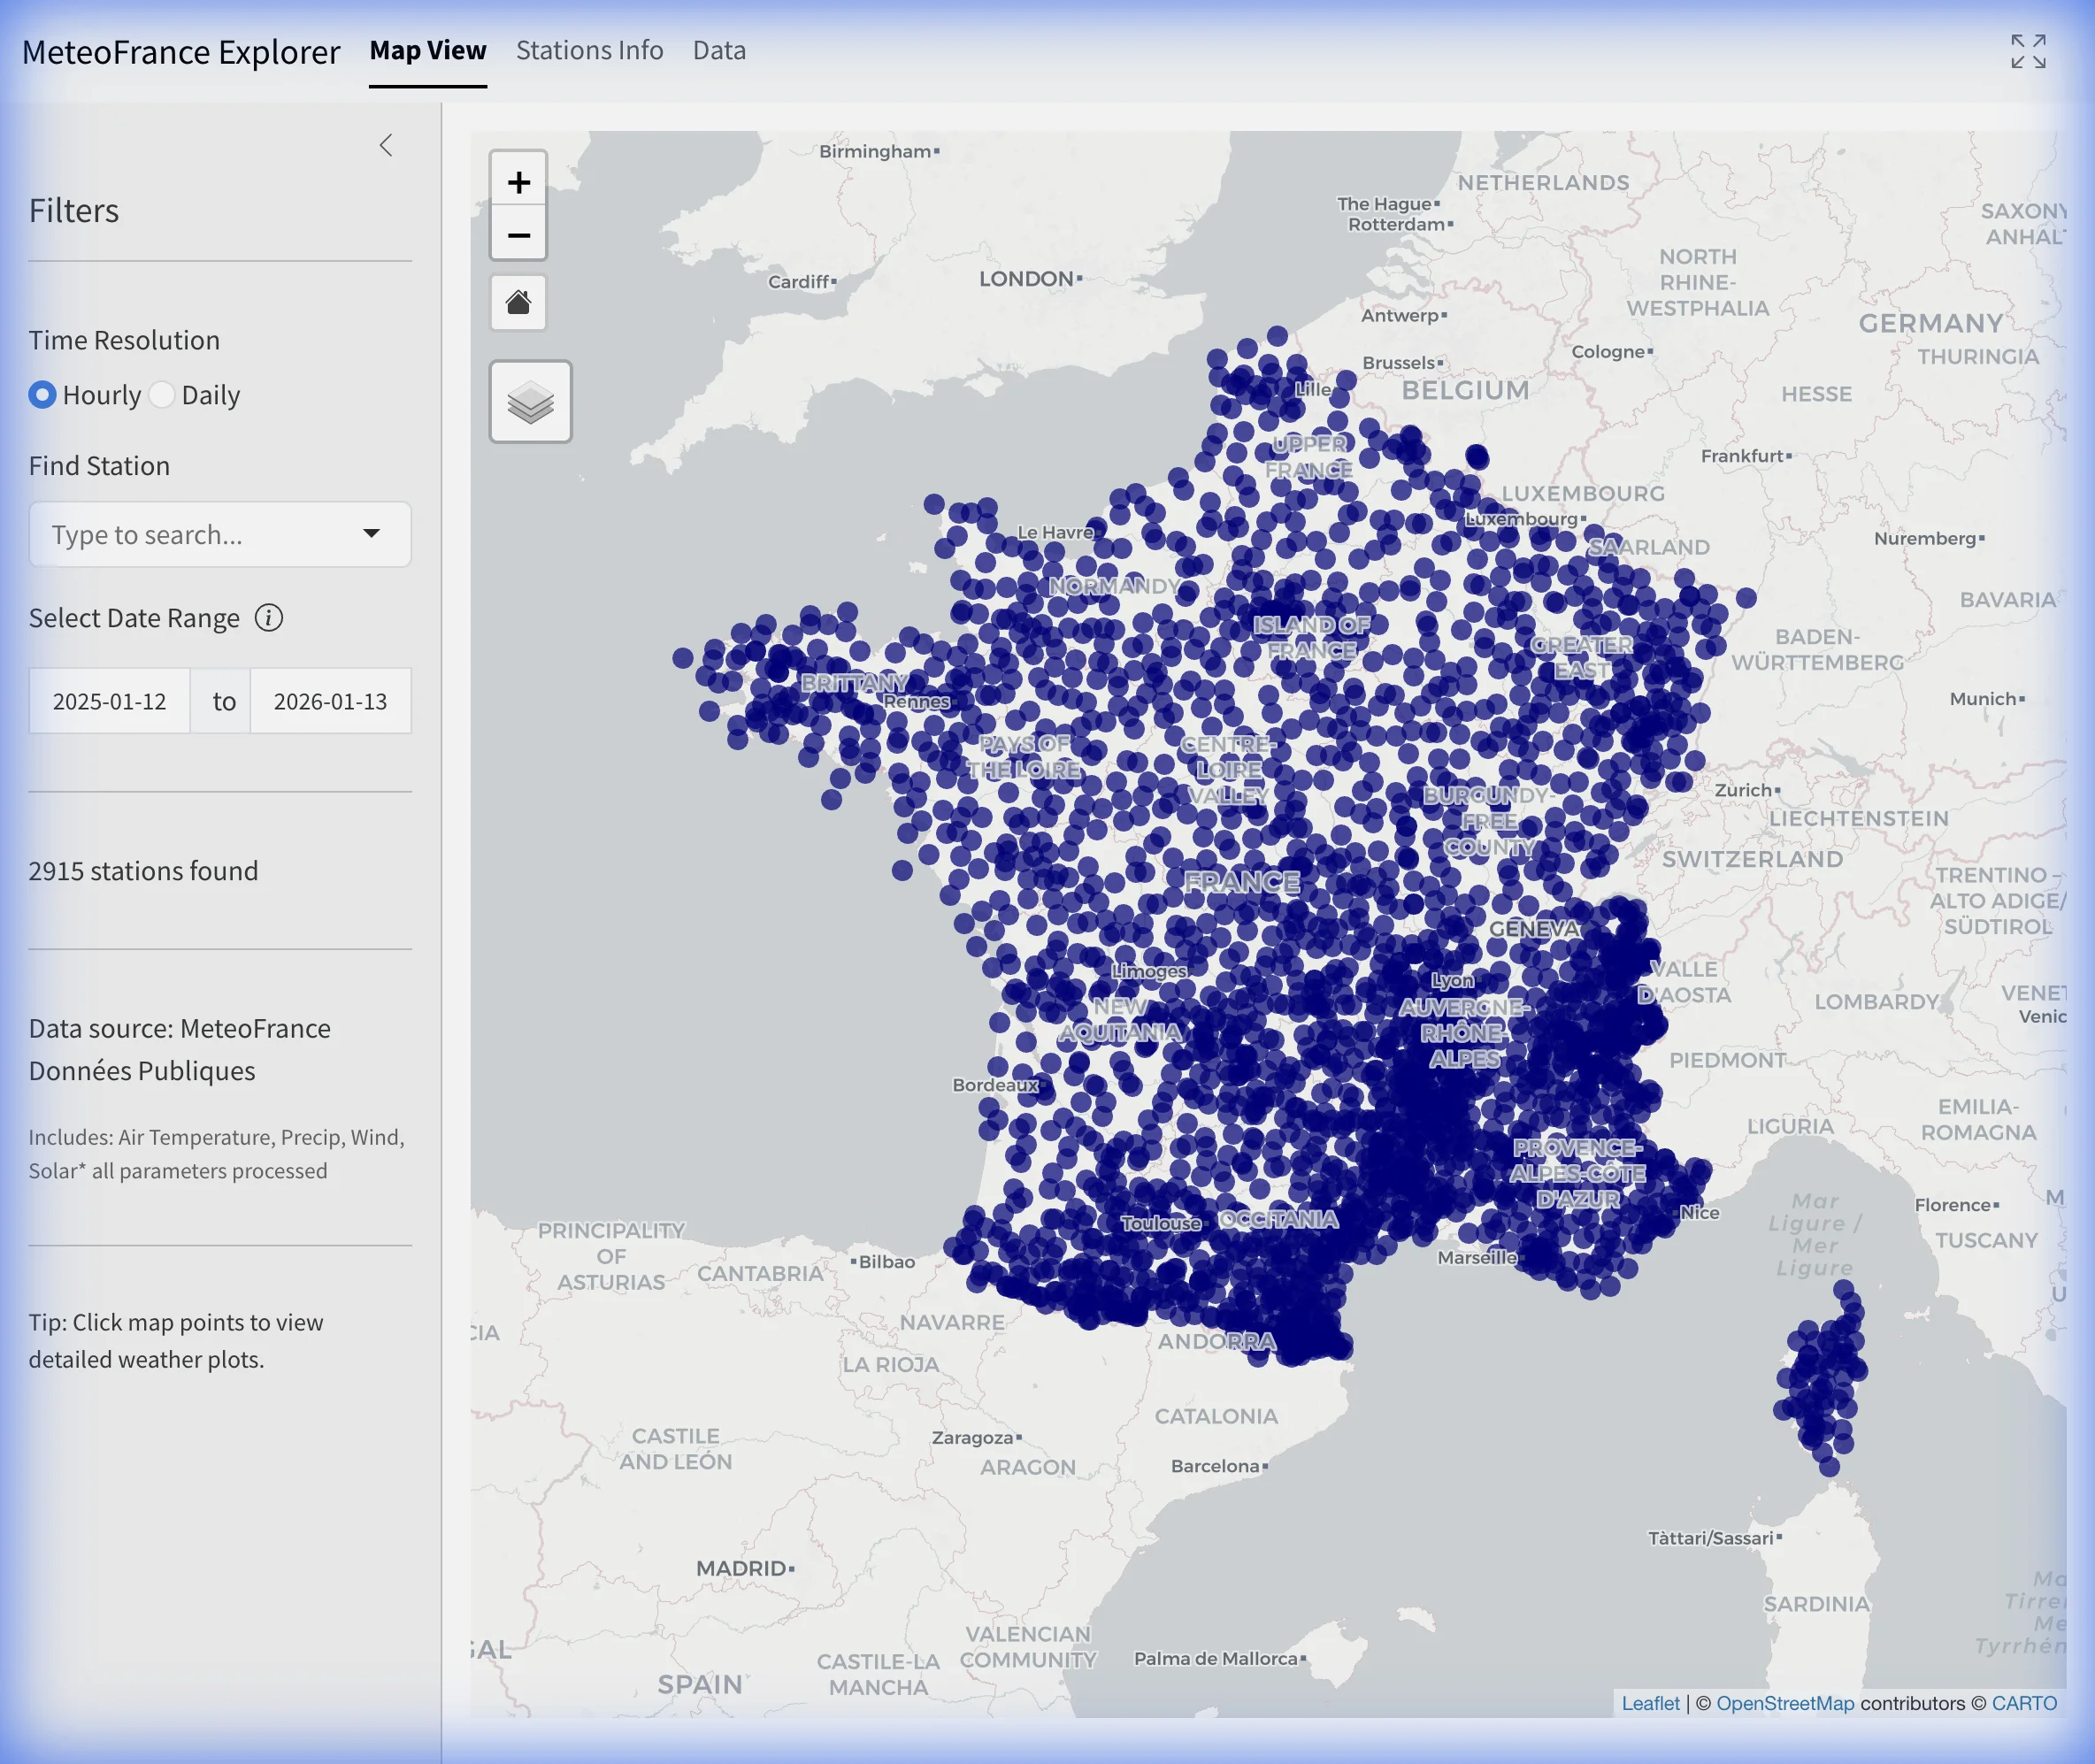
Quick start
- Open the explorer and choose 6-min, Hourly, Daily, or Monthly.
- Filter by department or search for a station by name.
- Select a map marker, or open Stations Info and load a table row.
- Wait until the dashboard shows the station name and an actual loaded period.
- Inspect Plots and Data, then select Export Excel if you need the loaded table.
What this guide helps you do
The Météo-France Explorer is an independent interface for observations published by Météo-France through meteo.data.gouv.fr and data.gouv.fr. It helps readers discover stations and work with manageable time windows without replacing the official archive.
Météo-France owns the observations, field definitions, quality control and source-file revisions. Climate Explorer parses selected files, aligns common fields to consistent display names, converts temperature values to degrees Celsius when required by the parsed input, and creates the plots and workbook export shown here.
1. Choose the resolution before the station
Resolution controls which station records are eligible, the default date window and the variables that can appear.
| Explorer mode | What it represents | Initial window | Maximum accepted window | Best use |
|---|---|---|---|---|
| 6-min | Precipitation increments only | about 90 days | 1 year | Short rainfall timing and intensity |
| Hourly | Within-day observations | about 90 days | 1 year | Weather evolution, wind shifts and diurnal cycles |
| Daily | Daily summaries and indicators | 1 year | 1 year | Events, seasons and station comparisons |
| Monthly | Provider-supplied monthly values | about 3 years | about 3 years | Seasonal and multi-year context |
The date range also filters the station network: a station remains available only when its metadata overlaps the selected period. Changing resolution can therefore change the map and station count before any observations are loaded.
A 6-minute or hourly record describes the observation interval. It does not mean the downloadable archive is republished every 6 minutes or every hour. Météo-France documents daily updates for files covering the most recent two years, with older batches refreshed monthly or annually depending on the product and period.
2. Find a station on the map
Use Filter by Department to narrow the network, or type a station name in Find Station. Selecting a station centers the map and starts loading data for the current resolution and date range.
The guide’s opening map shows Lyon–Saint-Exupéry (69299001) selected in Daily mode. The date controls show the requested window; the dashboard later confirms which dates were actually loaded.
Map controls include:
- Basemap and labels: Change the map background or label visibility.
- Home: Reset the map to the available station extent.
- Full Screen View: Click the Maximize / Full Screen button in the top-right corner of the explorer window to expand the dashboard to full display size. This is recommended when inspecting complex multi-panel charts, high-density station maps, or large data tables. Press
Escor click the icon again to exit.
3. Use Stations Info to check availability
The Stations Info tab provides station ID, name, department, elevation, represented parameter groups and an availability summary. Search or sort the table when a map contains too many nearby points.
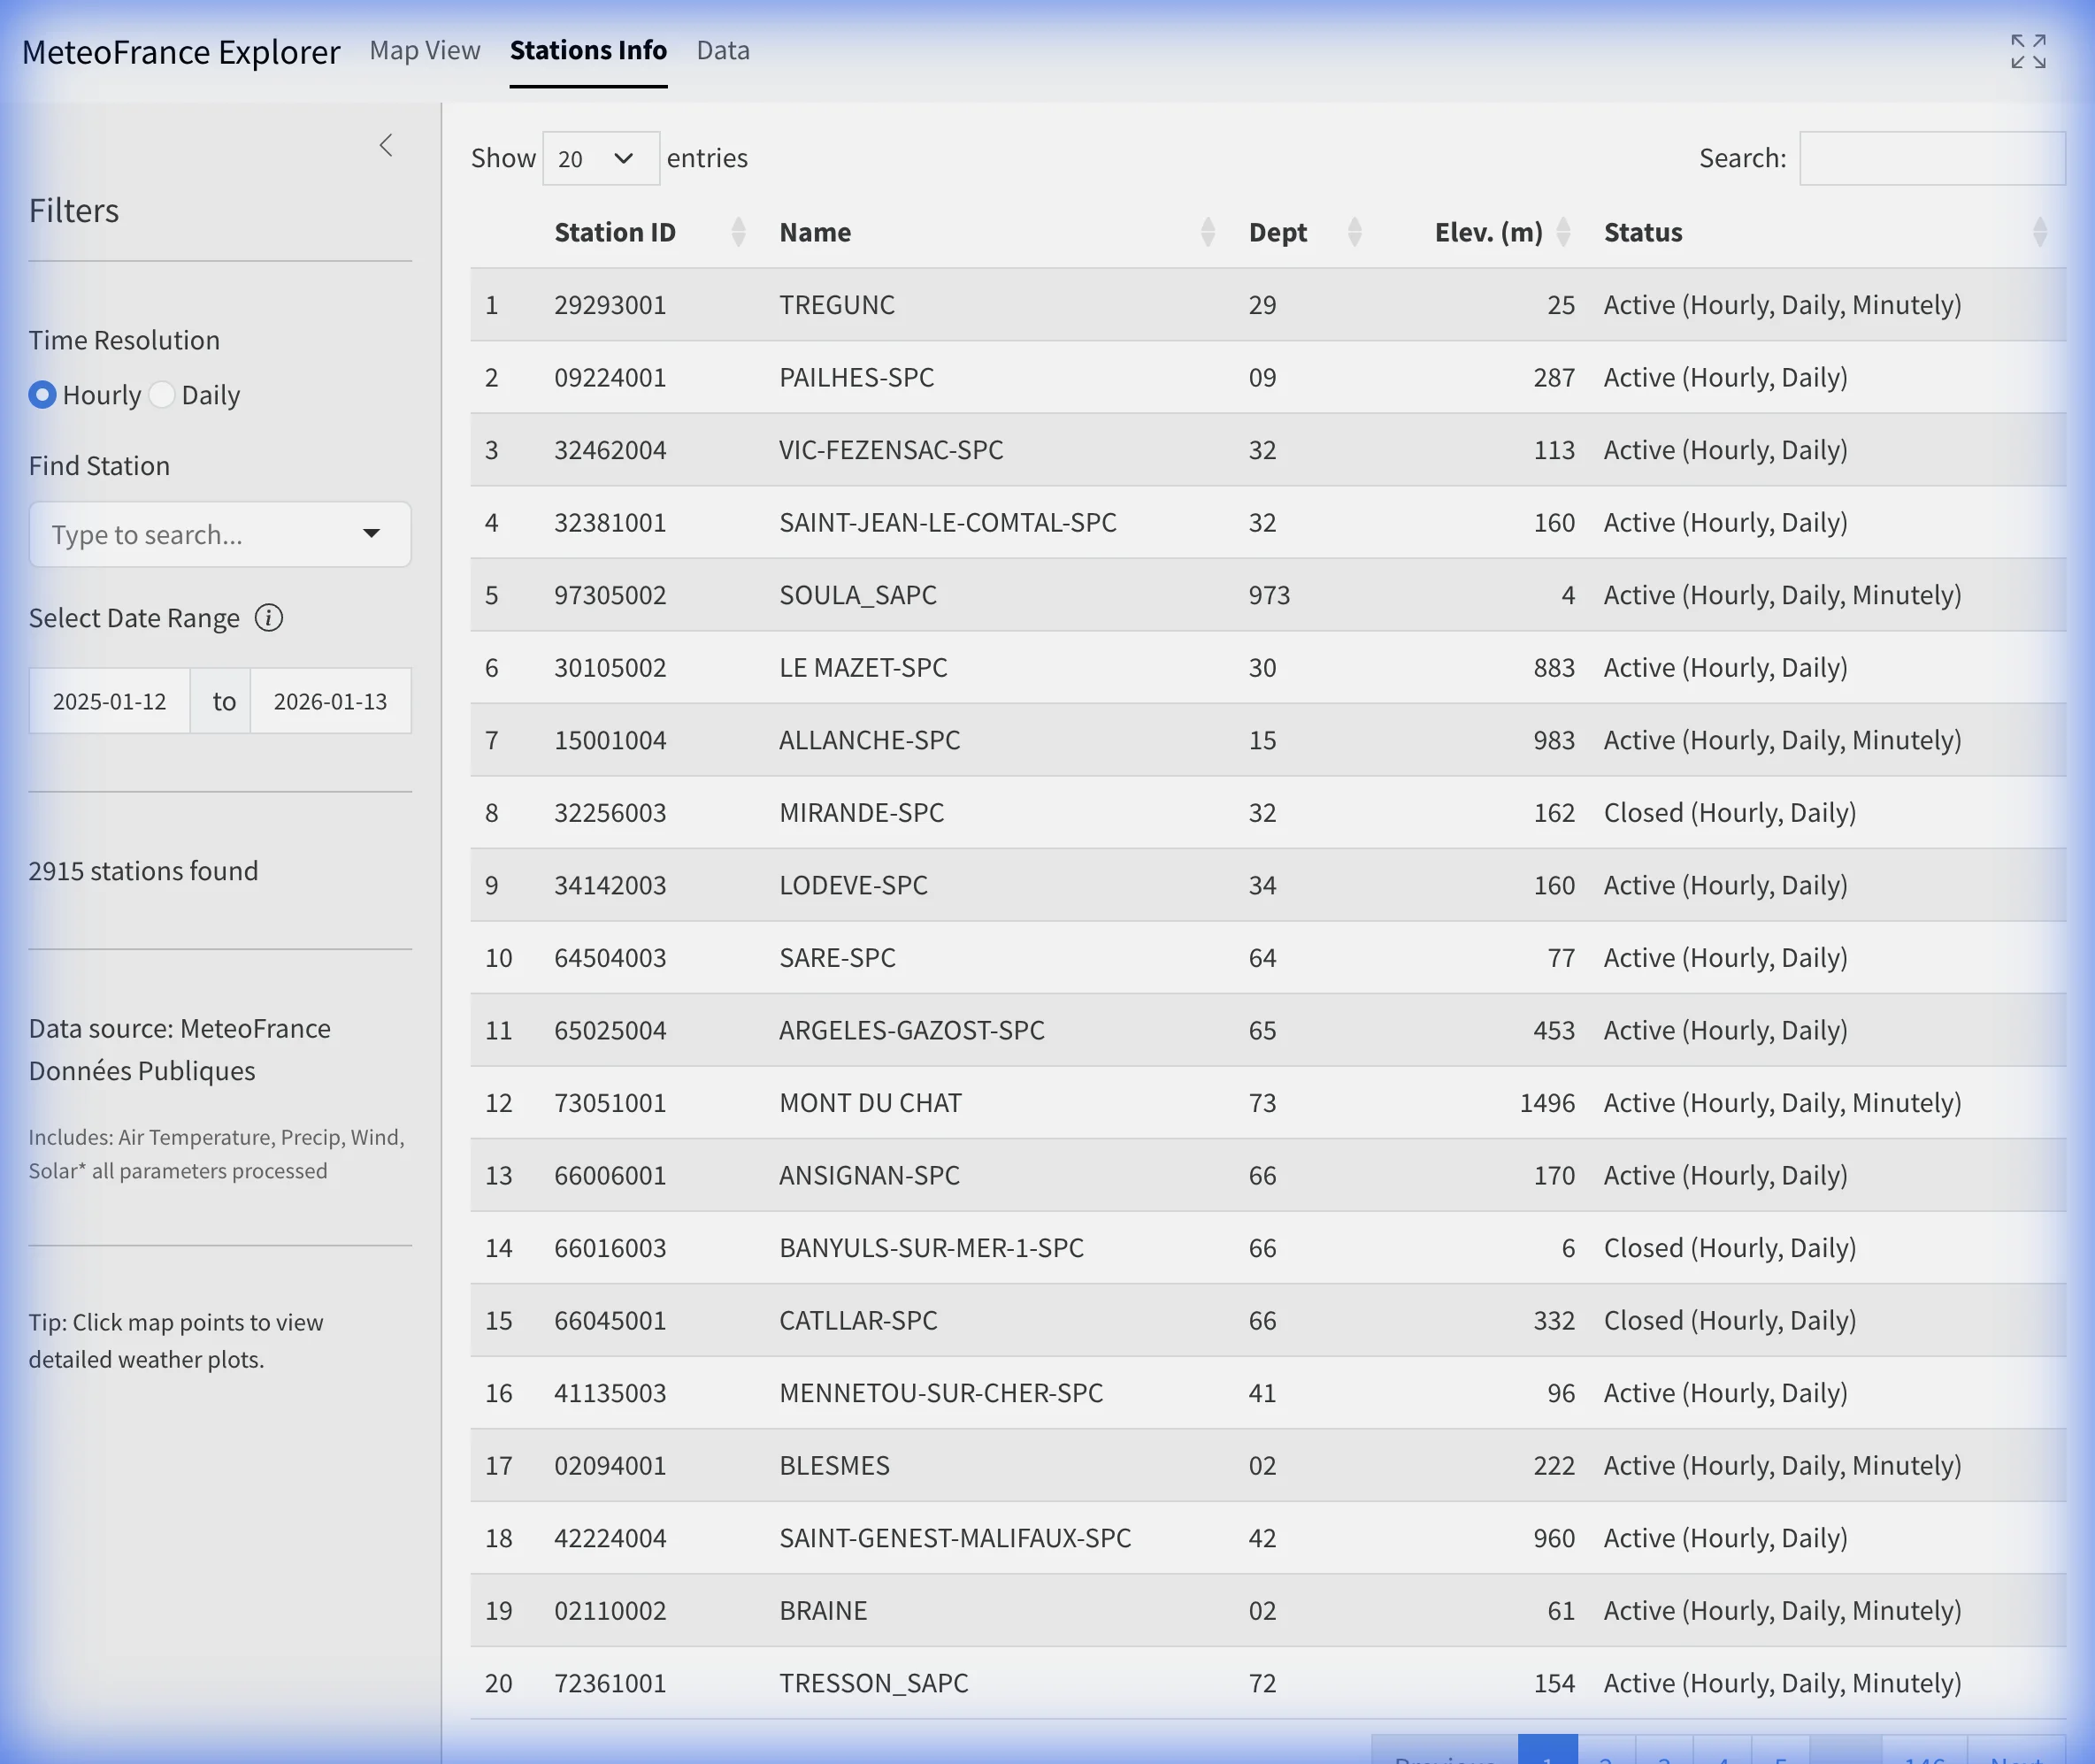
The populated station catalogue is visible before selection. Double-click a row on desktop or tap once on mobile to load that station and open its dashboard.
Treat the Status column as an explorer availability summary. Active or Closed reflects station metadata and the represented record; it does not establish current staffing, instrument configuration, maintenance state or real-time reporting for every variable.
4. Confirm the loaded station and period
Do not read the charts until the loading state has finished. The dashboard header should show:
- station name and Météo-France station ID;
- department, coordinates and elevation;
- selected resolution;
- the actual first and last dates present in the parsed table; and
- the Export Excel action.
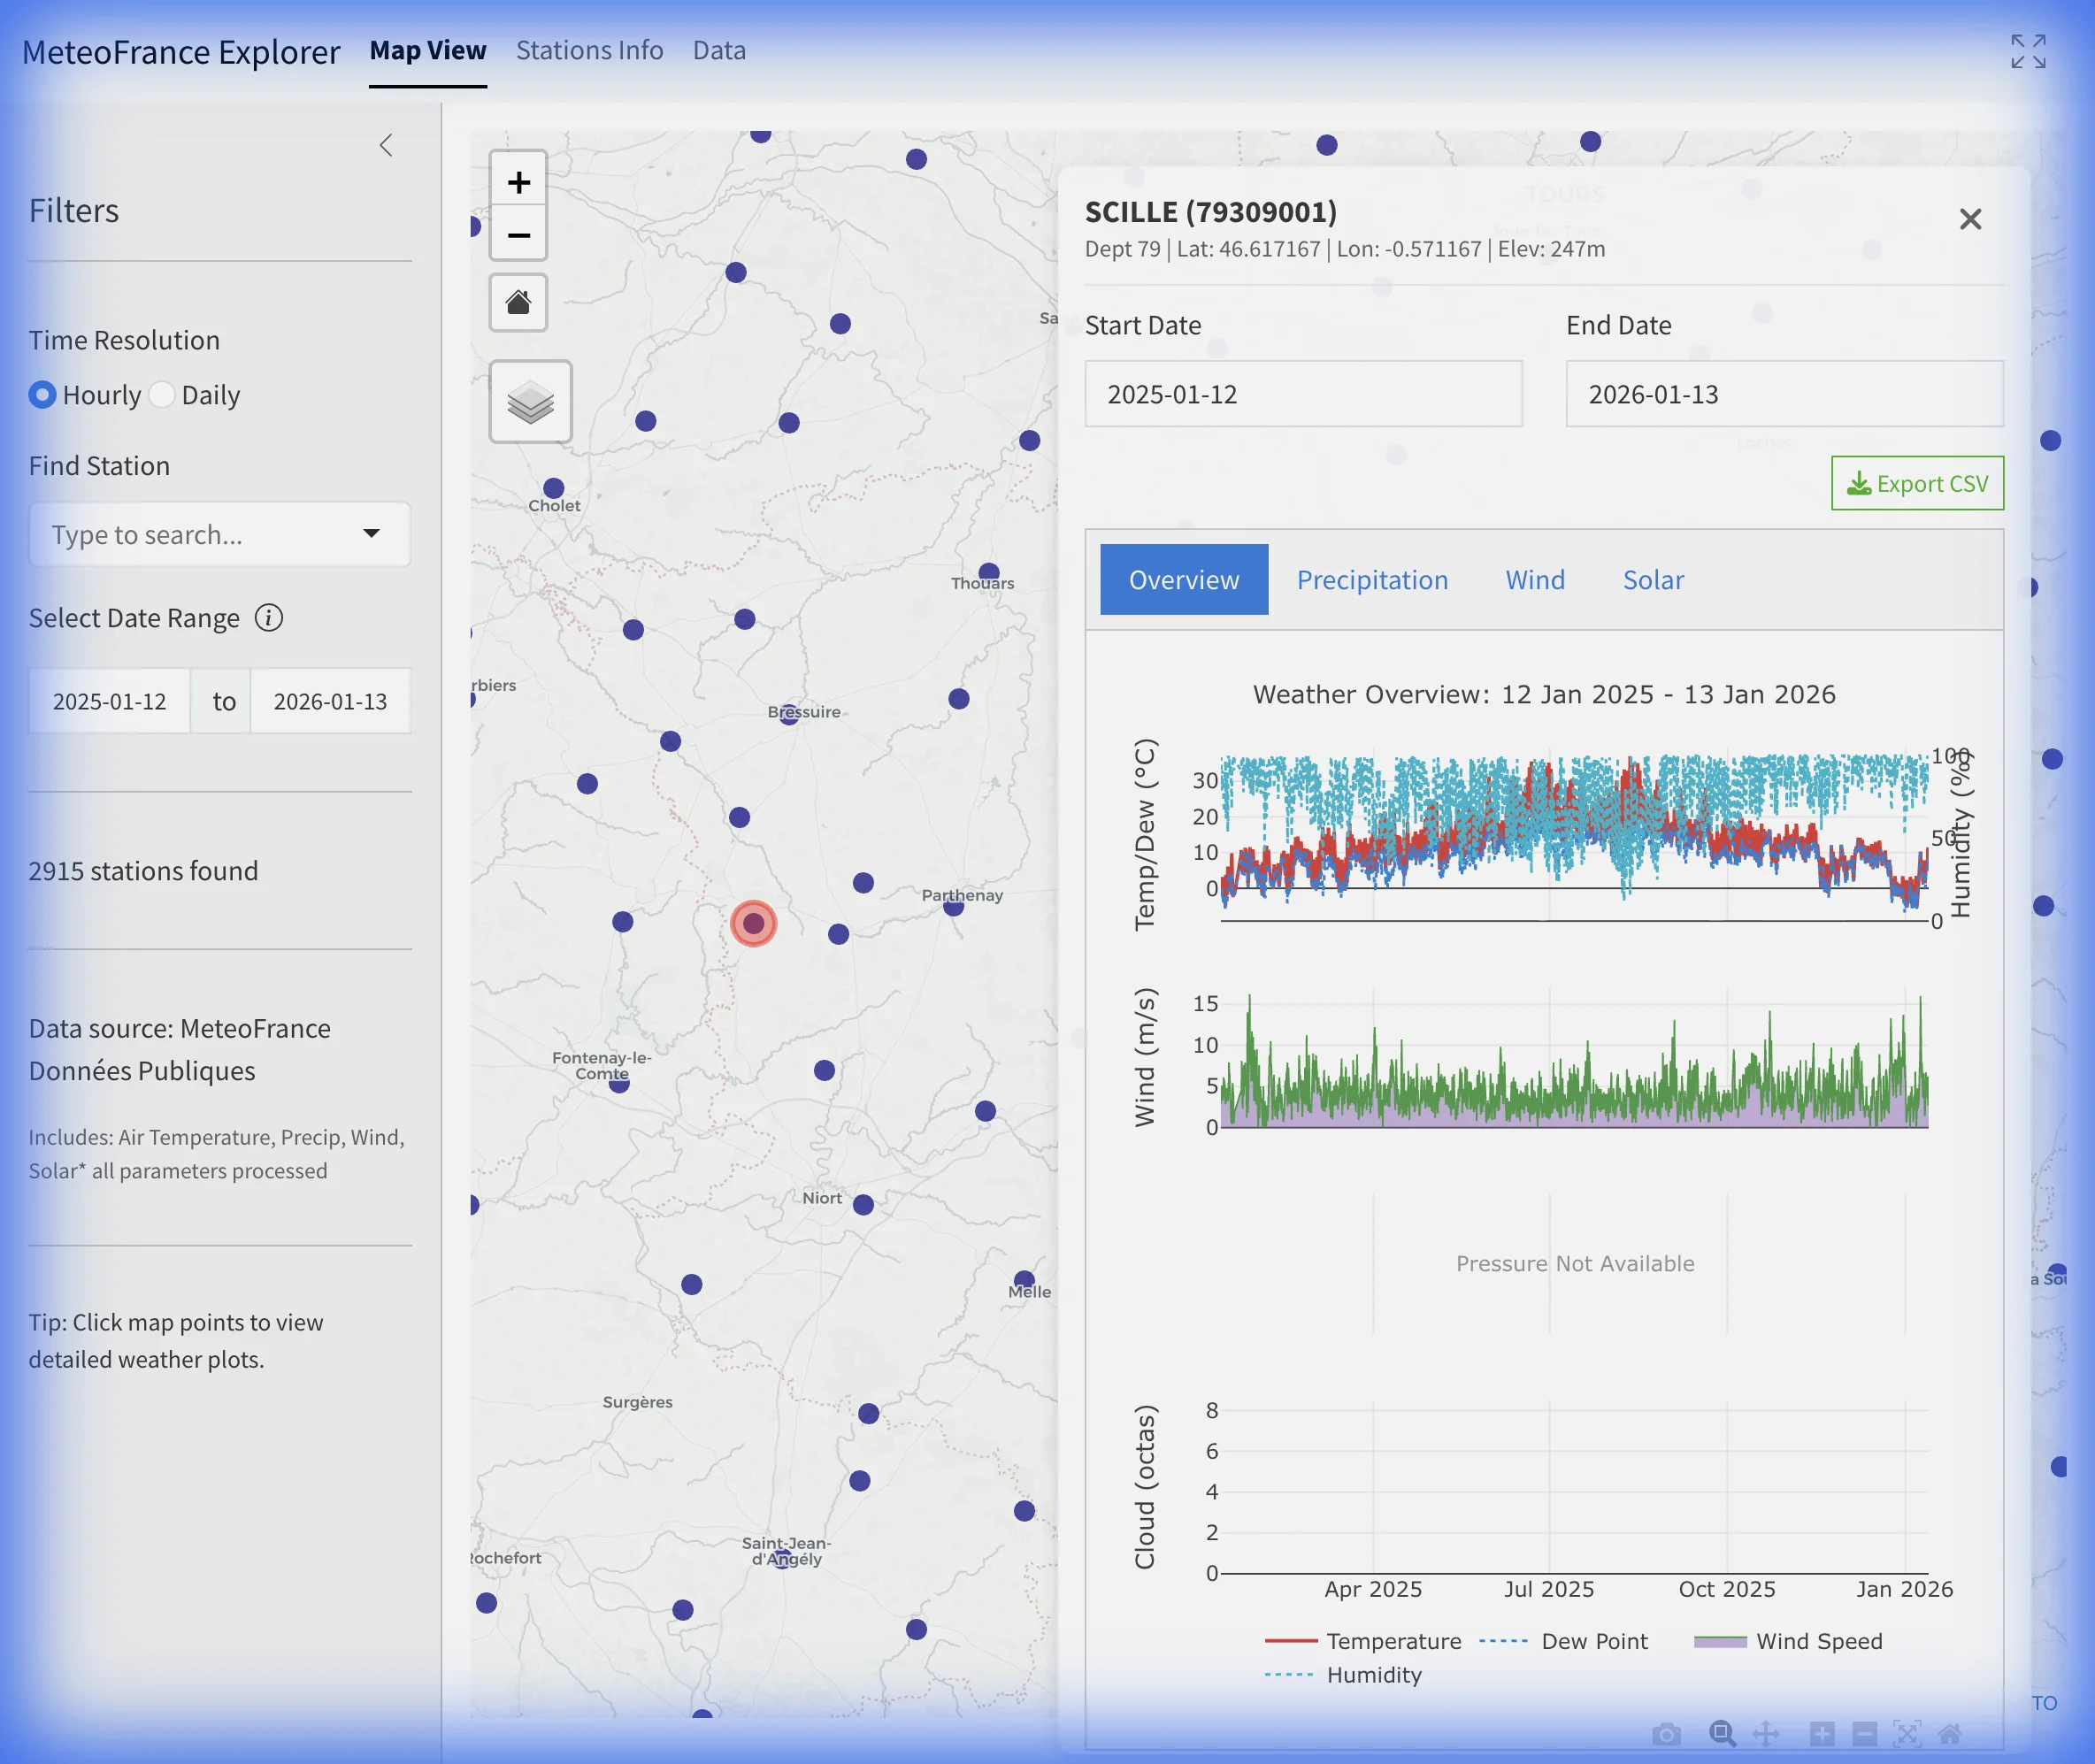
In this example, Lyon–Saint-Exupéry is loaded in Daily mode. The request ended on 28 August 2026, while the dashboard reports data through 26 August; this distinction prevents a requested end date from being mistaken for the latest available observation.
Summary cards describe the loaded selection. They are not climate normals, and their minimum, maximum, mean or total values change whenever the station, resolution or date window changes.
5. Read the plots as station observations
The Plots tab builds panels only for parameter groups that contain data in the selected period. Depending on station and resolution, these can include temperature, humidity or dew point, precipitation, wind, pressure, snow, radiation, sunshine, cloud or ground-temperature information.
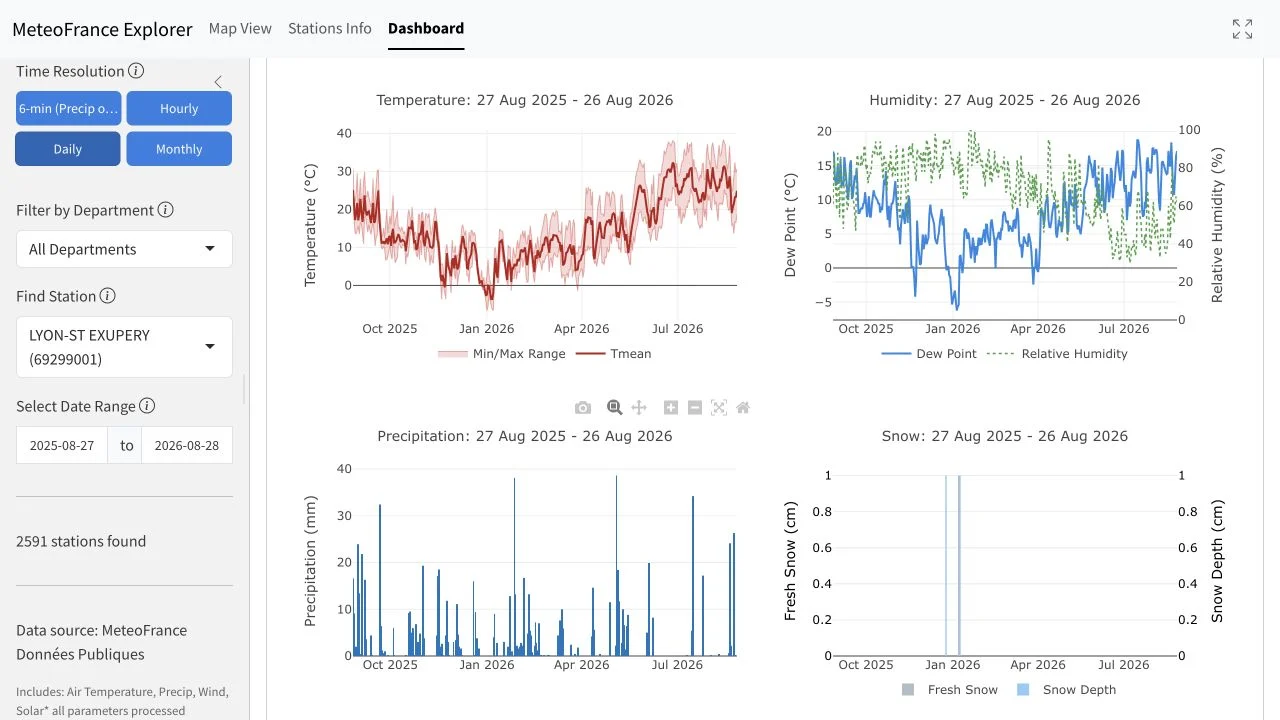
This scrolled view keeps the axes, units, legends and full selected period readable instead of shrinking the dashboard header and charts into one tall image.
Use the chart toolbar for zooming, but remember that visual zoom does not change the loaded table or workbook. To change the exported period, update the sidebar date range and wait for the dashboard to reload.
6. Inspect the data before exporting
Open Data to see which parameter families were available and which expected fields had no values in the selected period. The table retains source-oriented abbreviations in its column labels—for example TM, TN, TX, RR, FFM, DXY, FXY and PMERM—alongside plain-English descriptions and units.
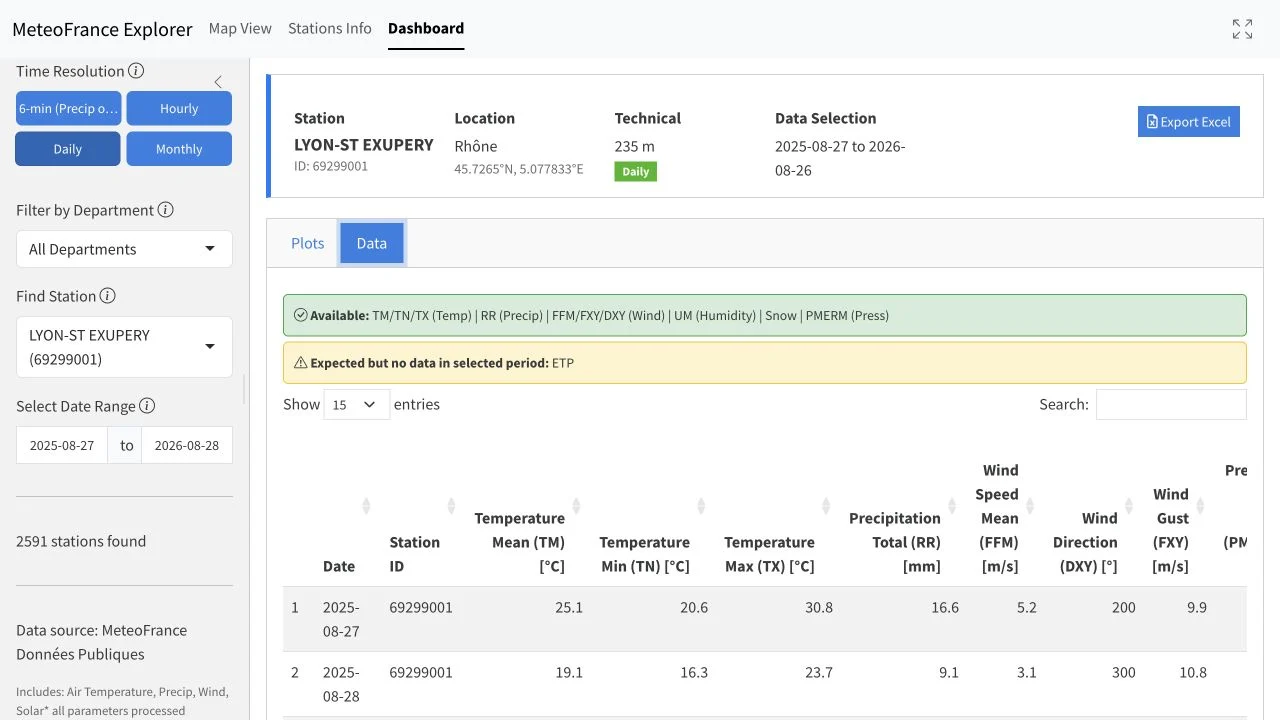
The loaded Daily table shows real rows before export. Blank cells mean that a value was not available for that row; they should not be converted to zero.
6-minute fields
| Explorer label | Source code | Typical unit | Interpretation |
|---|---|---|---|
Precipitation (RR1) [mm] |
RR1 |
mm | Precipitation value published in the 6-minute product. Retain the code and unit, and consult the documentation attached to the official dataset for its precise accumulation definition. |
The official 6-minute archive begins no earlier than July 2005. Availability still varies by station and period.
Hourly fields
| Explorer label | Source code(s) | Typical unit | Interpretation |
|---|---|---|---|
| Air temperature, minimum and maximum | T, TN, TX |
°C | Instantaneous or source-period temperature fields, according to the official heading |
| Relative humidity | U |
% | Relative humidity for the reported time |
| Precipitation | RR1 |
mm | Source-defined precipitation amount; verify the official field documentation before aggregating |
| Mean wind, direction and gust | FF, DD, FXI |
m/s, degrees | Wind speed, direction and maximum instantaneous gust where supplied |
| Mean sea-level and station pressure | PMERM/PMER, PSTAT |
hPa | Sea-level-reduced pressure and pressure at station elevation are different quantities |
| Total cloud cover and cloud details | N, cloud-base/type fields |
okta, m or code | Total cover, cloud base and cloud-type codes can appear as separate columns |
| Global, diffuse, direct and infrared radiation | GLO, source radiation fields |
J/cm² | Radiation-energy fields; preserve their source code and interval |
| Sunshine duration | INS |
min | Sunshine duration for the source interval |
| Visibility and weather phenomena | VV, weather-code fields |
m or code | Visibility and coded present-weather information where available |
| Soil temperature | source depth-specific fields | °C | Ground temperature at the depth named in the column |
Daily fields
| Explorer label | Source code(s) | Typical unit | Interpretation |
|---|---|---|---|
Temperature Mean (TM), minimum and maximum |
TM, TN, TX |
°C | Provider-supplied daily temperature statistics |
Precip Total (RR) |
RR |
mm | Daily precipitation total |
| Mean wind, direction and maximum gust | FFM, DXY, FXY |
m/s, degrees | Daily wind statistics and the direction associated with the source field |
| Mean sea-level and station pressure | PMERM, PSTAT |
hPa | Daily pressure reduced to sea level versus pressure at station elevation |
| Cloud cover and relative humidity | N, UM, UN, UX |
okta, % | Daily cloud cover plus mean, minimum or maximum humidity where supplied |
| Fresh snow and total snow depth | HNEIGEF, NEIGETOT |
cm | New snowfall and snow lying are distinct quantities |
| Sunshine duration | INST |
min | Daily sunshine-duration total |
| Potential evapotranspiration and minimum visibility | ETP, VISIMIN |
mm, m | Provider-supplied daily hydrological and visibility summaries |
| Ground temperature | TNSOL, TN50 |
°C | Minimum ground-temperature fields at the documented level or depth |
| Diffuse, direct and infrared radiation | DIFT, DIRT, INFRART |
J/cm² | Daily radiation-energy totals by component |
| Fog, thunder, sleet, hail, frost, dew, glaze, mist, smoke and lightning | source indicator fields | indicator | Provider weather-event flags, not measured amounts or duration |
Monthly fields
| Explorer label | Source code(s) | Typical unit | Interpretation |
|---|---|---|---|
| Mean, minimum and maximum temperature | TM, TN, TX |
°C | Monthly temperature statistics |
| Absolute minimum and maximum temperature | TNAB/TNN, TXAB/TXX |
°C | Lowest and highest values reported for the month |
| Precipitation total | RR |
mm | Monthly precipitation total |
| Mean wind and maximum gust | FFM, FXY |
m/s | Monthly wind summaries where supplied |
| Mean sea-level pressure, cloud cover and humidity | PMERM, N, UM |
hPa, okta, % | Monthly mean atmospheric fields |
| Sunshine, snow, evapotranspiration, visibility and UV | source monthly fields | h or min, cm, mm, m, index | Conditional monthly summaries; read the displayed unit for the selected product |
| Frost, ice, thunder, fog and snow days | source count fields | days | Counts of days meeting the source definition |
| Rain days at 1, 5 and 10 mm thresholds | source count fields | days | Threshold counts, not precipitation totals |
| Warm-day and tropical-night counts | source count fields | days | Counts based on the provider’s temperature thresholds, including 25 °C, 30 °C and 20 °C fields where present |
The explorer shows only fields parsed from the selected source product. A workbook can therefore contain additional columns beyond these principal groups, while another station can omit many of them. For exact source codes, units, threshold definitions and missing-value conventions, use the documentation attached to each official data.gouv.fr dataset.
7. Export Excel from the dashboard
Select Export Excel in the station header after the load completes. The downloaded .xlsx workbook contains the complete parsed station table for the loaded resolution and date selection—not only the visible page of rows and not only the portion currently zoomed in a plot.
The workbook uses harmonized columns such as datetime, station_id, temp, temp_min, temp_max, precip, wind_speed, wind_dir and pressure_sea when those values are available. Keep the station ID, resolution, requested dates and actual loaded dates with any analysis so another reader can reproduce the selection.
The sidebar can request a period later than the latest published source row. Use the dashboard’s Data Selection dates and the final table row to record the actual data cutoff.
8. Download official bulk CSV files
For automated or department-scale work, use the source datasets directly:
- 6-minute precipitation
- Hourly climatological observations
- Daily climatological observations
- Monthly climatological observations
Météo-France organizes the principal files by department and period as compressed CSV resources. Choose the resolution, identify the station’s department, select the period batch that overlaps your dates, then filter the file by station ID.
Reproduce the Lyon example
- Record station
69299001, Lyon–Saint-Exupéry, department69(Rhône). - Choose the daily dataset.
- Locate the department
69resource whose period overlaps your dates. - Download and decompress the CSV file.
- Filter
NUM_POSTEto69299001and preserve the provider documentation with your output.
The official files are the preferred source when you need every original column, the provider’s raw naming, batch-level provenance or a workflow independent of Climate Explorer.
9. Time basis, monthly labels and revisions
- Metropolitan files: Météo-France documents times in UTC.
- Overseas files: The provider documents times in local legal time (
FU). Check this before combining locations. - Monthly rows: Climate Explorer converts
AAAAMMto the first day of that month at00:00as a table label. It does not mean an observation occurred at that instant. - Open months: If a current monthly row is present before month-end, treat it as provisional or incomplete until the provider’s closed period is confirmed.
- Revisions: Recent source files can change after quality control or republication. Record the download date when results depend on recent observations.
10. Troubleshooting
- No station appears
-
Clear the department filter, widen the date range, or try a different resolution. A station must overlap the requested period and advertise the selected resolution in the explorer metadata.
- The dashboard remains empty
-
Re-select the station and wait for the loading state to finish. Large source files may take time to download and parse.
- A chart or field is missing
-
The selected station may not provide that parameter at that resolution, or the loaded period may contain only missing values.
- The exported file is not CSV
-
The dashboard action is Export Excel and creates
.xlsx. Use the official data.gouv.fr resources for compressed source CSV files. - The monthly date looks like a daily timestamp
-
Read it as a month label. For example,
2026-03-01 00:00represents March 2026 in the explorer table.