Two Heat Surges at French Stations: June to Early July 2026
Daily station records for June 1–July 11, 2026, rechecked against Météo-France files on September 13.
The temperature did not peak on the same date at every French station during the June and early-July heat. Brive reached 43.0°C on June 22, while Perpignan’s highest value in this comparison was 40.9°C on July 9. A single national peak date would hide that difference.
The daily records below follow Brive, Toulouse-Blagnac and Perpignan from June 1 through July 11, 2026. Each has all 41 dates. This is a fixed historical window, not a summary of the whole of July or a current heat or fire warning. The three stations show different local timings; they are not weighted by area or population and do not represent a French national average.
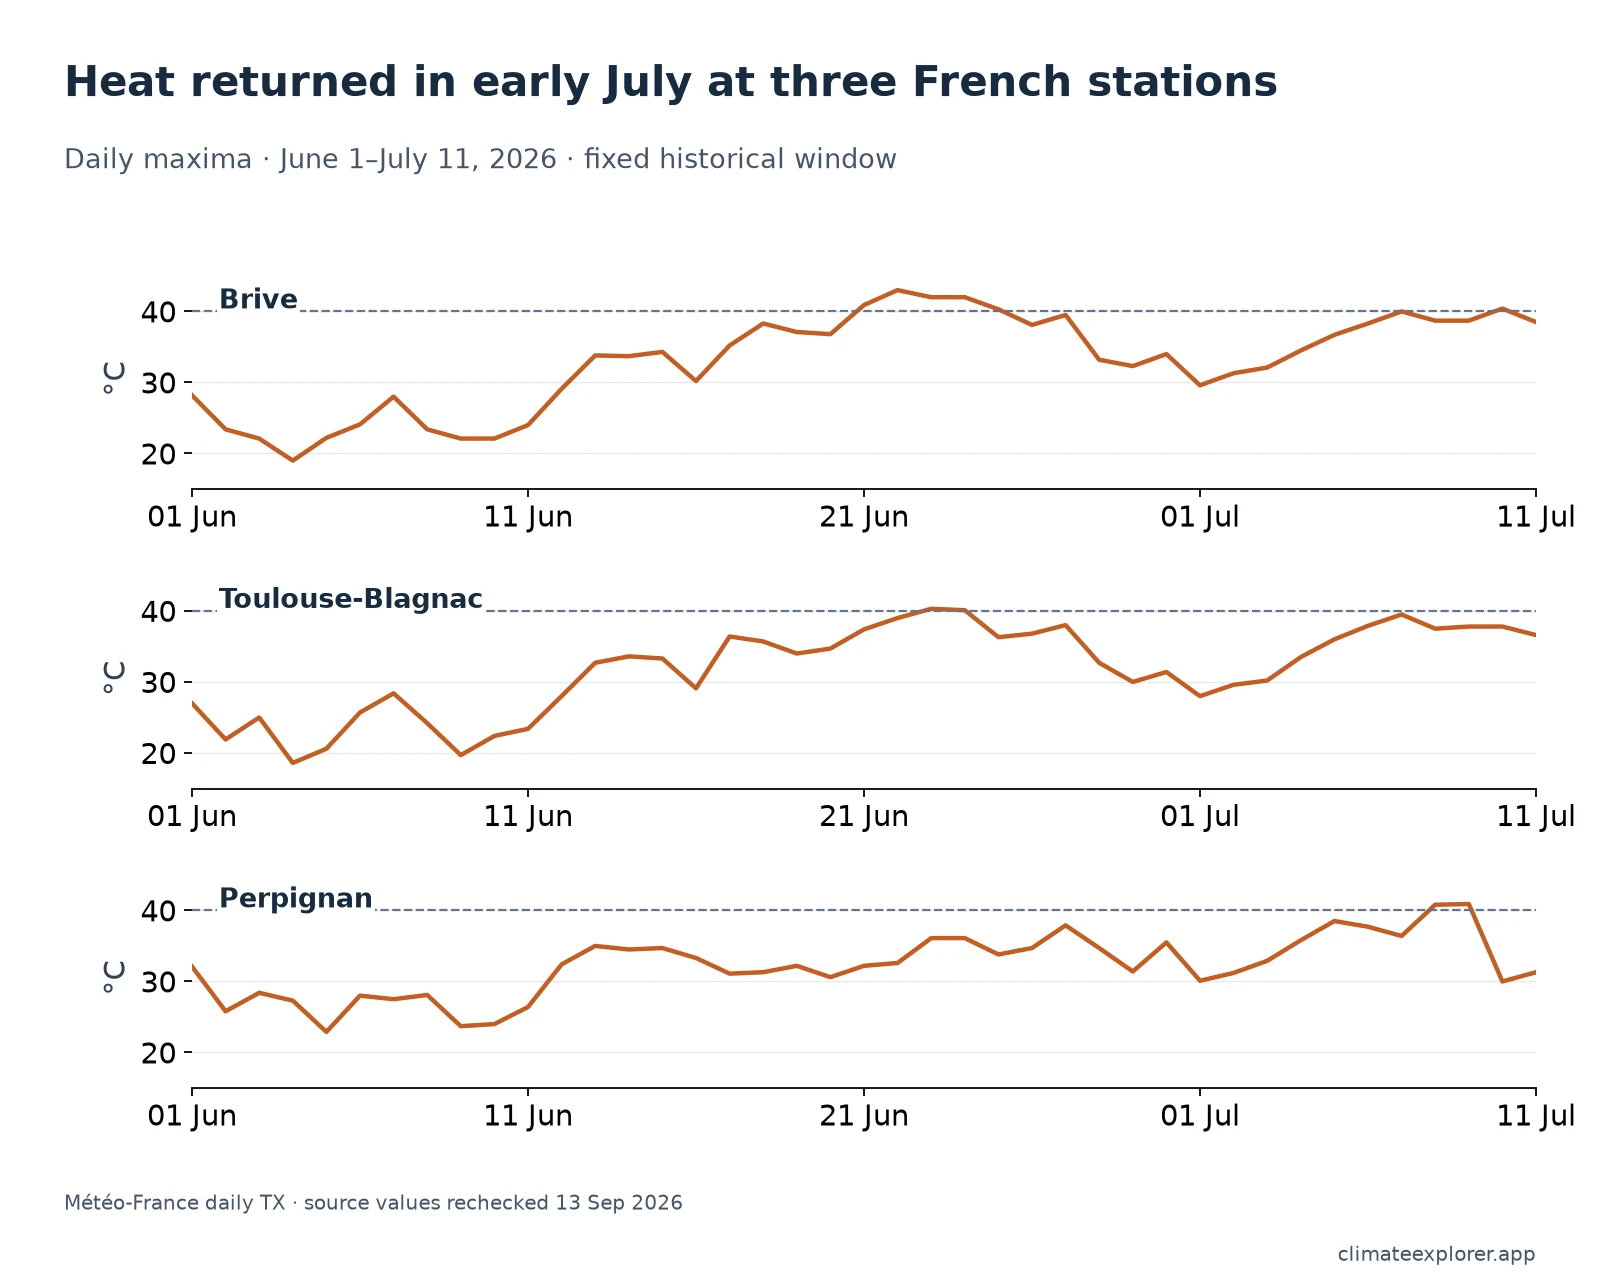
Brive and Toulouse peaked in June
At Brive, Météo-France station 19031008, the June 22 maximum reached 43.0°C. By July 10 the station was back above 40°C, at 40.4°C. The two rises are separated by cooler days; the chart does not treat the entire six-week period as one uninterrupted heatwave.
At Toulouse-Blagnac, provider station 31069001, the highest maximum in the 41-day window was 40.3°C on June 23. The curve provides a useful comparison with Brive: both had a pronounced June peak, but their daily values and the size of the later rise were different.
The station metadata below includes verified WIGOS IDs—the globally unique station identifiers—alongside the national archive keys. Toulouse-Blagnac is 0-20000-0-07630; Brive is 0-20000-0-07438.
Perpignan’s highest value came later
At Perpignan, provider station 66136001, WIGOS 0-20000-0-07747, the July 9 maximum of 40.9°C exceeded its own June maximum in this extract. This is a within-station comparison over the stated dates. It is not a claim about Perpignan’s full historical record.
The different timing is the reason to keep separate station panels. Averaging the three curves could smooth away a locally important peak, while reporting only the highest number would leave out the return of heat elsewhere.
What this window can answer
The series establishes when these three stations warmed and cooled, and how their reported daily maxima compared. It does not establish national heatwave boundaries, wildfire causes or damage. Fire conditions require additional evidence about wind, fuel moisture, ignition and the incident itself.
The Météo-France Explorer lets you inspect each station and extend the dates beyond July 11. The daily-data guide explains how to choose the correct provider station and export its observations. To reproduce this exact figure, use the 123-row extract; changing the end date changes the question.
Conclusion
Tracking Brive, Toulouse-Blagnac and Perpignan across a fixed 41-day window reveals how successive pulses of heat affected different French regions at different times. Inland southwestern stations peaked during the late-June surge—reaching 43.0°C at Brive and 40.3°C at Toulouse—before experiencing secondary peaks in early July. In contrast, coastal Mediterranean Perpignan recorded its highest value (40.9°C) during the second surge on 9 July. Evaluating stations individually preserves this geographic decoupling, which aggregated national averages often obscure, while avoiding unsupported generalizations about nationwide heatwave duration or wildfire causation.
Editor’s note: Data current as of July 11, 2026. Daily observations were rechecked against official Météo-France departmental open-data archives on September 13, 2026. Earlier dated forecasts and secondary incident references have been removed to preserve a strict observational focus.
Data Annex
| Station | Météo-France ID | WIGOS ID | Latitude | Longitude | Elevation |
|---|---|---|---|---|---|
| Brive | 19031008 | 0-20000-0-07438 | 45.1467° N | 1.4733° E | 115 m |
| Toulouse-Blagnac | 31069001 | 0-20000-0-07630 | 43.6210° N | 1.3788° E | 151 m |
| Perpignan | 66136001 | 0-20000-0-07747 | 42.7372° N | 2.8728° E | 42 m |
| Station | Comparison period | Daily records | Highest TX (°C) | Date |
|---|---|---|---|---|
| Brive | June 1–30 | 30 | 43.0 | 2026-06-22 |
| Brive | July 1–11 | 11 | 40.4 | 2026-07-10 |
| Toulouse-Blagnac | June 1–30 | 30 | 40.3 | 2026-06-23 |
| Toulouse-Blagnac | July 1–11 | 11 | 39.5 | 2026-07-07 |
| Perpignan | June 1–30 | 30 | 37.9 | 2026-06-27 |
| Perpignan | July 1–11 | 11 | 40.9 | 2026-07-09 |
The source extract was assembled from Météo-France’s daily rr-t-vent resources. The chart uses the provider’s TX daily maximum and date, rather than reconstructing maxima from hourly temperatures. The download also retains TN for readers checking the original extract. All 123 station-date pairs are unique; no missing value was filled. The minimum and maximum temperatures all matched a fresh download of the three departmental files on September 13, 2026. Subsequent provider revisions remain possible.
Data Sources
- Météo-France daily climate dataset: departmental daily observations and provider field documentation.
- Météo-France open-data portal: source catalog and station-data access.