NOAA GHCNh Guide: US, Canada & Global Hourly Weather Data
Open the interactive GHCNh station explorer
Quick start
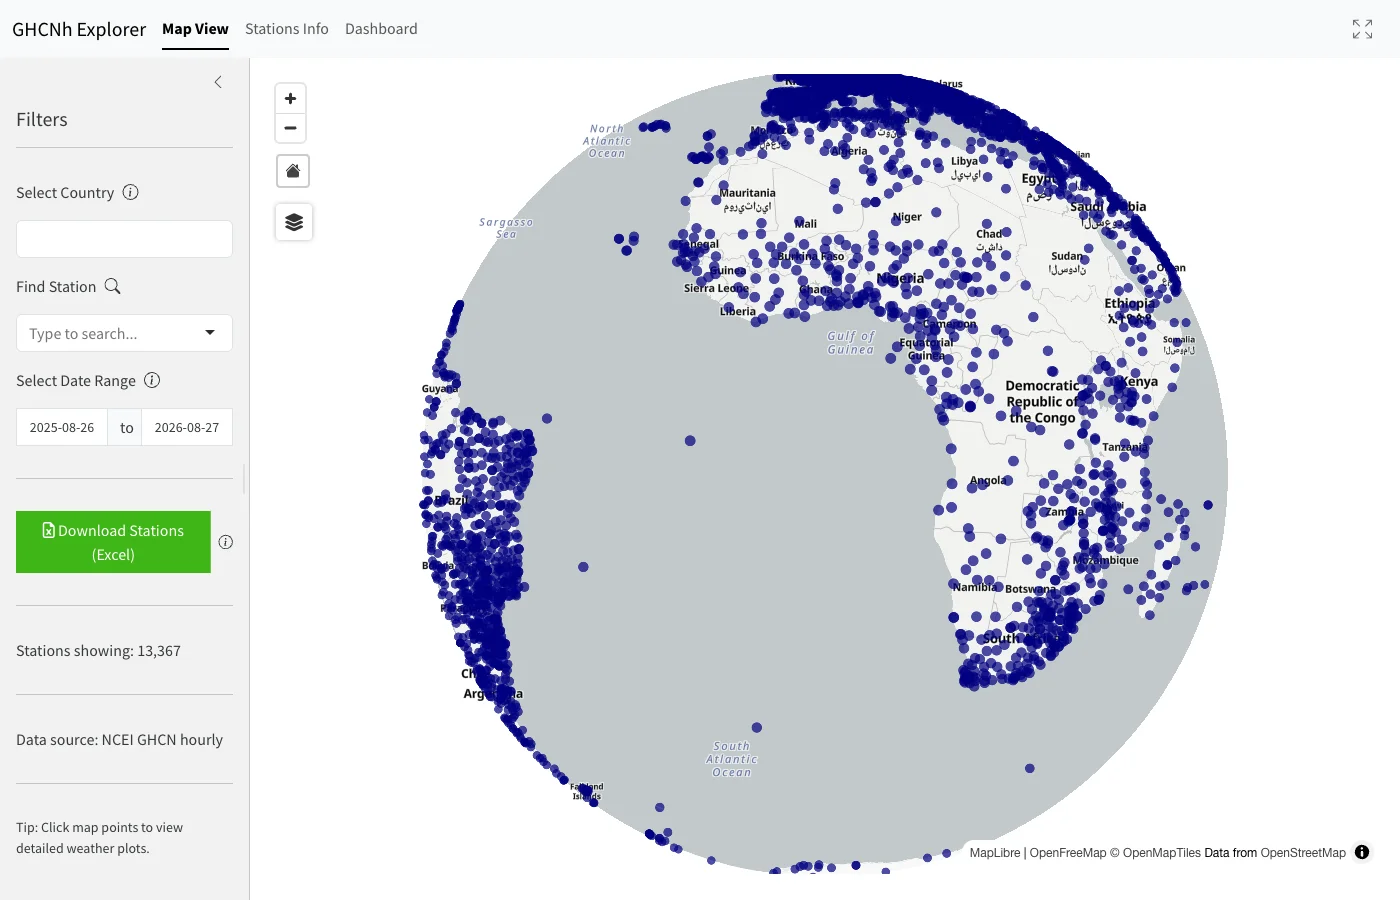
- Choose a country (such as United States or Canada), then select a station by map marker, the Find Station search (station name or GHCN ID), or double-clicking its row in Stations Info.
- Set a UTC date range of no more than 366 days.
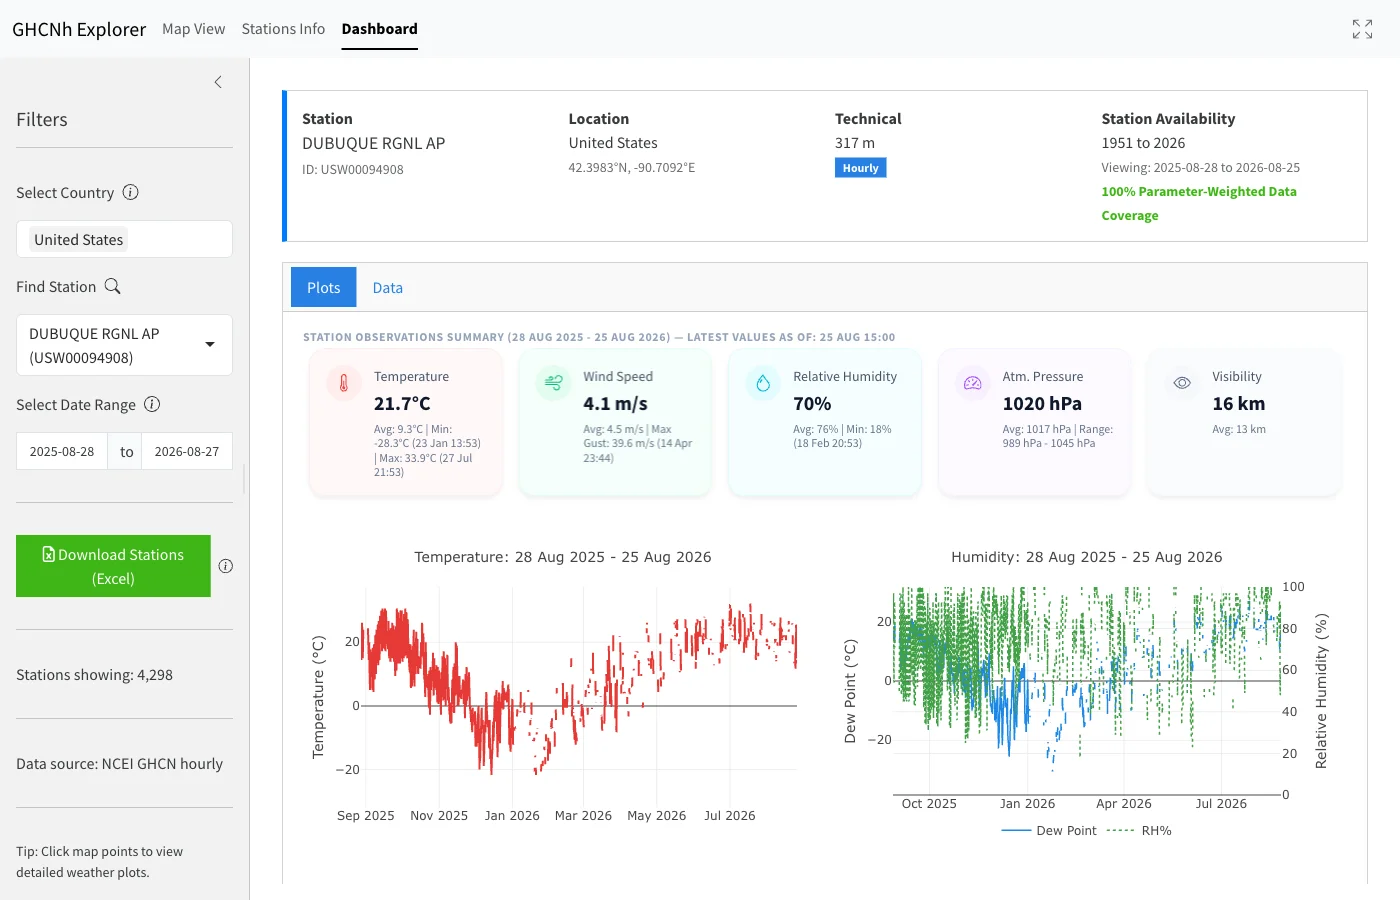
- Use Dashboard → Plots to check timing, gaps and which parameters are actually available.
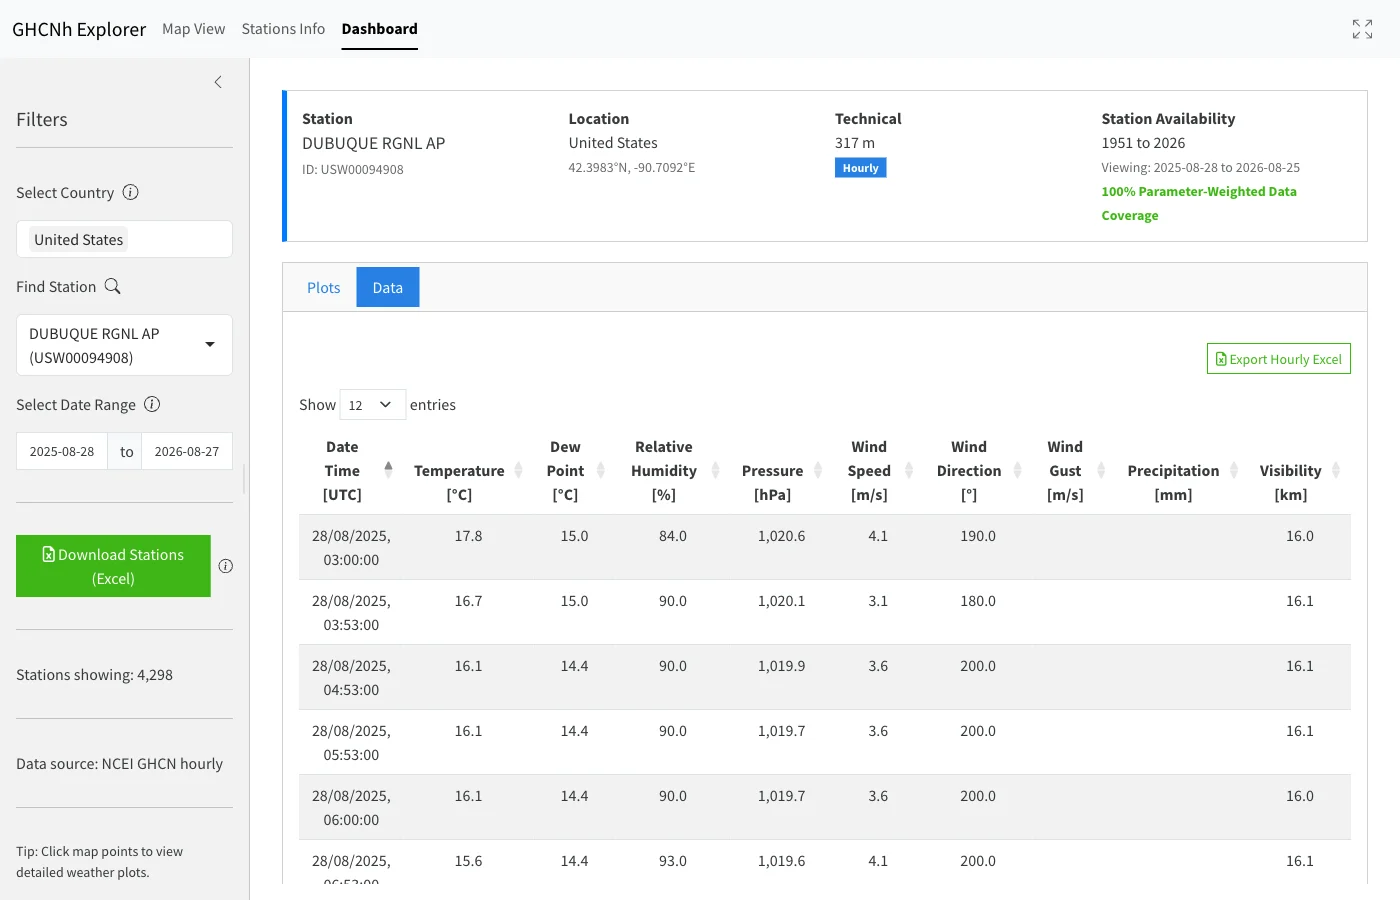
- Open Dashboard → Data to inspect the core hourly fields and select Export Hourly Excel.
- Keep the station ID, UTC interval and download date with your analysis. Use NOAA’s PSV or Parquet files when you need original source codes or bulk access.
What this guide helps you do
The GHCNh Explorer presents NOAA/NCEI Global Historical Climatology Network hourly and synoptic observations from fixed land stations across US states (including Alaska and Hawaii), US territories, Canadian provinces and territories, and worldwide networks. It is designed for meteorological, climate, and environmental researchers conducting sub-daily weather analysis, diurnal temperature range studies, overnight heatwave investigations, storm front tracking, and multi-decade station time series processing.
This page owns the practical workflow: station selection, North American identifier cross-referencing, interpretation, quality checks, and export options. For broad browsing, use the interactive GHCNh Explorer. For an evidence-led example of what hourly data can reveal, read the Dubuque nighttime-heat analysis.
Select a station and time window
- Select Country narrows the station network to specific jurisdictions (e.g. United States or Canada) without implying that every station has identical variables or record length.
- Find Station searches the catalog by station name or 11-character GHCN identifier (
USW00094908). USUSW000GHCN IDs embed the 5-digit WBAN number (94908), so typing it can also match; Canadian and other IDs do not follow this pattern. ICAO and WMO codes appear only in NOAA’s source station list, not as search fields. - Map View selects a station spatially; Stations Info is better when similar names or nearby airport/urban stations need to be distinguished.
- Select Date Range uses UTC and is limited to 366 days. Move the window to inspect another year rather than combining unrelated periods.
- Download Stations (Excel) exports the station inventory currently visible under the country and map filters; it does not export observations.
- Full Screen View: Click the Maximize / Full Screen button in the top-right corner of the explorer window to expand the dashboard to full display size. This is recommended when inspecting complex multi-panel charts, high-density station maps, or large data tables. Press
Escor click the icon again to exit.
A place name is not a unique station key. Record the GHCN identifier, coordinates, elevation, and period of record shown in the dashboard header. Airport, urban, and elevated sites can describe different microclimates even when their names share the same metropolitan region.
Read the current dashboard correctly
After a station loads, Plots shows only panels supported by the selected records. Depending on availability, these may include temperature and dew point, relative humidity, wind and gusts, sea-level or station pressure, visibility, precipitation accumulations and a wind rose. Missing panels usually mean that the parameter is absent for that station and period—not that the weather phenomenon did not occur.
The summary cards describe the selected window. They are not climatological normals, official records or a guarantee of 24 observations per day. Check the timestamps and gaps before calculating extremes or durations.
Data displays the core parsed hourly fields and provides the current Export Hourly Excel control. The application does not currently provide a separate daily-data table or daily export.
GHCNh column dictionary and data fields
The table on screen focuses on a small set of parsed variables. The downloaded workbook contains the parsed records for the selected interval and may include additional raw, measurement, quality and source fields used by the application.
| Explorer field | Meaning | Unit or time basis |
|---|---|---|
datetime |
Observation timestamp | UTC |
temp |
Near-surface dry-bulb air temperature | °C |
dew_point |
Dew-point temperature | °C |
rh |
Reported or source-derived relative humidity | % |
pressure |
Sea-level pressure | hPa |
wind_speed, wind_gust |
Sustained wind and peak short-duration gust | m/s |
wind_dir |
Direction from true north; calm reports may use 0 | degrees |
precip |
Nominal hourly liquid-equivalent precipitation; intermediate reports can occur | mm |
vis |
Horizontal visibility | km |
| Field group | Safe interpretation |
|---|---|
precip_3h … precip_24h |
Separate liquid-equivalent accumulation totals ending at their report time; do not add overlapping intervals together |
*_code in the Explorer export; *_Measurement_Code in NOAA PSV |
Describes how a value was reported, such as trace or accumulated-period status; meanings can depend on source |
*_qc in the Explorer export; *_Quality_Code in NOAA PSV |
Records integrated or legacy QC information; code meanings are source-dependent |
*_source and *_report_type aliases |
Identify the contributing stream and report type needed to interpret measurement and QC codes |
| raw and parsed value pairs | Preserve the source value alongside the application-ready numeric value; use the raw NOAA row for audit-sensitive work |
Reconcile multi-hour precipitation
GHCNh can carry precipitation totals over 3, 6, 9, 12, 15, 18, 21 and 24 hours. These columns are alternative accumulation periods, not independent hourly buckets.
Use this workflow:
- Choose one accumulation duration that matches the question—for example,
precip_6hfor reported six-hour totals. - Treat the timestamp as the end of that reported accumulation unless the source documentation indicates otherwise.
- Do not sum a 3-hour and a 6-hour value reported at the same time; their periods may overlap.
- Inspect the associated measurement, quality, report-type and source fields in the NOAA PSV when completeness or trace handling matters.
- Do not construct a daily total by mixing durations. Prefer an official daily product such as SSOD when the task is a daily meteorological summary.
NOAA documents precipitation as nominally hourly, but it can include intermediate reports. Multi-hour fields from FM12/SYNOP reports are explicitly accumulation totals. A blank accumulation is missing or unavailable information, not zero precipitation.
Calculate dew-point depression
Dew-point depression is the air temperature minus the dew point at the same timestamp:
\[D = T - T_d\]
Both inputs must use the same temperature unit. In the Excel export, create a new column with a formula equivalent to temp - dew_point. A smaller non-negative difference generally indicates air closer to saturation; it does not by itself prove fog, cloud, precipitation or a heat hazard.
Before using the calculation:
- keep only rows where both
tempanddew_pointare present; - do not pair values from different timestamps;
- retain the original fields and QC/source columns;
- investigate any negative result rather than automatically converting it to zero.
Apply quality checks without misreading flags
GHCNh combines many contributing sources. NOAA applies general checks to a subset of variables and preserves quality information inherited from component sources. Therefore, the same code can have different meaning under different source codes.
The Explorer masks documented bad codes for several core parsed variables, including temperature, dew point, wind, nominal hourly precipitation, pressure, humidity and visibility. This produces cleaner plots, but it is not a guarantee that every retained value is correct or that every parameter received the same QC treatment.
For reproducible filtering:
- retain measurement, quality, source and report-type fields;
- interpret codes using the matching source section in NOAA’s GHCNh documentation;
- distinguish not checked, missing QC code, suspect, erroneous, calculated and derived;
- remember that NOAA’s
9-MissingQC label means no QC code was supplied—it does not automatically mean the observation value is missing; - document every exclusion rule and compare results before and after filtering.
Station inventory download and export options
Choose the access route according to the task:
- Download Stations (Excel) exports the filtered station catalog and coordinates directly from the Explorer.
- Export Hourly Excel exports parsed, quality-checked hourly observations for the selected station and date window.
- Upstream Period-of-Record Files provide full-history pipe-separated value (PSV) files using the pattern
GHCNh_<station-id>_por.psv. - Bulk Single-Year Files provide annual Apache Parquet and PSV files for large-scale programmatic ingestion.
Official NOAA GHCNh resources and direct file links
For raw data auditing, programmatic analysis, or official reference, access NOAA’s direct GHCNh files:
- Documentation & Field Dictionaries:
- Station Inventories & Catalog Lists:
- Period-of-Record Station PSV Files:
- Direct period-of-record PSV file pattern:
https://www.ncei.noaa.gov/oa/global-historical-climatology-network/hourly/access/by-station/GHCNh_<STATION_ID>_por.psv - Examples: Dubuque Regional Airport (USW00094908) POR PSV | Tokyo (JAI0000RJTD) POR PSV
- Direct period-of-record PSV file pattern:
- Annual Chunked Parquet & PSV Files:
- Direct by-year Parquet file pattern:
https://www.ncei.noaa.gov/oa/global-historical-climatology-network/hourly/access/by-year/<YEAR>/parquet/GHCNh_<STATION_ID>_<YEAR>.parquet - Examples: Dubuque 2024 Parquet File | Dubuque 2024 PSV File
- Direct by-year Parquet file pattern:
Reproduce the Dubuque example
Open the Dubuque Regional Airport hourly view. Confirm station USW00094908, keep the interval at 29 June–1 July 2026, inspect temperature and dew point in Plots, then export the hourly workbook from Data.
The related article uses one valid temperature-and-dew-point report per local clock hour for threshold counts. That editorial analysis is not the Explorer’s default aggregation and is documented separately in the Dubuque nighttime-heat evidence story.
Troubleshooting
- The requested interval will not load
-
Reduce it to 366 days or less.
- The station has no plot for a parameter
-
Try another interval and verify the station inventory; coverage varies by source, sensor and era.
- The station list changed after moving the map
-
The station download follows the active country and visible-map filters.
- The export is not CSV
-
The current interface exports
.xlsx; use NOAA’s PSV or Parquet access for text or columnar source formats. - An accumulation looks too large
-
Check its duration and ending timestamp before comparing it with an hourly value.
- You need an official daily value or record
-
Use the responsible national service or NOAA daily product and its day definition; do not infer an official daily record from a selected hourly window.