Tracking the June 2026 European Heatwave with EuroMeteo Real-Time Data
In the third week of June 2026, a persistent upper-level ridge — commonly called an Omega block because of its shape on weather charts — locked a dome of extremely hot air over Western Europe. Temperatures in parts of France exceeded 43°C, making it the hottest June day in the country’s recorded history. Within days, the heat shifted eastward into Germany, the Benelux, and Poland, where stations approached or exceeded 40°C.
Red alerts were issued across more than a dozen countries. Rail services were disrupted, schools were closed, and scientists at the World Weather Attribution initiative stated that conditions of this intensity would have been virtually impossible without the influence of human-caused climate change.
This article shows how to use the EuroMeteo Explorer to track a cross-border heatwave like this one in near real-time, using the actual data flowing through the MeteoGate platform. If you want to understand the infrastructure behind that platform, the companion article EuroMeteo: Real-Time European Weather Data Explained covers the technical background.
What Made This Heatwave Exceptional
European heatwaves are not unusual in late June. What set the June 2026 event apart was its combination of three factors: extreme peak temperatures, persistence over multiple days, and continental scale.
The Omega Block Pattern
The meteorological engine behind the event was a large-amplitude ridge in the upper-level jet stream. When the jet stream buckles into a broad ridge flanked by two troughs, the resulting pressure pattern resembles the Greek letter Ω. Inside the ridge, air sinks, skies clear, and the sun heats the surface without interruption. Because the pattern is dynamically stable, it can persist for days or even weeks, preventing the normal west-to-east progression of weather fronts.
In this case, the Omega block drew Saharan air northward across the Mediterranean and into western Europe, producing temperatures 10–15°C above the 1991–2020 climatological normals. The block then drifted slowly eastward, dragging the thermal plume across the continent.
Tropical Nights
One of the most dangerous characteristics of this event was the lack of nighttime relief. Across large parts of France, Belgium, the Netherlands, and western Germany, minimum temperatures stayed above 20°C — the threshold for what meteorologists call a “tropical night.” Multiple consecutive tropical nights prevent the human body from recovering from daytime heat stress, making this a critical public health signal.
Scale and Duration
The heatwave was not a one-day spike. Stations across Spain and southern France reported extreme temperatures from roughly 21 June, with the heat intensifying and shifting eastward through 26–27 June. By the time temperatures in Poland peaked, western France was already beginning to see some relief from an approaching Atlantic front. This west-to-east propagation is exactly the kind of event that cross-border data is designed to reveal.
Following the Heat West to East: A EuroMeteo Walkthrough
The EuroMeteo Explorer is built on the E-SOH (European Surface Observations HVD) feed from MeteoGate, which provides standardized, near real-time observations from thousands of European stations. Climate Explorer has been archiving this feed since 5 March 2026, which means the full June 2026 heatwave is captured in the available record.
Here is how to use the explorer to trace the heatwave’s path across the continent.
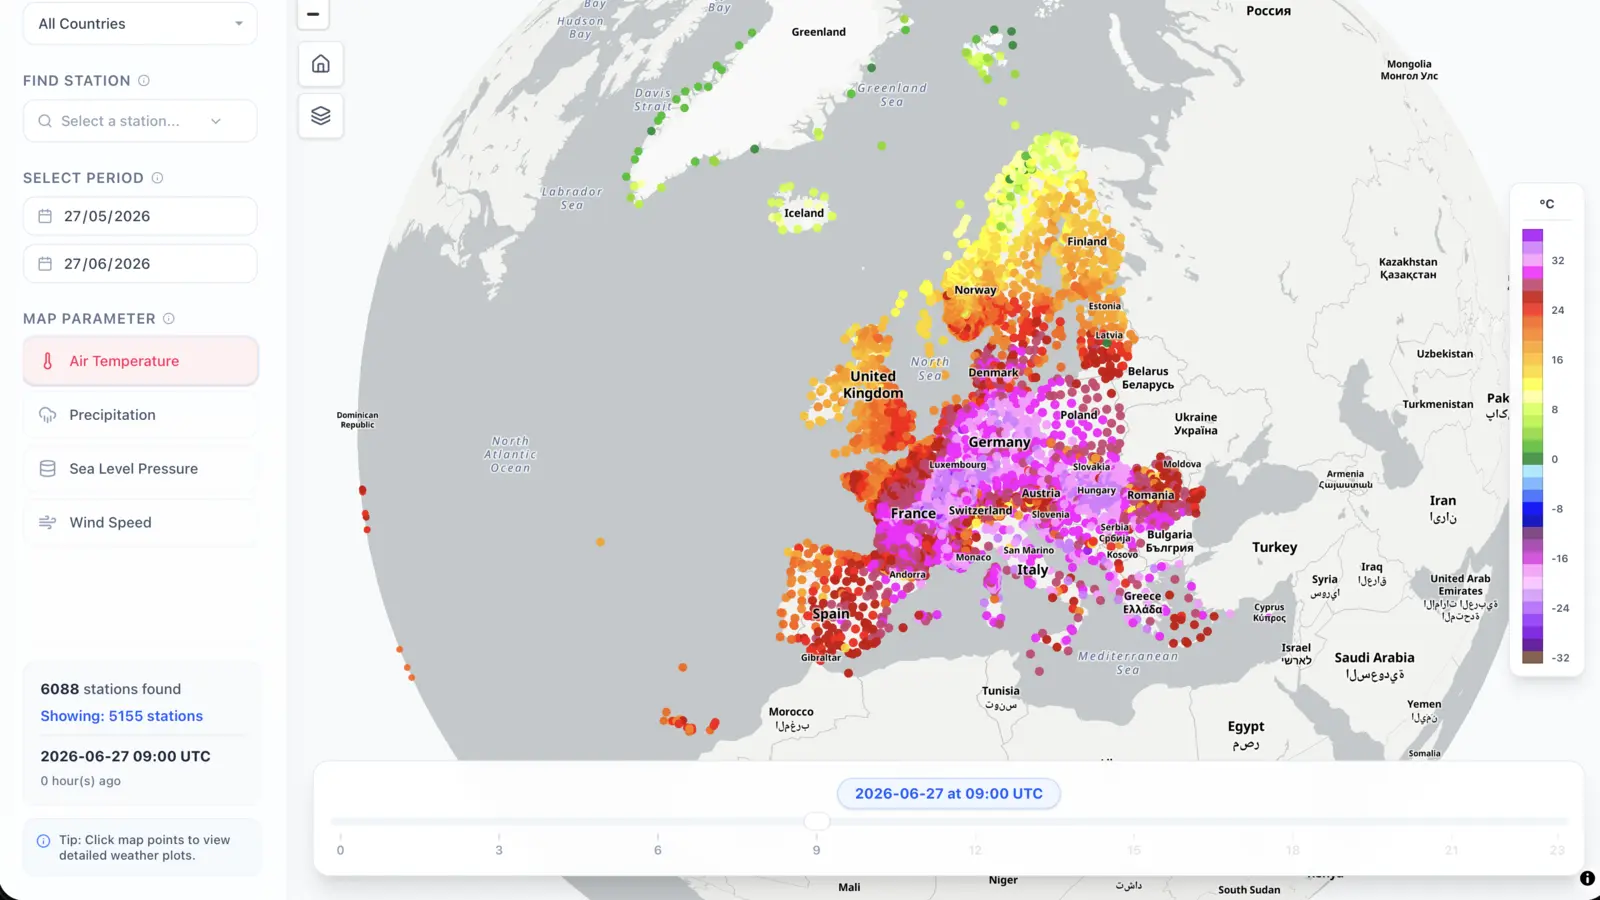
Step 1: Open the Explorer and Set the Date to 22 June
Open the EuroMeteo Explorer and use the time slider at the bottom of the map to navigate to 22 June 2026 at 12:00 UTC. At this point, the heat was already building rapidly across Spain and France.
Look at the temperature layer on the map. Stations across the Iberian peninsula and almost all of France are shown in dark purples and browns, indicating values exceeding 35°C, with many approaching or exceeding 40°C. Meanwhile, stations in eastern Germany and Poland are still reporting seasonally normal values.
This is the first frame of the west-to-east story: the heat has fully engulfed Iberia and France, but central/eastern Europe is not yet deeply affected.
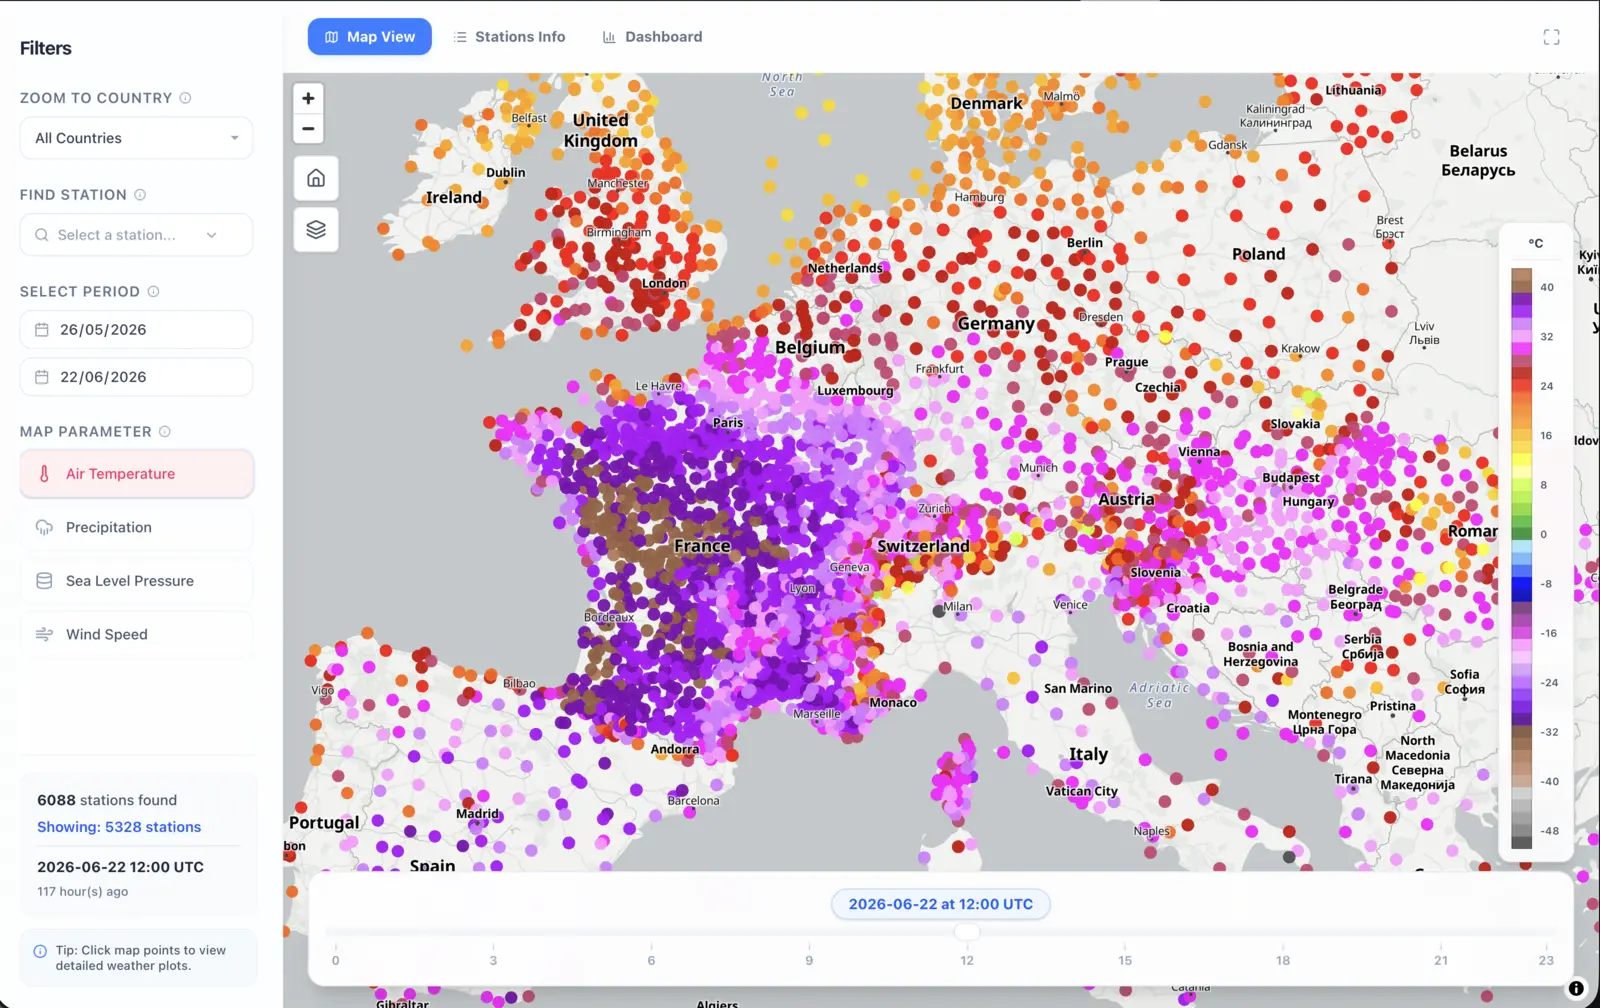
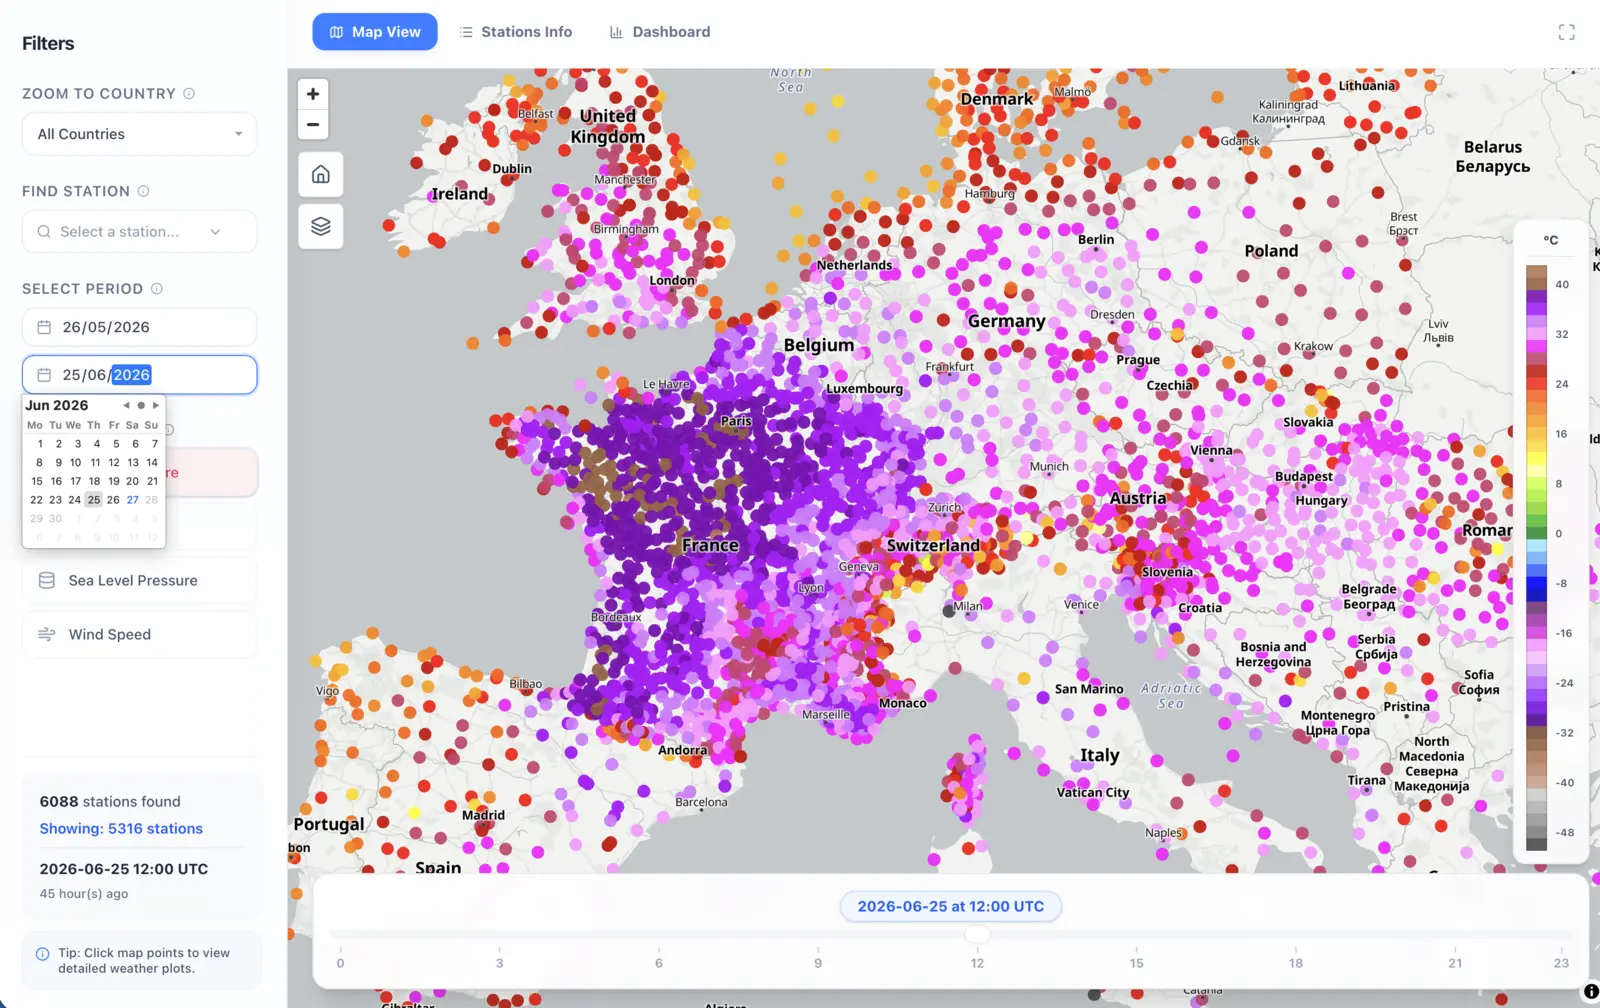
Step 2: Advance to 25 June — Peak in France and the Benelux
Step the time slider forward to 25 June 2026 at 12:00 UTC. This captures the intense heat locked over the region. The Omega block had shifted slightly, pulling the hottest air directly over France, Belgium, and the Netherlands.
In the explorer, you should now see a vast area of brown and dark purple covering the Paris basin, the Loire valley, and stretching into Belgium, indicating widespread temperatures in the 38–43°C range. Compare this with the same stations on the 22nd, and the intensification is dramatic.
At the same time, look eastward: German stations in the Rhineland and the North European Plain are now beginning to warm significantly (shown in pinks and purples), but have not yet reached their absolute peak. The leading edge of the heat plume is crossing the Rhine.
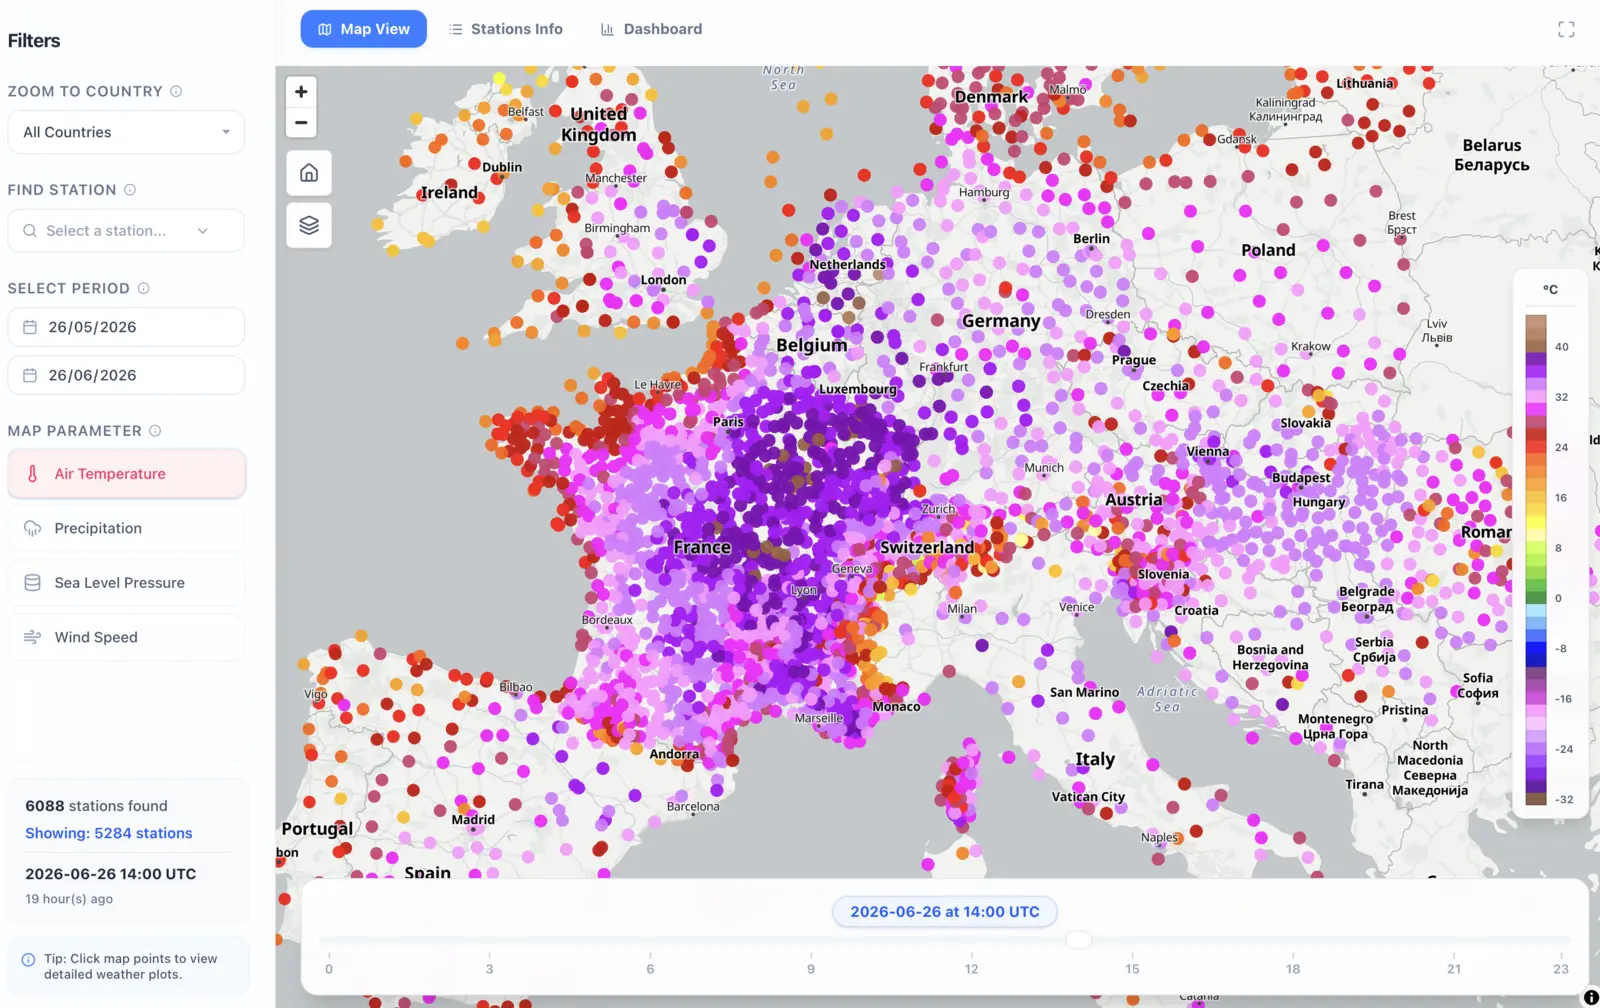
Step 3: Advance to 26 June — The Heat Arrives in Germany and Poland
Move the time slider to 26 June 2026 at 14:00 UTC. The Omega block has continued its slow eastward drift, and the thermal core now sits firmly over central Europe. This is where the DWD Explorer and IMGW Explorer can provide additional detail, but the EuroMeteo view gives you the continental perspective.
German stations — particularly in the Rhine-Main area, the North German Plain, and Saxony — are now covered in purples, reporting temperatures in the high 30s to around 40°C. Polish stations in the western lowlands are also approaching or exceeding 35°C (shown in pinks/purples).
Meanwhile, look back at France: an Atlantic front has pushed into the western coast. Stations in Brittany, Normandy, and along the Atlantic seaboard have cooled significantly into the mid-20s (shown in reds), providing the first signs of relief.
This three-frame sequence — Spain/France on the 22nd, France/Benelux on the 24th, Germany/Poland on the 26th — is the signature of a classic west-to-east heatwave propagation.
Step 4: Inspect a Single Station for the Tropical Night Signal
To truly understand the human impact of a heatwave, we must look at nighttime temperatures.
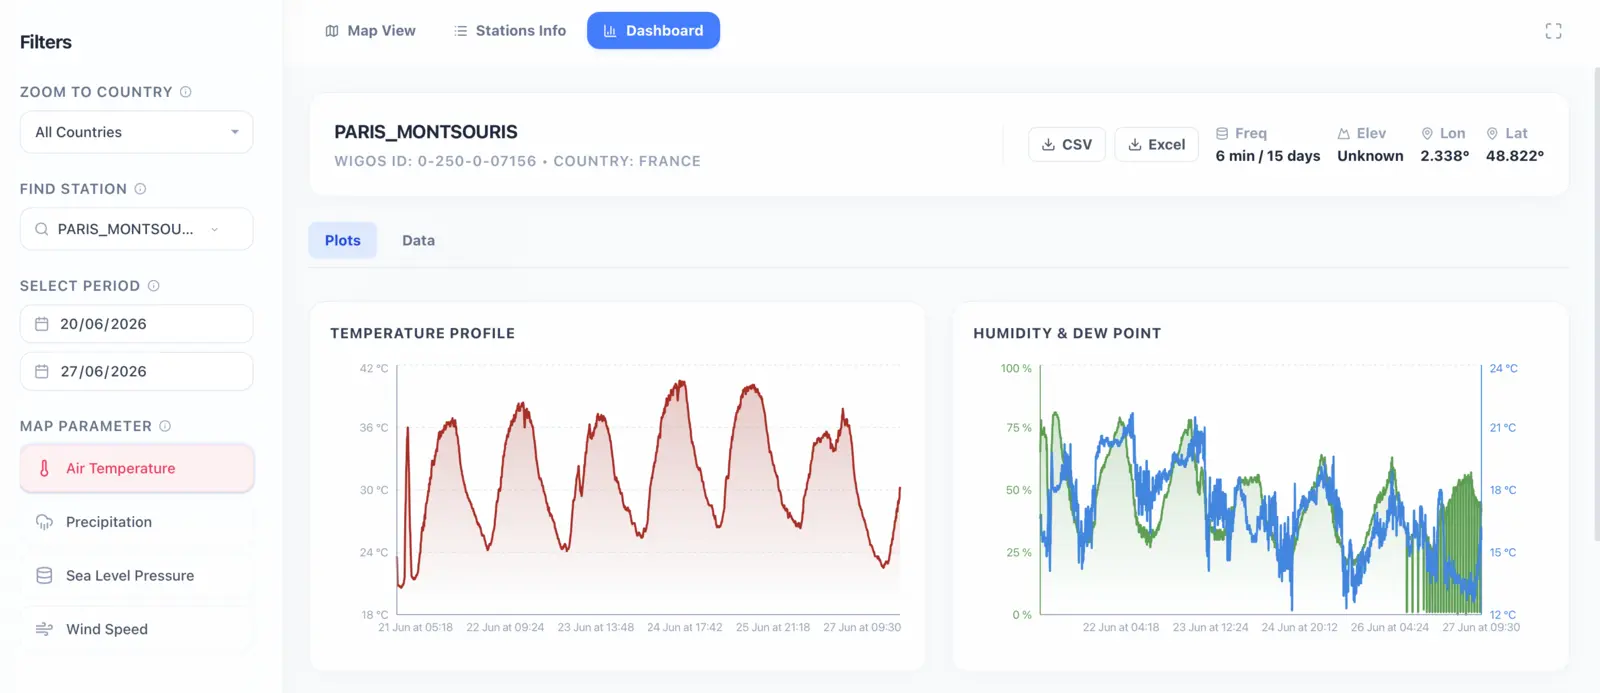
Find a station in the core of the heat dome — for example, PARIS_MONTSOURIS (WIGOS ID: 0-250-0-07156). Click on the station point on the map, then click Dashboard to see its full data profile for the selected period.
Look at the Temperature Profile chart. During the peak of the heatwave on the 24th and 25th of June, you’ll see the daytime highs spiking dramatically, approaching 41–42°C. But more importantly, pay attention to the troughs (the nighttime minimums).
Meteorologists define a “tropical night” as one where the temperature never drops below 20°C. In the dashboard for Paris Montsouris, you can see the nighttime minimums hovering above 24°C and even reaching 26–27°C during the peak of the event. This lack of nighttime cooling is what makes heatwaves so dangerous to public health, as the human body never gets a chance to recover from the daytime thermal stress.
Additionally, the Humidity & Dew Point chart reveals the intense drying effect of the heat: as temperatures peak each afternoon, relative humidity plummets to near 25%.
Reading the Signals: What the PARIS MONTSOURIS Station Data Shows
Beyond the temperature map, several other observational signals in the EuroMeteo data tell the story of this heatwave.
Persistent High Pressure
Switch to the pressure layer on the map during the peak days. A broad area of above-normal sea-level pressure should be visible over central and western Europe, corresponding to the sinking air under the Omega block. This is the visible fingerprint of the atmospheric pattern that caused the event. The pressure field is smoother and more spatially coherent than the temperature field, making it a useful way to identify the geographic center of the blocking ridge.
Southerly Wind Direction
In the days before peak temperatures arrive, wind directions typically shift toward a southerly or south-westerly component, reflecting the advection of warm Saharan air northward into the continent. This directional shift often precedes the temperature spike by 12–24 hours, making it a useful early signal when tracking the event in real time.
Humidity and Heat Stress
Some E-SOH stations report relative humidity alongside temperature. In a dry heat event, humidity drops as temperature rises. But in the 2026 event, some regions — particularly near coastlines and in the Benelux — experienced elevated humidity combined with extreme heat, producing dangerous heat index values. The EuroMeteo explorer does not calculate heat index directly, but inspecting temperature and humidity together on the station dashboard allows you to assess whether the heat was dry or humid at a given location.
Why Cross-Border Data Matters During a Heatwave
This event demonstrates precisely the use case that the MeteoGate platform and the E-SOH data feed were designed to serve.
A Heatwave Does Not Stop at National Borders
Without cross-border data, tracking this event would have required visiting separate portals for AEMET (Spain), Météo-France, KMI/IRM (Belgium), KNMI (Netherlands), DWD (Germany), and IMGW (Poland) — each with different formats, time zones, variable names, and access procedures. The E-SOH feed standardizes all of this into a single API using CF-standard variable names and UTC timestamps, and the EuroMeteo Explorer visualizes it on a single map.
That is not just a convenience. For emergency managers monitoring the advance of dangerous heat, for energy grid operators balancing cross-border electricity flows under extreme cooling demand, and for transport authorities tracking infrastructure risk across multiple countries, a fragmented view of a continental event is a structural handicap.
The Value of Watching the Leading Edge
One of the most actionable features of cross-border real-time data is the ability to see where the heat is heading before it arrives. On 24 June, when France was at peak temperatures, German stations in the Rhineland were already warming abnormally. That 24–48 hour window between the visible leading edge and the peak is exactly when civil protection agencies can pre-position resources, issue warnings, and open cooling centers.
Historical data cannot provide this kind of operational awareness. Only real-time, cross-border feeds can.
Putting It in Context: Where to Go for Historical Comparison
The EuroMeteo Explorer shows what is happening now. To understand whether “now” is truly extraordinary, you need historical context. Climate Explorer provides several tools for this.
- GHCNm offers homogenized monthly temperature data for thousands of global stations, some stretching back to the 18th century. Use it to see where June 2026 falls on the long-term trend line for a station like Paris-Montsouris or Berlin-Tempelhof.
- WMO Normals Explorer provides the official 1991–2020 climatological baselines. Compare the observed peak temperatures against the June normal to quantify the anomaly. As the WMO Normals limitations article explains, normals are a baseline, not a ceiling.
- DWD Explorer gives access to Germany’s full station archive, including 10-minute observations. If you want to see how the June 2026 peak at a German station compares to the 2019 or 2022 heatwaves, this is the right tool. The DWD 10-minute extreme weather guide explains how to read this data.
- IMGW Explorer provides the equivalent deep archive for Polish stations, including synoptic and climatological records useful for assessing whether the eastern end of the heatwave set any national records.
The most complete interpretation of an event like this comes from layering the real-time EuroMeteo view on top of the historical context from these deeper archives.
Key Takeaways
- The June 2026 European heatwave was driven by an Omega block pattern that advected Saharan air from Spain into eastern Europe over roughly six days.
- The EuroMeteo Explorer allows you to track the west-to-east propagation of the heatwave by stepping through the time slider and watching temperature patterns shift across national borders.
- Tropical nights — where minimum temperatures stay above 20°C — are visible in the hourly station data and represent one of the most dangerous health signals of a prolonged heat event.
- Cross-border data from MeteoGate removes the need to consult multiple national portals and provides a single, standardized continental view of the event.
- For historical context, pair the real-time EuroMeteo view with GHCNm trend data, WMO normals, and the national archives in DWD and IMGW.
- The leading edge of a heatwave is visible in cross-border data 24–48 hours before peak temperatures arrive, making real-time monitoring an operationally valuable tool for emergency preparedness.
Frequently Asked Questions (FAQ)
How can I track a heatwave in real time across Europe?
Open the EuroMeteo Explorer in Climate Explorer and select the temperature layer. Use the time slider to step through recent days and watch how the spatial pattern of high temperatures shifts across the continent. Double-click any station to open its dashboard and inspect the hourly temperature curve.
What was the hottest temperature recorded during the June 2026 European heatwave?
Several stations in southern France reported temperatures above 43°C on 23–24 June 2026, making it the hottest June day in French recorded history. Stations in Spain, Belgium, and the Netherlands also set national June records during the event. As the heat shifted eastward, German stations approached 40°C on 26–27 June.
What is an Omega block and how does it cause heatwaves?
An Omega block is a large-amplitude ridge in the upper-level jet stream, flanked by two troughs, forming a shape resembling the Greek letter Ω. Inside the ridge, air sinks, skies clear, and sustained sunshine heats the surface. The pattern is dynamically stable, meaning it can persist for days or weeks, preventing normal weather-front progression and allowing heat to build progressively.
Can I see tropical nights in the EuroMeteo Explorer?
Yes. Double-click on a station that was under the heatwave and switch to the Plots tab in the station dashboard. Look at the overnight portion of the temperature curve. If the temperature does not drop below 20°C between sunset and sunrise, that qualifies as a tropical night — a key health-risk indicator during prolonged heat events.
How does EuroMeteo compare temperatures between different countries?
EuroMeteo uses the E-SOH data feed from MeteoGate, which standardizes all observations using CF-convention variable names (e.g., air_temperature) and UTC timestamps. This means temperature values from Spain, France, Germany, and Poland are directly comparable on the same map without manual unit conversion or time-zone adjustment.