DWD 10-Minute Extreme Weather Guide
When it comes to analyzing historical weather patterns, temporal resolution is everything. A dataset that provides only daily averages is excellent for tracking long-term climate change over a century, but it is practically useless if you want to understand the dynamics of a sudden, severe summer thunderstorm.
This is where the Deutscher Wetterdienst (DWD), Germany’s national meteorological service, truly shines. Through its robust OpenData portal—and accessible via the Climate Explorer DWD interface—researchers have access to an incredibly granular 10-minute resolution dataset.
In this article, we will explore why this high-frequency data is so important and how you can use it to analyze extreme weather events across Germany.
The Problem with Daily Averages
Imagine a typical Central European summer day. At 8:00 AM, the temperature is a mild 18°C. By 2:00 PM, a massive convective system moves in, unleashing a violent thunderstorm with 100 km/h wind gusts and dropping 30mm of rain in just 20 minutes. By 4:00 PM, the storm has passed, and the sun returns, pushing the temperature up to a humid 26°C.
If you were to look at a standard daily summary for this station, you would see: * Max Temp: 26°C * Total Precipitation: 30mm * Average Wind Speed: 15 km/h
This daily summary tells a story, but it completely misses the narrative of the disastrous flash flood. The intensity of the rainfall—30mm concentrated into 20 minutes—is what overwhelmed the local drainage systems. The daily data smooths out the catastrophic event into a remarkably average-looking day.
Enter the DWD 10-Minute Archive
To capture these severe, fast-moving events, you need high-frequency data. The DWD operates hundreds of automated monitoring stations across the country that log measurements six times every hour.
This 10-minute fidelity allows you to observe the exact moment a cold front forces hot air upwards, the sudden spike in wind gusts as a microburst hits the ground, and the terrifying rapid accumulation rate of a torrential downpour.
Key Parameters Available at 10-Minute Resolution
When using the DWD Explorer, you can select the “10 Minutes” temporal resolution to visualize the following critical parameters:
- Air Temperature (Lufttemperatur): Precise readings that reveal rapid fluctuations during frontal passages, frost events, and sudden warming episodes.
- Precipitation (Niederschlag): The absolute most vital metric for identifying flash floods. 10-minute tipping-bucket rain gauges capture the precise intensity of cloudbursts.
- Humidity (Dew Point & Relative Humidity): Essential for understanding fog formation, frost risk, and near-surface moisture conditions.
- Sunshine Duration (Sonnenscheindauer): Crucial for the renewable energy sector to model the output of solar farms and assess daily solar yield.
Case Study: Tracking a Winter Cold Spell in Lower Saxony
Let us look at a practical example of how you can use the Climate Explorer to analyze extreme weather variability in Germany.
Step 1: Identify the Period of Interest Suppose you are researching the rapid temperature swings that occurred across northwest Germany in February 2026, when the region experienced a sharp transition from sub-zero frost to near-spring warmth within the same month.
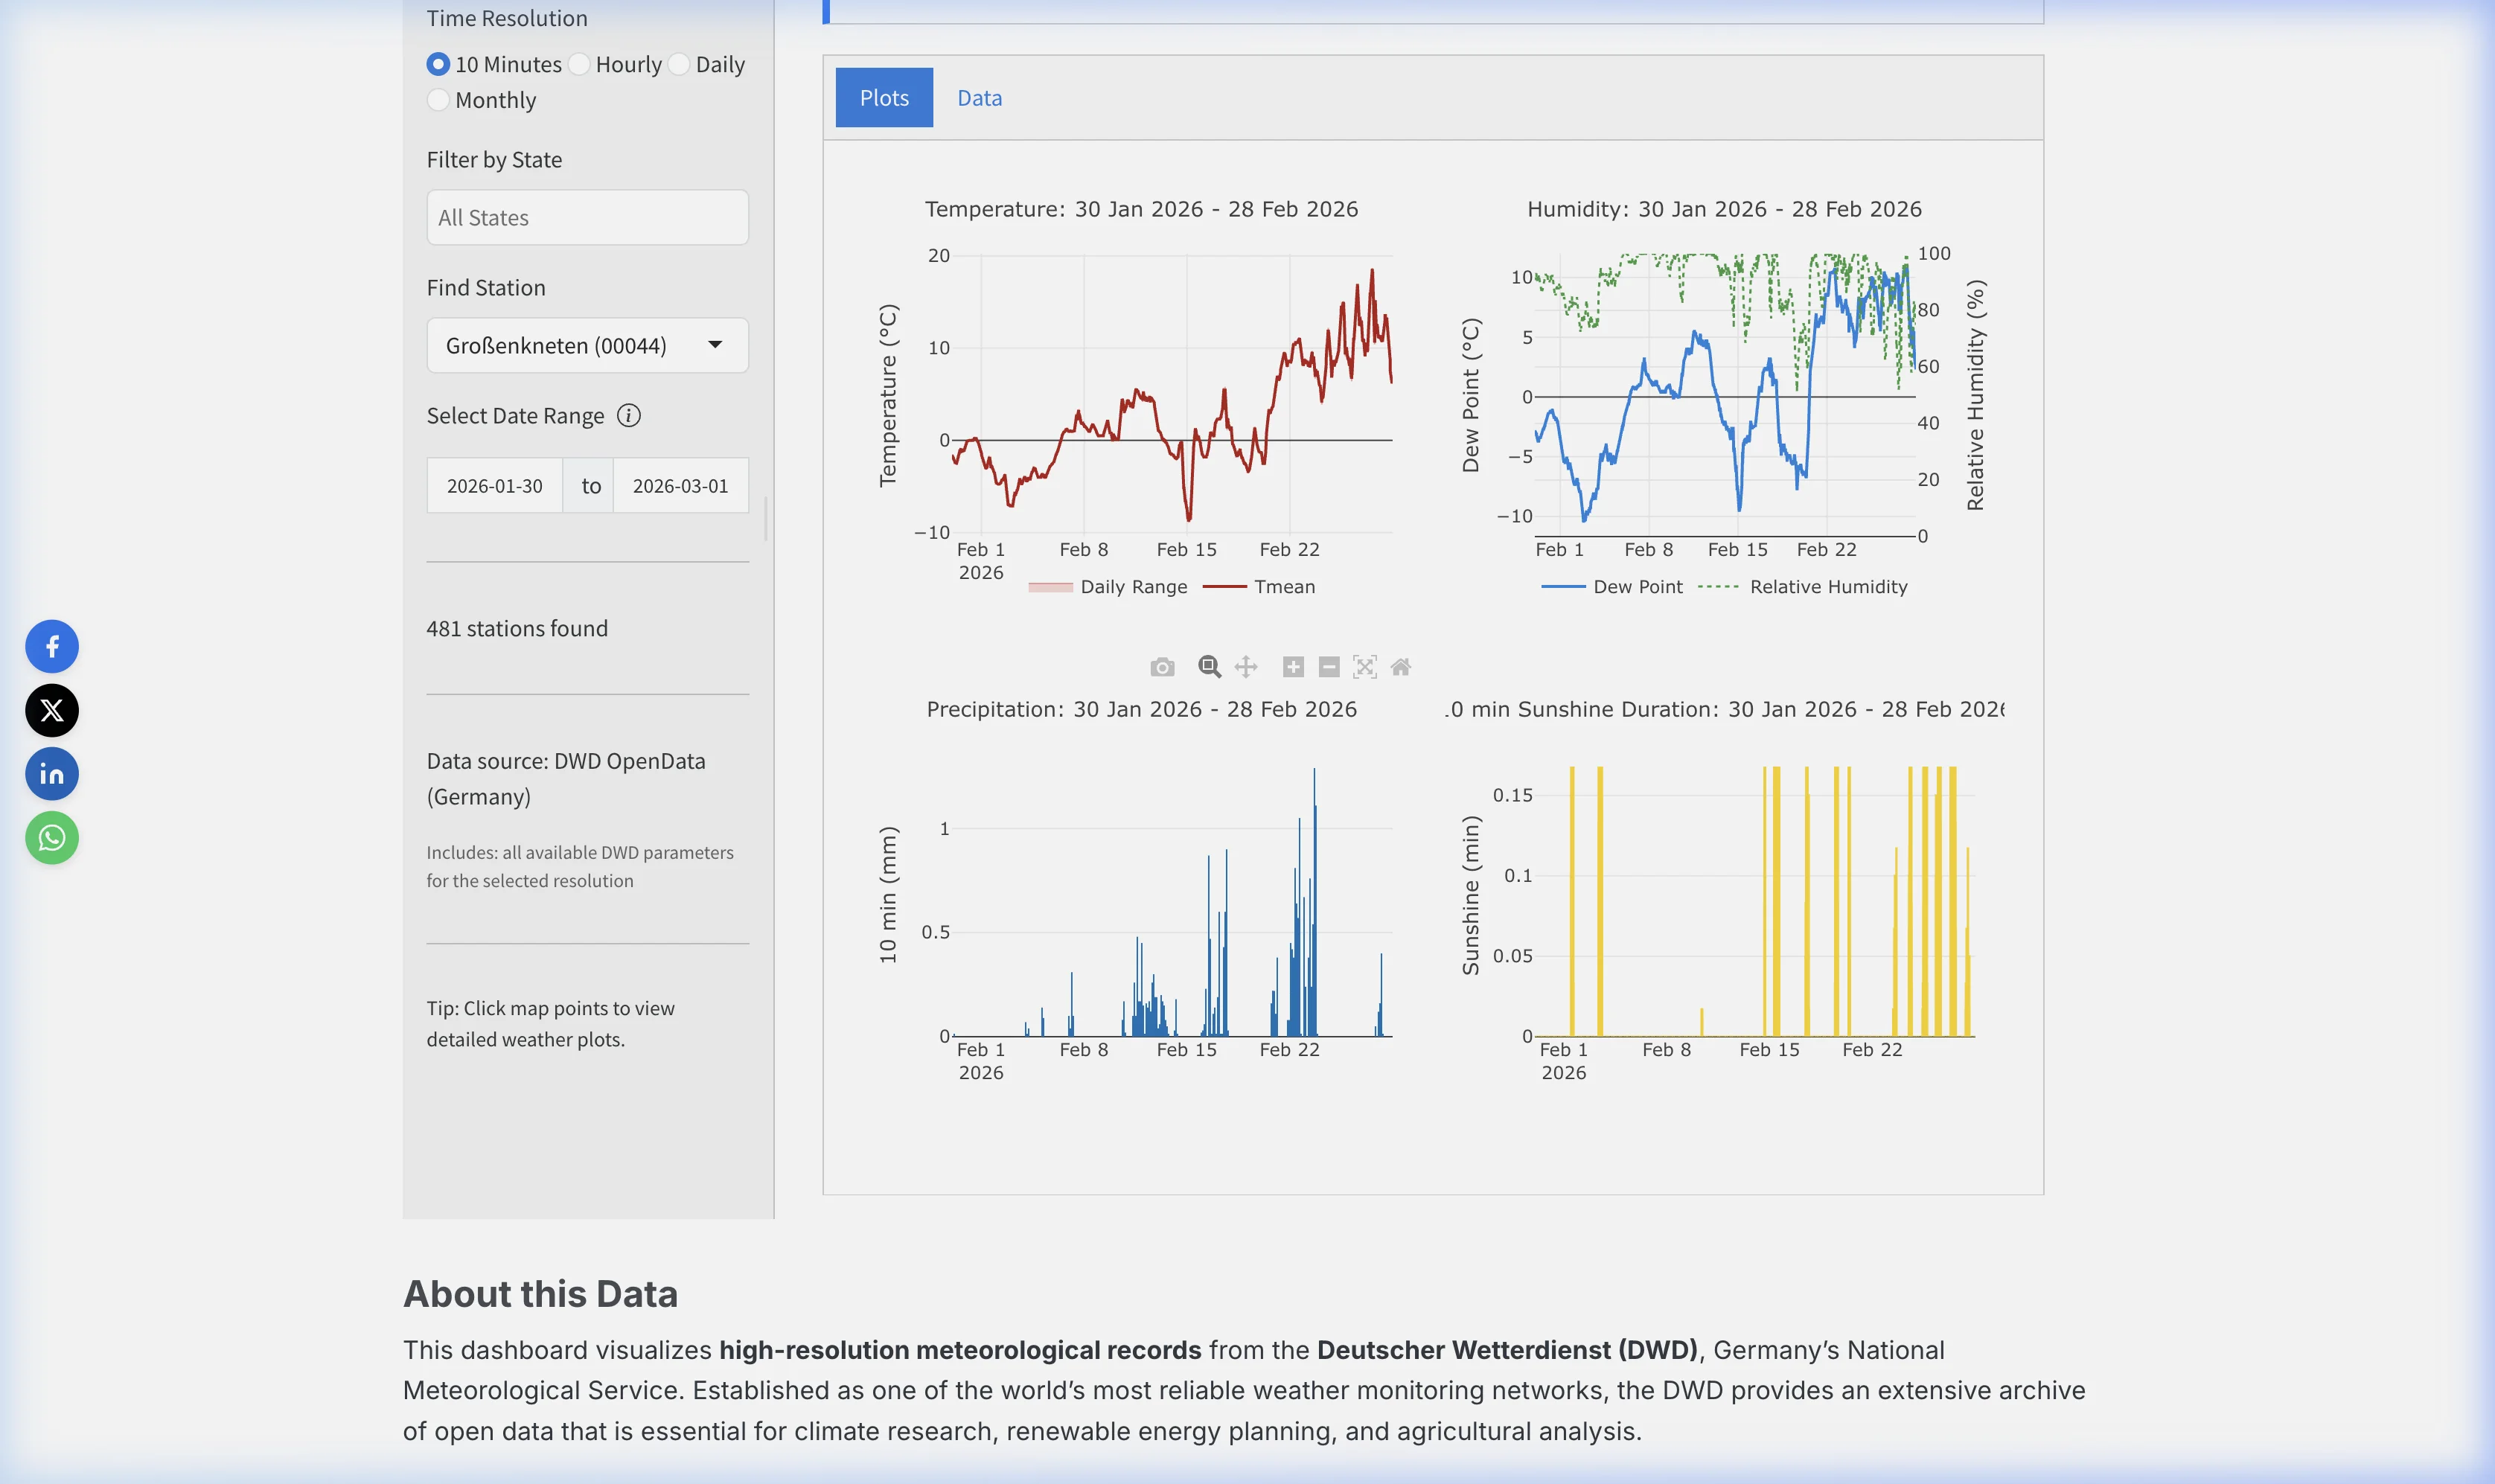
Step 2: Select the Station Navigate to the DWD Explorer dashboard and use the “Find Station” dropdown menu. Select the station Großenkneten (00044) in Lower Saxony.
Step 3: Set the Date Range Set the date range to 30 Jan 2026 – 28 Feb 2026 and ensure the Time Resolution toggle is set to 10 Minutes.
Step 4: Visualize the Data As seen in the screenshot at the top of this article, the temperature plot reveals the full story: temperatures oscillate between roughly -10°C and +20°C across February, with extremely rapid transitions visible at the 10-minute scale. The precipitation chart below shows intermittent precipitation spikes — some exceeding 1 mm per 10-minute interval — revealing individual rain or sleet events. The sunshine duration chart on the right confirms extended overcast periods in early February followed by increasing solar exposure as the month progresses.
Step 5: Export the Findings If you need to incorporate this data into a broader analysis, switch to the Data tab on the dashboard and export the raw 10-minute observations directly into a CSV file for analysis in R or an Excel spreadsheet.
Conclusion
The democratization of high-resolution meteorological data is changing how we understand our environment. By making 10-minute data freely available, the DWD empowers not just academic researchers, but urban planners, emergency responders, and civil engineers to build models that account for the true, granular extremes of the German climate.
Whether you are tracking solar grid stability or investigating the fluid dynamics of a convective storm, the Climate Explorer provides the gateway to this invaluable resource.
Frequently Asked Questions (FAQ)
What is the DWD 10-minute resolution dataset?
The DWD (Deutscher Wetterdienst) provides an open-data archive of meteorological observations recorded every 10 minutes from automated weather stations across Germany. This high-frequency data captures rapid weather changes, such as sudden wind gusts, temperature drops during frontal passages, and intense bursts of precipitation.
Why is 10-minute weather data better than daily averages?
Daily averages smooth out the extremes of a day. If a severe thunderstorm drops a month’s worth of rain in 20 minutes causing a flash flood, a daily summary might only show a moderate rainfall total for the 24-hour period. 10-minute data accurately captures the true intensity and chronology of these extreme, fast-moving weather events.
Is DWD historical weather data free to use?
Yes. Germany’s national meteorological service operates an OpenData portal, providing free and unrestricted access to historical weather records. The Climate Explorer app connects directly to this official DWD database to let users visualize the data without needing to write code.
What parameters can I analyze at a 10-minute resolution?
Using the DWD Explorer, you can analyze several critical parameters logged at 10-minute intervals, including Air Temperature, Precipitation (vital for flood modeling), Humidity (Dew Point and Relative Humidity), and Sunshine Duration (important for solar energy forecasting).
Can I download the 10-minute weather data for Germany?
Absolutely. Once you have visualized your desired date range and station in the DWD Explorer dashboard, you can switch to the data table view and export the raw, 10-minute observations directly into a CSV file for further analysis in software like R, Python, or Excel.
Data Sources
- DWD OpenData: High-resolution meteorological observations from Deutscher Wetterdienst.