US Weather Grid Guide: 4.6 km Daily Lookup (1951+)
How to look up any CONUS date since 1951 on NOAA’s 4.6 km nClimGrid-Daily raster, inspect counties or grid cells, and export PNG cards, CSVs, or GeoTIFFs.
Open US Weather Grid Explorer World Stations (1750+)
Quick start
- Open the US Weather Grid Explorer — the initial view loads July 20, 1969 (the Apollo 11 Moon landing date) across all 48 contiguous U.S. states and Washington, D.C.
- Pick any date from 1 January 1951 to present using the month, day, and year selectors, the calendar picker, the
« 1y/‹ Day/Day ›/1y »transport controls, or one of the Historic Events chips. - Search any state (49 entities including D.C.), county (3,109 counties), or city/town (20,722 U.S. places), or click directly anywhere inside the contiguous United States on the map.
- Switch between High (Tmax), Low (Tmin), and Precip, toggle
°F, inor°C, mm, and download a1200×630PNG Day Card, CSV, or georeferenced Float32 GeoTIFF.
Choosing a geographic scope
The Explorer lets you move seamlessly across four spatial levels without leaving the browser:
- Contiguous United States (CONUS): Area-weighted daily summary across all ~472,387 active land cells (
1/24°, ~4.6 km spacing). PressEscor click Reset anytime to return to the CONUS overview. - States & D.C. (49 entities): Area-mean daily series precomputed from 1951 onward, ideal for statewide heatwaves, freezes, or wet-day rankings.
- Counties (3,109 CONUS counties & parishes): Area-averaged daily high, low, and precipitation across every county boundary. Toggle Click selects: County above the map to click straight into any county polygon.
- 4.6 km Grid Cell / Cities & Towns (20,722 populated places): Streaming a single cell column via cloud-optimized Zarr v3 byte ranges gives exact cell values (
41.85°N, 87.65°Wfor Chicago, IL), grid-cell extremes since 1951, same-calendar-day rankings across all 76 years, and 365-day seasonal curves against the 1991–2020 normal band.
Variables, units, and 1991–2020 anomalies
Every grid cell and administrative area reports three primary NOAA NCEI nClimGrid-Daily fields stored in fixed-point integer shards (0.1 °C for air temperature and 0.1 mm for precipitation):
| Map Layer | Physical Quantity | Default Display Units | Metric Display Units | Baseline Comparison |
|---|---|---|---|---|
| High (Tmax) | Daily maximum near-surface air temperature | °F (0.1 °F) |
°C (0.1 °C) |
1991–2020 same-calendar-day 29-day window mean and p10–p90 envelope |
| Low (Tmin) | Daily minimum near-surface air temperature | °F (0.1 °F) |
°C (0.1 °C) |
1991–2020 same-calendar-day 29-day window mean and p10–p90 envelope |
| Precip | Daily total liquid-equivalent precipitation | in (0.01 in) |
mm (0.1 mm) |
1991–2020 mean & dry/wet-day historical count since 1951 |
Temperature departures show both Fahrenheit and Celsius deltas when useful so U.S. readers and climatologists share identical context. Recent observations inside the active trailing month carry NOAA’s preliminary status until monthly scaled grids are finalized.
Worked example: July 13, 1995 Chicago & Cook County heatwave
- In the Historic Events strip (or directly at
/weather-on-this-day/usa/illinois/cook-county/chicago/?var=tmax&date=1995-07-13), select Jul 13, 1995 · Chicago Heatwave. - Inspect the Chicago (
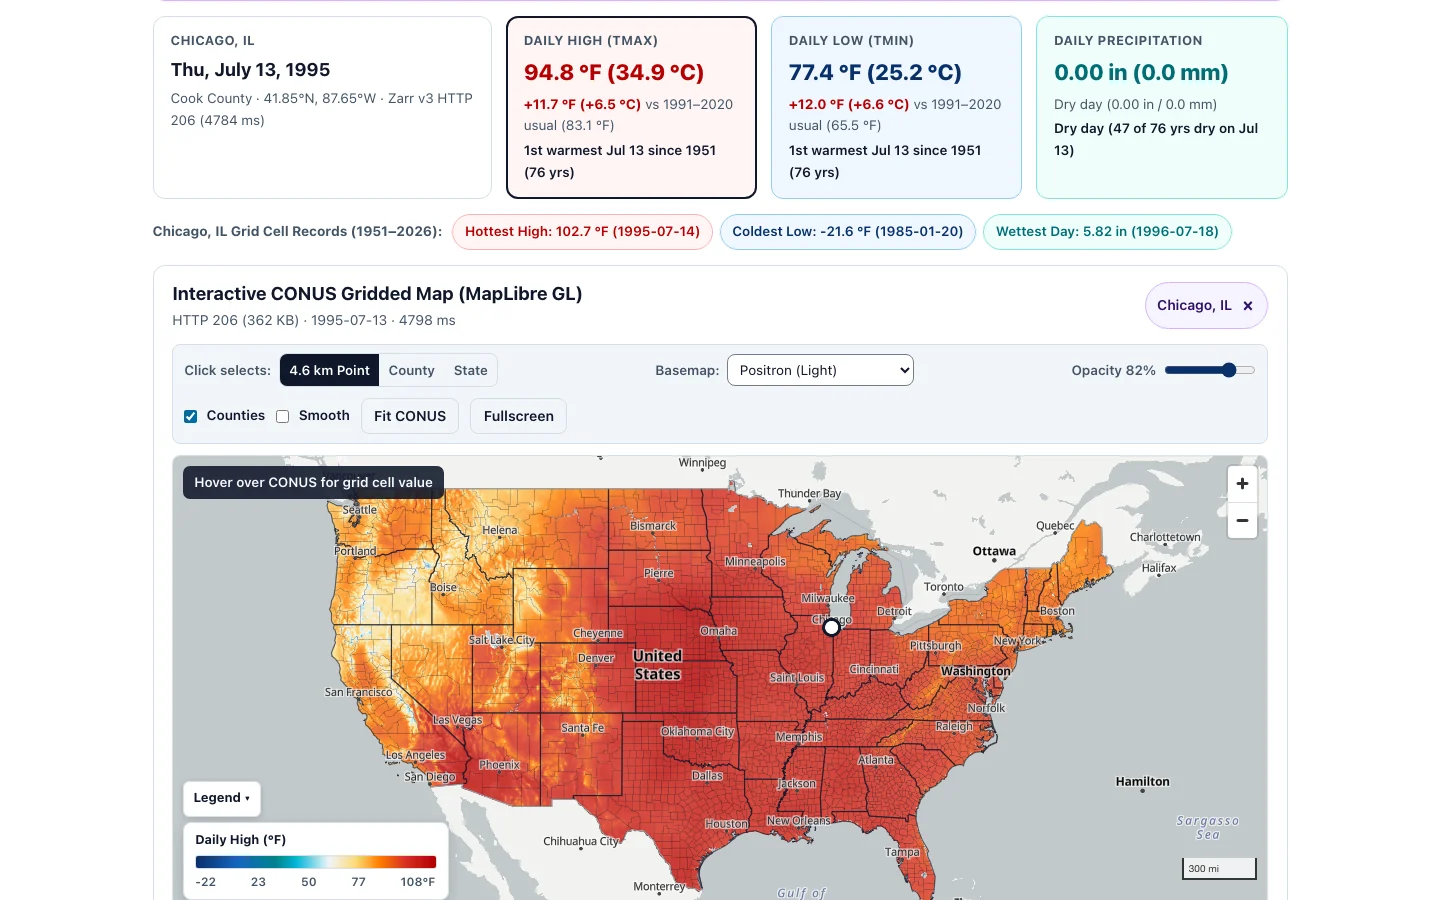
Cook County · 41.85°N, 87.65°W) summary cards:- Daily High (Tmax):
94.8 °F (34.9 °C),+11.7 °F (+6.5 °C)warmer than the 1991–2020 July 13 usual (83.1 °F), ranking 1st warmest July 13 since 1951 (76 yrs) at this 4.6 km cell. - Daily Low (Tmin):
77.4 °F (25.2 °C),+12.0 °F (+6.6 °C)warmer than the 1991–2020 usual (65.5 °F), also ranking 1st warmest July 13 overnight low since 1951 — illustrating why high nocturnal humidity and extreme minimum temperatures drove the deadly 1995 heat stress. - Grid Cell Records pill: Clicking
Day ›to July 14, 1995 reaches the cell’s all-time peak of102.7 °F(1995-07-14).
- Daily High (Tmax):
- Switch Click selects to County and click Cook County (or select Cook County, IL in search) to compare the countywide area mean against Chicago’s lakefront grid cell, or advance to the Plotly Annual & Same-Calendar-Day charts below the map to inspect the long-term linear trend.
Exporting PNG cards, CSVs, and Float32 GeoTIFFs
Scroll to the Export & Download strip below the interactive charts to save reproducible snapshots and raw numbers:
- PNG Day Card (
1200×630): Renders a clean social-ready summary card showing the active location, date, Daily High, Daily Low, Precipitation, 1991–2020 departure, ranking, and NOAA nClimGrid-Daily provenance footer. - CSV Time Series Export: Downloads either the selected calendar year daily series or the same-calendar-day (
1951–present) series for the active CONUS, state, county, or grid-cell scope, including units and quality metadata. - GeoTIFF Raster Export (
Float32WGS84): Encodes the active day’s full CONUS grid directly in the browser into an uncompressed standardFloat32GeoTIFF inEPSG:4326(°Cfor Tmax/Tmin,mmfor Prcp), ready to drag straight into QGIS, R (terra), or Python (rioxarray).
Troubleshooting
- Need dates before 1951, Alaska, Hawaii, Puerto Rico, or daily snowfall depth?
-
nClimGrid-Dailycovers the 48 contiguous U.S. states plus Washington, D.C. from 1 January 1951 onward and omits snowfall (SNOW/SNWD). Switch to World Weather on Any Date (1750+) for Central Park, Anchorage, Honolulu, San Juan, international cities, pre-1951 records, and snowfall totals. - Grid-cell value differs slightly from a nearby airport weather report
-
nClimGrid-Dailyblends station records onto a uniform~4.6 kmgrid (1/24°). Spatial interpolation captures continuous neighborhood terrain gradients everywhere in CONUS, while single-point airport ASOS thermometers can record slightly sharper spikes on sunny calm afternoons or localized thunderstorm cores. - Map appears blank or raster shading does not load behind a strict firewall
-
Make sure your browser allows HTTPS
Rangerequests tohttps://us-data.climateexplorer.appand map style fetches tohttps://tiles.openfreemap.org. If vector basemap tiles are blocked locally, choose Basemap: Minimal (Offline Vector) in the map toolbar so country/state geometry and the NOAA grid raster still render cleanly. - GeoTIFF opens upside-down or shows
-9999over the ocean -
Ocean pixels and points outside CONUS use standard IEEE-754
NaN(nodata) in the exportedFloat32GeoTIFF with north-upModelPixelScaleTag/ModelTiepointTagGeoKeys (EPSG:4326). Older viewers that ignoreNaNdisplay ocean cells correctly oncenodata = nanis honored in QGIS or GDAL.