September 2026 Across the Nordic Region: Warmth and Rainfall Contrasts
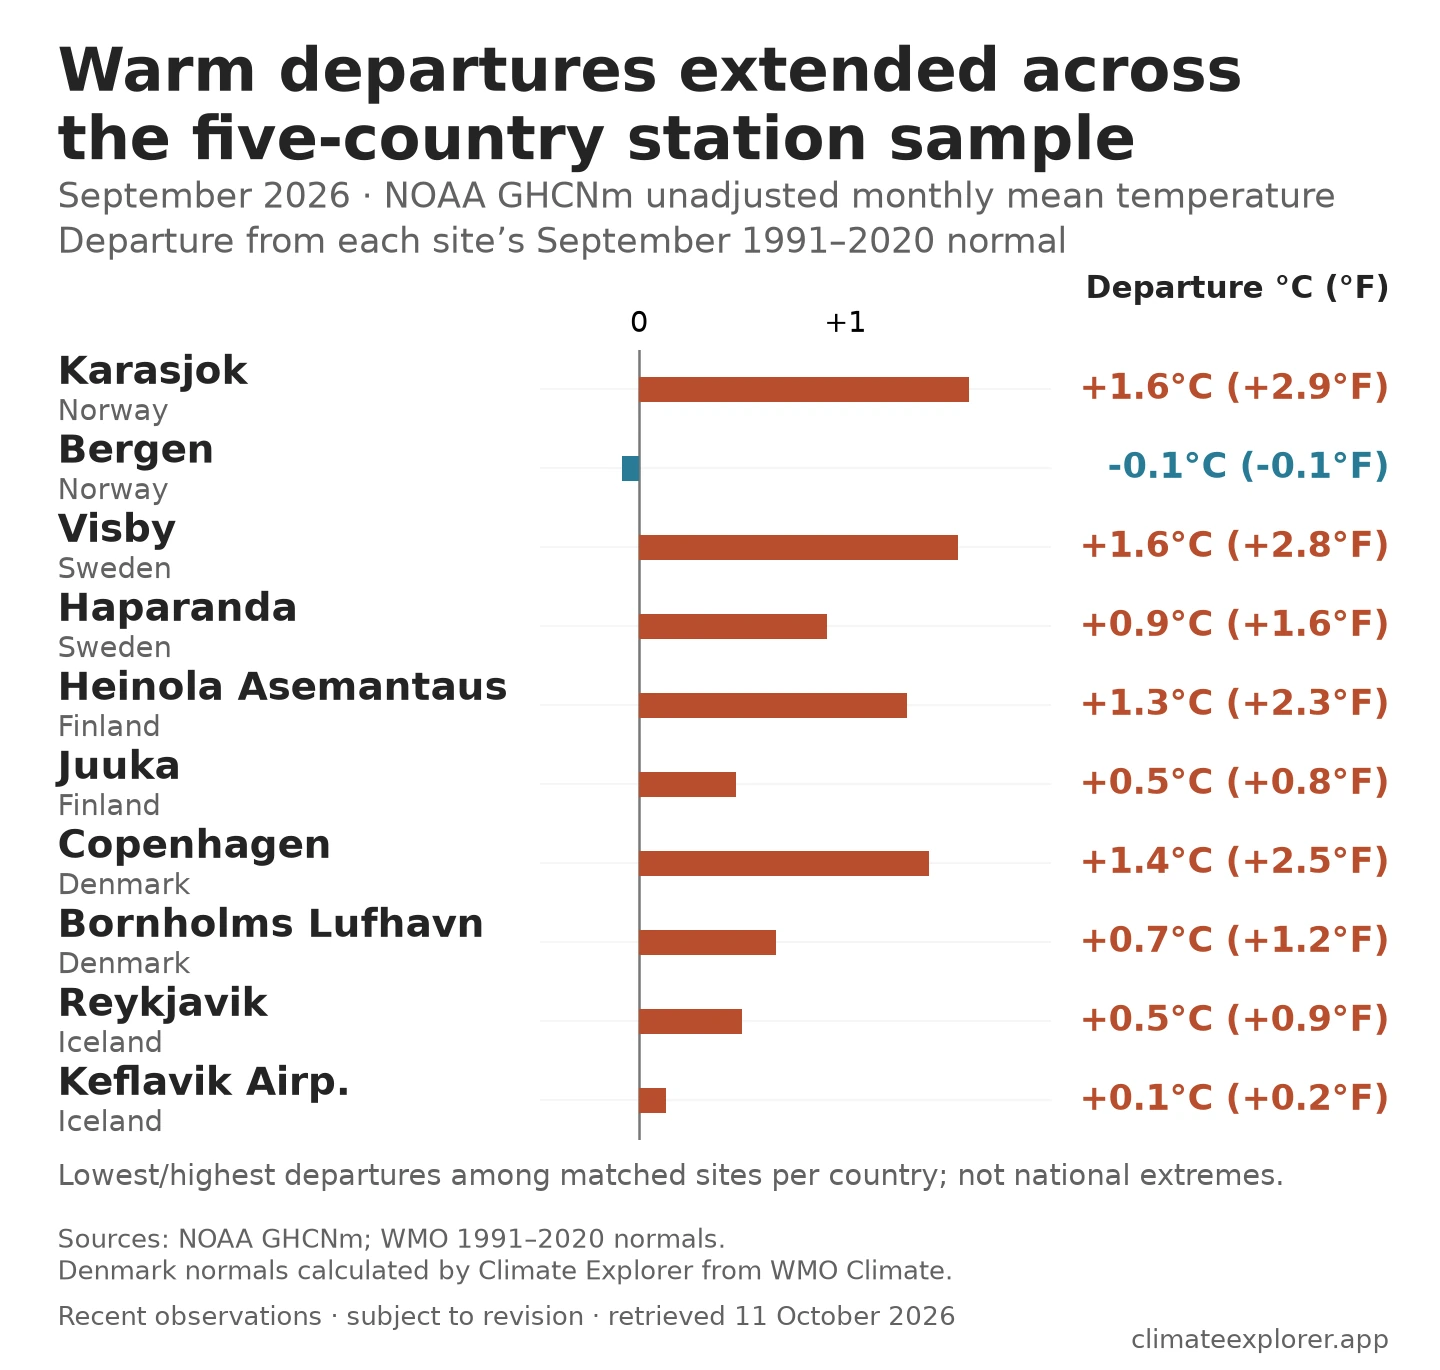
September was warmer than usual at 35 of the 36 Nordic stations in this comparison. The warmth appeared at stations across Norway, Sweden, Finland, Denmark and Iceland; Bergen was close to its usual temperature.
Rainfall brought strong local contrasts. Kevo in northern Finland received just over three times its usual September precipitation. Bergen had the largest total in the smaller rainfall sample, though other sites—including Oslo–Blindern—finished below their usual amounts.
Here, “usual” means the station’s September average for 1991–2020, known as a climate normal. In the temperature charts, a departure is the difference from that normal. These are observations at named weather stations, rather than averages across whole countries.
The rainfall totals here measure precipitation: rain and any snow or other frozen forms expressed as an amount of water.
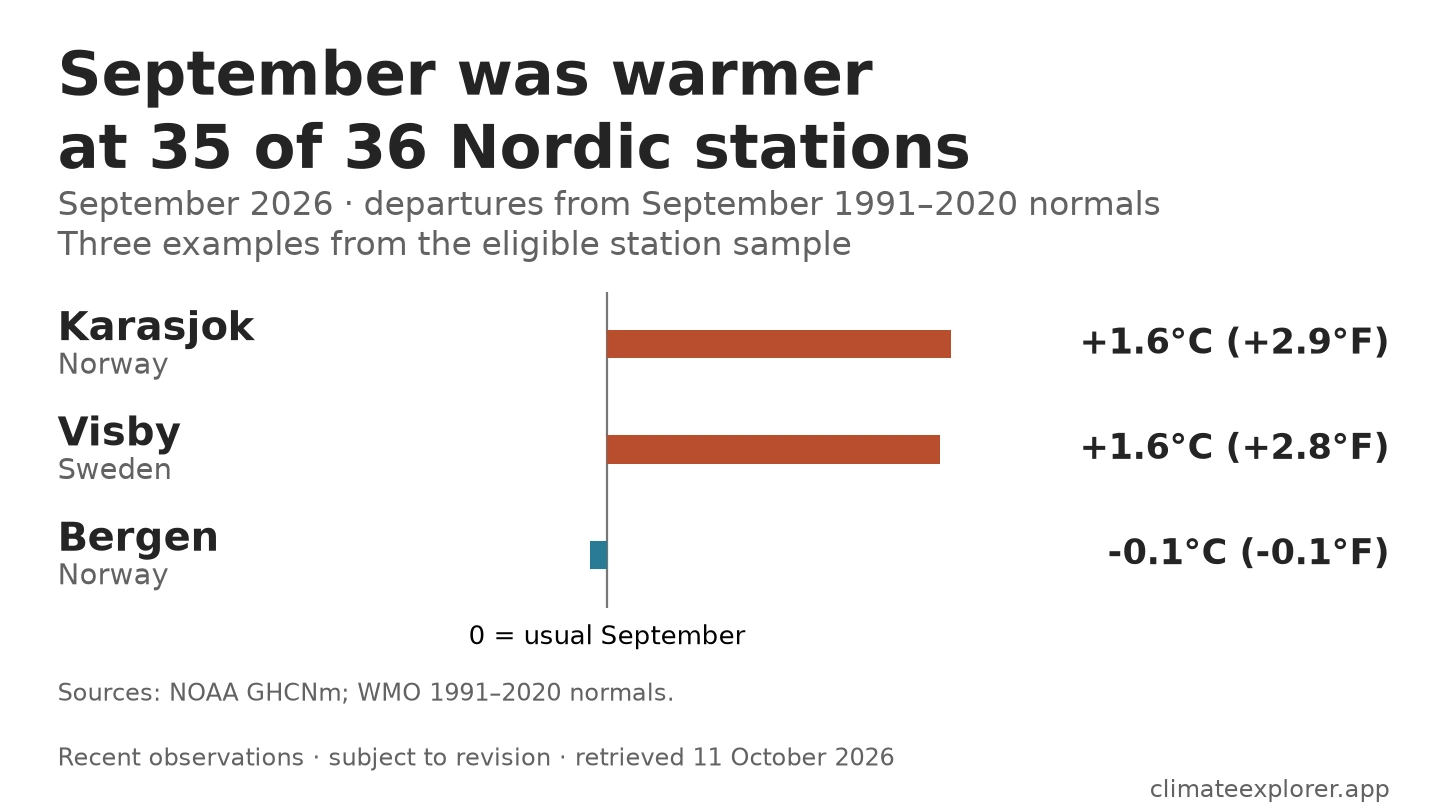
Northern and southern stations were warmer than usual
Karasjok in northern Norway averaged about 1.6°C (2.9°F) above its September normal. Visby, on Sweden’s island of Gotland, was similarly warm for the time of year. Oslo–Gardermoen was also warmer than usual.
Bergen stood apart. Its September average, 12.5°C (54.5°F), was very close to its normal of 12.6°C (54.7°F). The small difference is best read as a near-normal month, rather than a notably cold September. These figures are monthly means, not the highest temperatures reached.
The chart shows the smallest and largest differences from normal among the stations compared in each country. It illustrates variation within this sample, rather than national extremes. The three Danish temperature references were calculated separately; their method is documented in the annex.
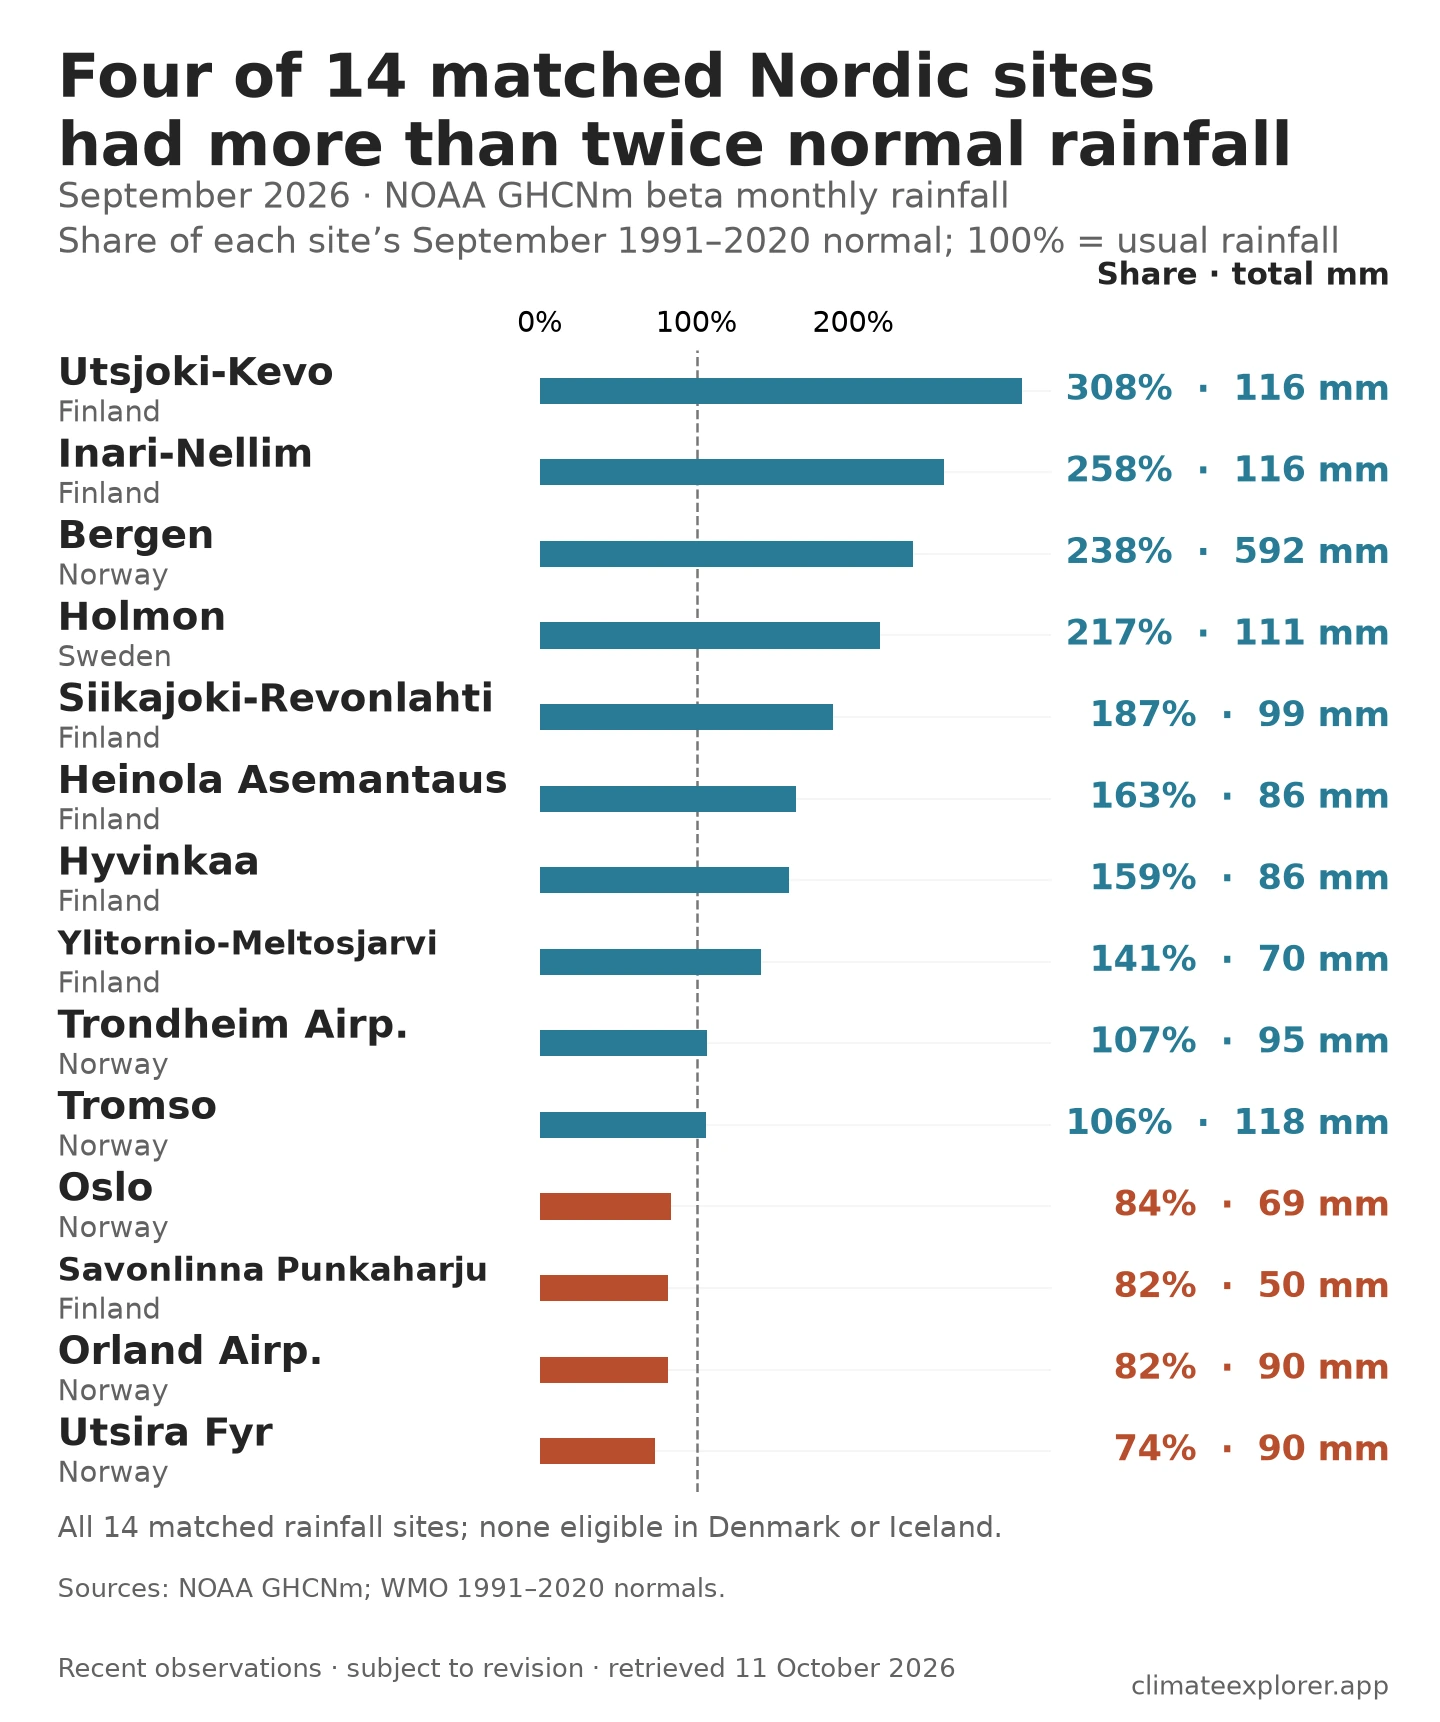
Kevo was much wetter than usual; Bergen had the largest total
Utsjoki–Kevo reported 115.7 mm of precipitation against a September normal of 37.6 mm—just over three times the usual amount (308%). Inari–Nellim, also in northern Finland, received a similar total, but that represented more than twice its own normal (258%).
Bergen’s 591.9 mm was a much larger amount of precipitation. Its usual September total is also higher, however, so the month brought about 2.4 times its normal precipitation (238%). Kevo was furthest above its local expectation; Bergen had the most precipitation in this 14-station sample.
Ten of those rainfall stations were above normal and four below. Oslo–Blindern and Utsira Fyr were among the sites with less precipitation than usual. Rainfall varied between observing sites even as warmer-than-usual temperatures were common.
The rainfall comparison covers sites in Norway, Finland and Sweden. No Danish or Icelandic site qualified, so it cannot describe September rainfall in those countries.
How September compared with summer
At 31 of the 36 temperature stations, September was warmer relative to its own normal than June–August was relative to its summer normal. This can include a month that was less far below normal. It does not mean September was hotter than summer.
Ylitornio–Meltosjärvi in Finland and Visby in Sweden illustrate the larger September differences. At Utsjoki–Kevo, the difference narrowed.
| Station | June–August above normal, °C (°F) | September above normal, °C (°F) |
|---|---|---|
| Ylitornio–Meltosjärvi | +0.2 (+0.4) | +1.1 (+2.1) |
| Visby | +0.8 (+1.4) | +1.6 (+2.8) |
| Utsjoki–Kevo | +1.6 (+2.9) | +1.1 (+2.0) |
Both periods were calculated from the same NOAA temperature series. The Nordic summer article used a different observation source, so its figures can differ from these recalculated summer values. The annex explains the comparison.
For a wider urban comparison, read September at European capital stations.
Explore the comparison
The September comparison CSV contains the observations and local references. Use the WMO Normals Explorer to inspect the published September averages; the Danish temperature references were calculated separately. Exact identifiers and steps for checking the rainfall examples are in the annex.
Conclusion
September was warmer than usual at most of these Nordic stations, with Bergen close to its normal temperature. Rainfall brought a different set of contrasts: Kevo, Nellim and Bergen were well above their local normals, while Oslo–Blindern and Utsira received less than usual. Temperature and rainfall together give a fuller picture of the month, within the limits of the stations compared.
Period covered: 1–30 September 2026. Source data checked on 11 October 2026; recent monthly observations may be revised. A monthly report does not establish complete observations for every contributing day.
Data Annex
The starting selection was the 47 stations in the summer article. The September temperature comparison includes 12 in Norway, four in Sweden, 14 in Finland, three in Iceland and three in Denmark. The 14 rainfall sites comprise six in Norway, seven in Finland and one in Sweden. Missing or unresolved matches were excluded, including the Fokstua/Fokstugu pairing and the Helsinki Ilmala/Kaisaniemi mismatch.
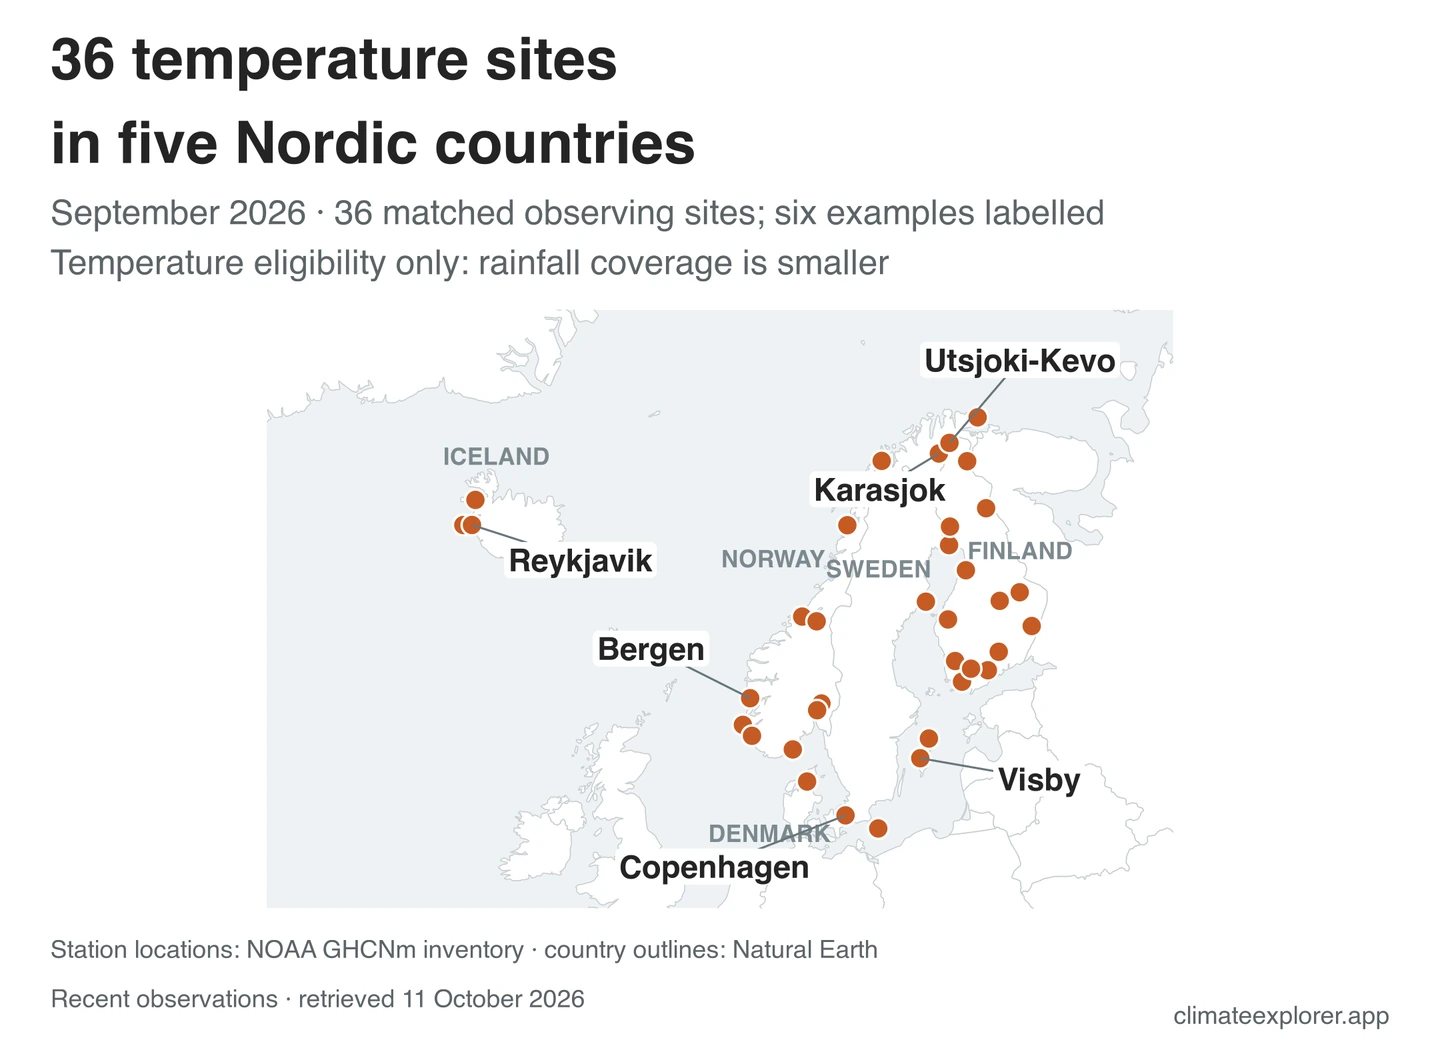
Temperature departures subtract each station’s September reference from its reported mean. Rainfall percentages are the observed total divided by the September normal, multiplied by 100. June–August temperature departures use day-weighted monthly observations and normals. No missing month or day was filled in.
Climate Explorer calculated the three Danish temperature references from WMO Climate monthly series for 1991–2020, with 30 valid Septembers at each station. They are calculated references, not normals published by DMI or official WMO standard-normal submissions. The monthly archive does not establish the daily completeness or unchanged observing practice of every contributing year.
The monthly totals report total precipitation, including the water equivalent of frozen forms. They do not identify how much fell as rain, snow or another form. No snowfall event or phase proportion is inferred here.
NOAA’s monthly precipitation product is a beta release. We excluded quality-flagged or explicitly incomplete totals, including Torungen Fyr’s record with three missing days and Salla’s with one. A blank measurement flag can mean that missing-day information was unavailable, so the retained values are reported monthly totals, not independently certified complete daily records.
Station metadata can differ between observations and normals. Værnes’ temperature inventory location differs from its normal location by about 4.9 km; excluding that temperature pairing leaves 34 of 35 retained sites above normal. Its precipitation metadata matches the normal location closely enough to retain that separate rainfall comparison. These differences are recorded in the crosswalk rather than explained by an assumed relocation.
The published reference normals are NCEI’s version 2.2, minimum-24-year composites. The rule uses supplied year counts and assumes 30 years where those counts were absent. A matching identifier does not establish a homogeneous climate-trend record.
Downloads: monthly observations and calculations, station identifiers and metadata, and coverage and exclusions. Summer temperature fields use the recalculated NOAA series; the summer rainfall field is retained from the earlier WMO Climate analysis and is not used to claim a rainfall change.
Station identifiers
WIGOS is a globally unique station identifier; WMO is the legacy station code. These verified WIGOS identifiers come from the normal metadata. The full crosswalk supplies NOAA identifiers and separate observation and normal metadata.
- Bergen: 0-20000-0-01317.
- Utsjoki–Kevo: 0-20000-0-02805.
- Karasjok: 0-20000-0-01065.
- Visby: 0-20000-0-02590.
- Oslo–Gardermoen: 0-20000-0-01384.
- Inari–Nellim: 0-20000-0-02835.
- Oslo–Blindern: 0-20000-0-01492.
- Utsira Fyr: 0-20000-0-01403.
- Ylitornio–Meltosjärvi: 0-20000-0-02812.
Their source-backed NOAA associations are recorded in the crosswalk; an identifier match does not establish an unchanged observing location.
Verify the exact observations
The September comparison CSV contains the observations, references and metric-specific eligibility. To check the rainfall example, find Utsjoki–Kevo, WMO 02805, paired with NOAA precipitation station FIE00146698: 115.7 mm divided by 37.6 mm gives 308%, rounded.
Open the WMO Normals Explorer, choose Finland and the Kevo station with that identifier, then read the September Precipitation reference. The normals guide explains the columns and station selection. Danish temperature references in this article were calculated separately and should be checked in the CSV and historical source series.
The GHCNm Explorer provides a route into NOAA’s monthly station histories, but its temperature series is adjusted QCF. This article uses unadjusted QCU temperature. Use the article CSV and the upstream archive for the exact values; the GHCNm guide explains the products.
Selected station metadata
These examples use NOAA observation-inventory coordinates and elevations. These are provider-listed surface observing stations; an urban/rural classification was not independently audited. The full crosswalk records the normal-site metadata separately; WIGOS identifiers below come from the normal metadata, with WMO identifiers used where no WIGOS identifier was supplied.
| Station | WMO / WIGOS | NOAA temperature ID | Latitude, longitude | Elevation (m) |
|---|---|---|---|---|
| Karasjok | 0-20000-0-01065 | NOE00105498 | 69.4633, 25.5019 | 131.0 |
| Visby | 0-20000-0-02590 | SW000002590 | 57.6667, 18.3331 | 42.0 |
| Utsjoki-Kevo | 0-20000-0-02805 | FIE00146698 | 69.7556, 27.0119 | 107.0 |
| Bergen | 0-20000-0-01317 | NO000050540 | 60.3831, 5.3331 | 12.0 |
Selected September values
Monthly means, departures and eligible rainfall values for the same examples are shown below. A dash means no eligible rainfall comparison. The downloadable comparison contains every candidate station, rainfall values, flags and eligibility.
| Station | Mean, °C (°F) | Normal, °C (°F) | Departure, °C (°F) | Precipitation (mm) | Precipitation normal (mm) | Precipitation (% of normal) |
|---|---|---|---|---|---|---|
| Karasjok | 7.8 (46.0) | 6.2 (43.2) | +1.6 (+2.9) | — | — | — |
| Visby | 14.6 (58.2) | 13.0 (55.4) | +1.6 (+2.8) | — | — | — |
| Utsjoki-Kevo | 7.5 (45.5) | 6.4 (43.5) | +1.1 (+2.0) | 115.7 | 37.6 | 308 |
| Bergen | 12.5 (54.5) | 12.6 (54.7) | -0.1 (-0.1) | 591.9 | 248.5 | 238 |
Data Sources
WMO precipitation measurement guidance, section6.1.1: liquid and frozen forms are expressed as water depth or water equivalent.
NOAA GHCNm v4 precipitation product paper: monthly totals, source datasets and published output documentation.
NOAA GHCNm unadjusted monthly temperature archive: September and June–August monthly means; the downloaded release was produced on 10 October 2026.
NOAA monthly precipitation files, including Utsjoki–Kevo, and precipitation format and flags.
NOAA GHCNm product description: temperature processing and beta precipitation status.
WMO 1991–2020 mean-temperature normals, NCEI accession 0253808, version 2.2 and precipitation normals.
NCEI normal archive and completeness conventions, NOAA station inventory with WMO associations, and DWD WMO Climate station metadata.
Danish calculated-reference inputs: Aalborg, Copenhagen, and Bornholm, interpreted using WMO-No. 1203 normal-calculation guidance.