Summer 2026 Across the Nordic Region: Arctic Heat and Atlantic Rains
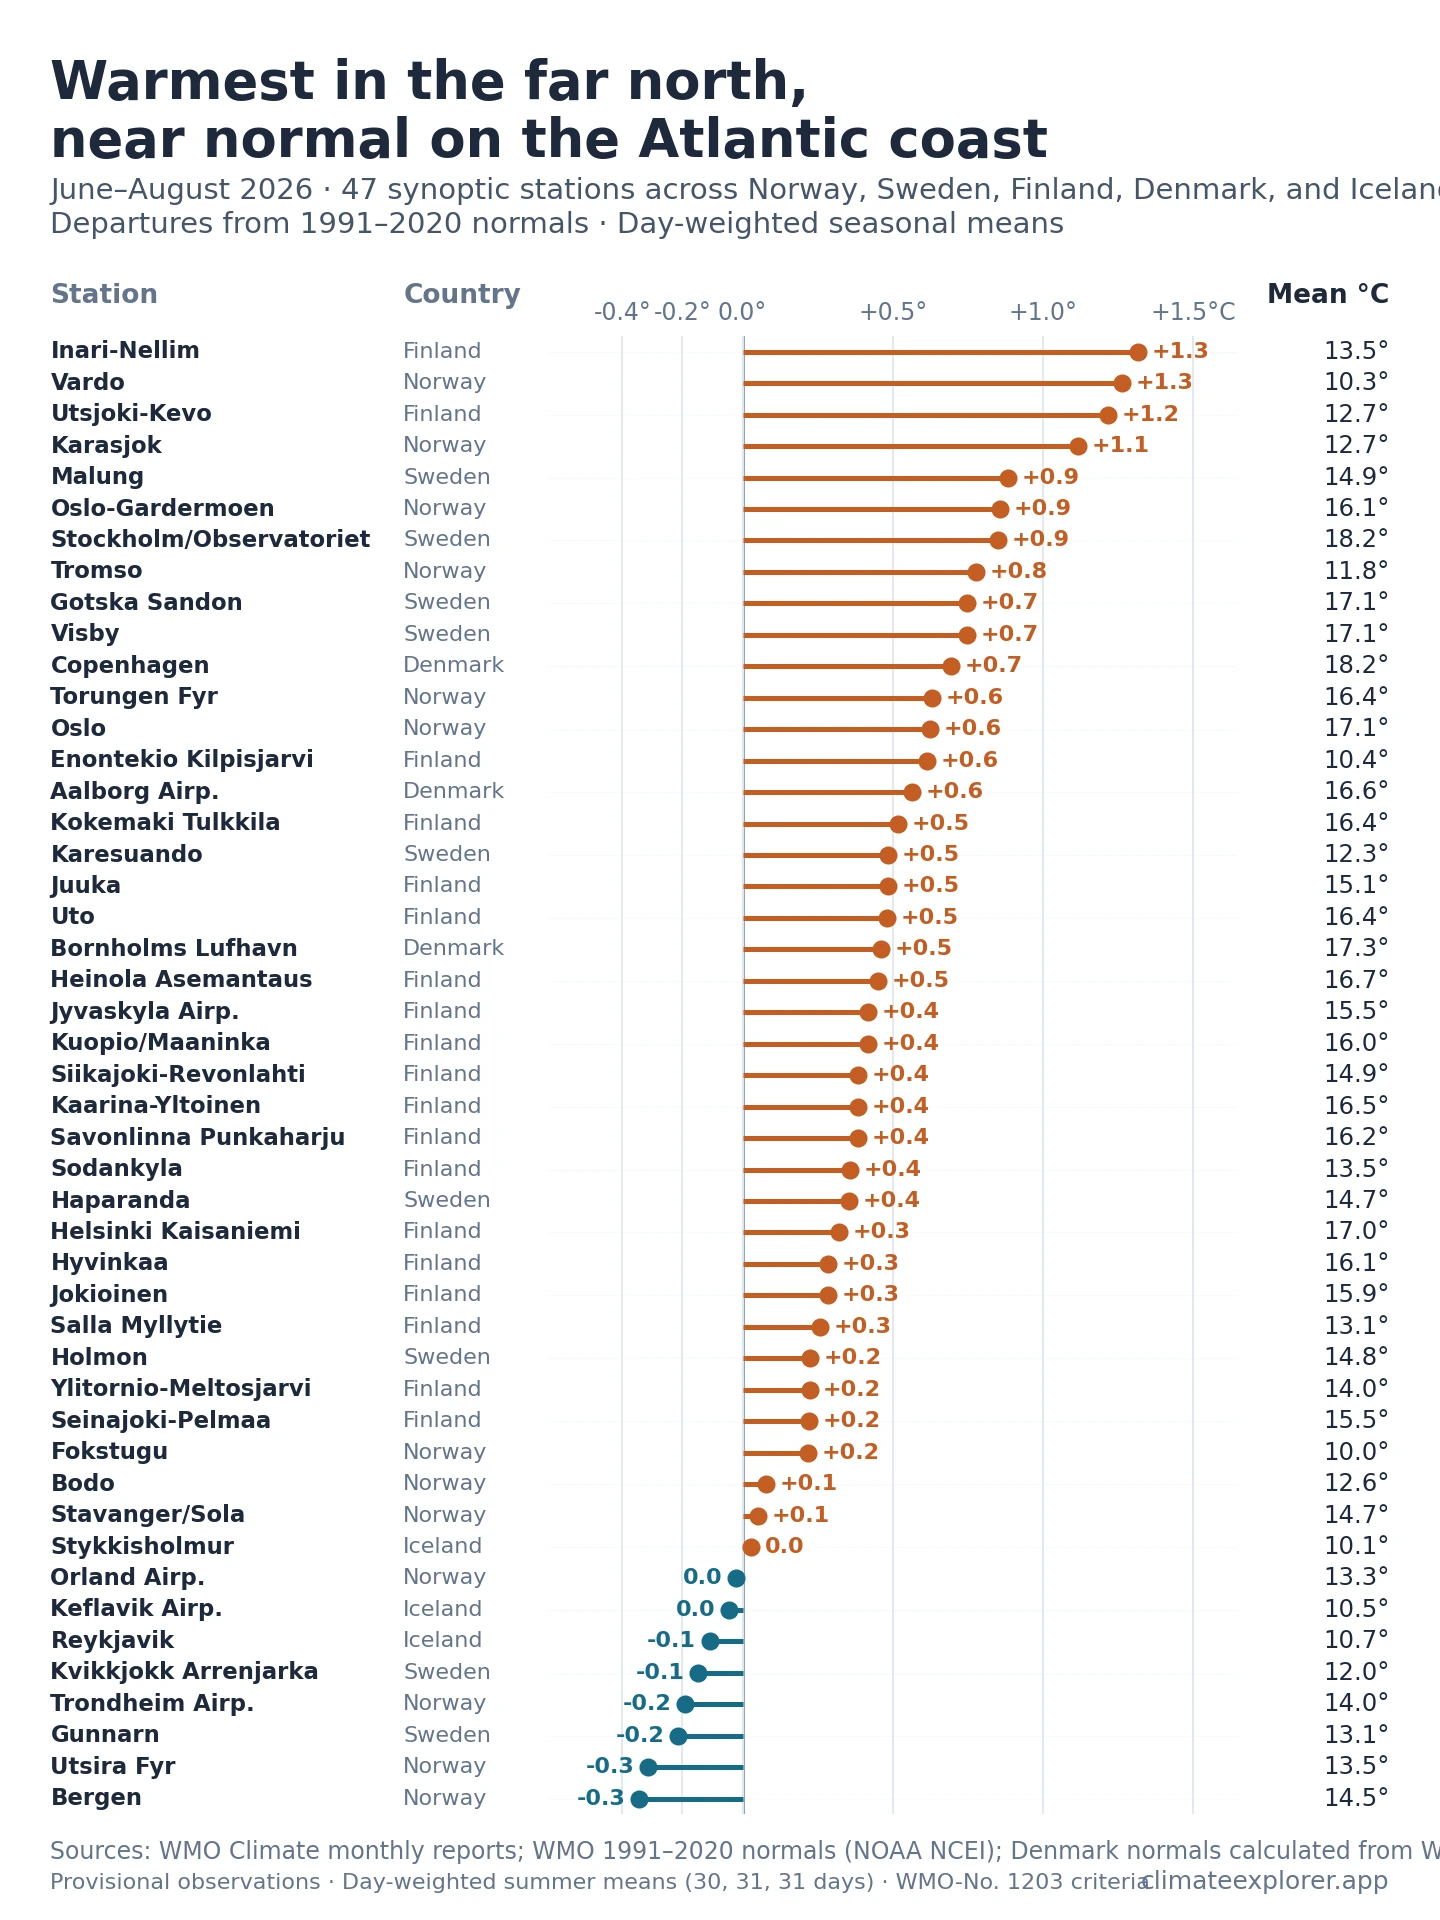
Summer 2026 was warmer than normal at most Nordic weather stations, but not everywhere. Of 47 stations in Norway, Sweden, Finland, Denmark and Iceland, 39 had a June–August mean above their own 1991–2020 normal. The largest departures, +1.1°C to +1.3°C, were in the far north: Inari-Nellim, Vardø, Utsjoki-Kevo and Karasjok. The eight stations below normal were all within 0.4°C of it, most of them on Norway’s Atlantic coast and in south-west Iceland.
Rainfall did not follow a simple north–south line. The wettest stations, at up to 173% of normal, were around the Gulf of Bothnia, in Lapland, at Bodø and in western Iceland. The driest were in Denmark and on Norway’s southern coast, at 69% to 78% of normal.
Each station is compared with its own 1991–2020 normal, so the figures describe named sites, not whole countries. Observations come from monthly reports in WMO Climate and are still provisional.
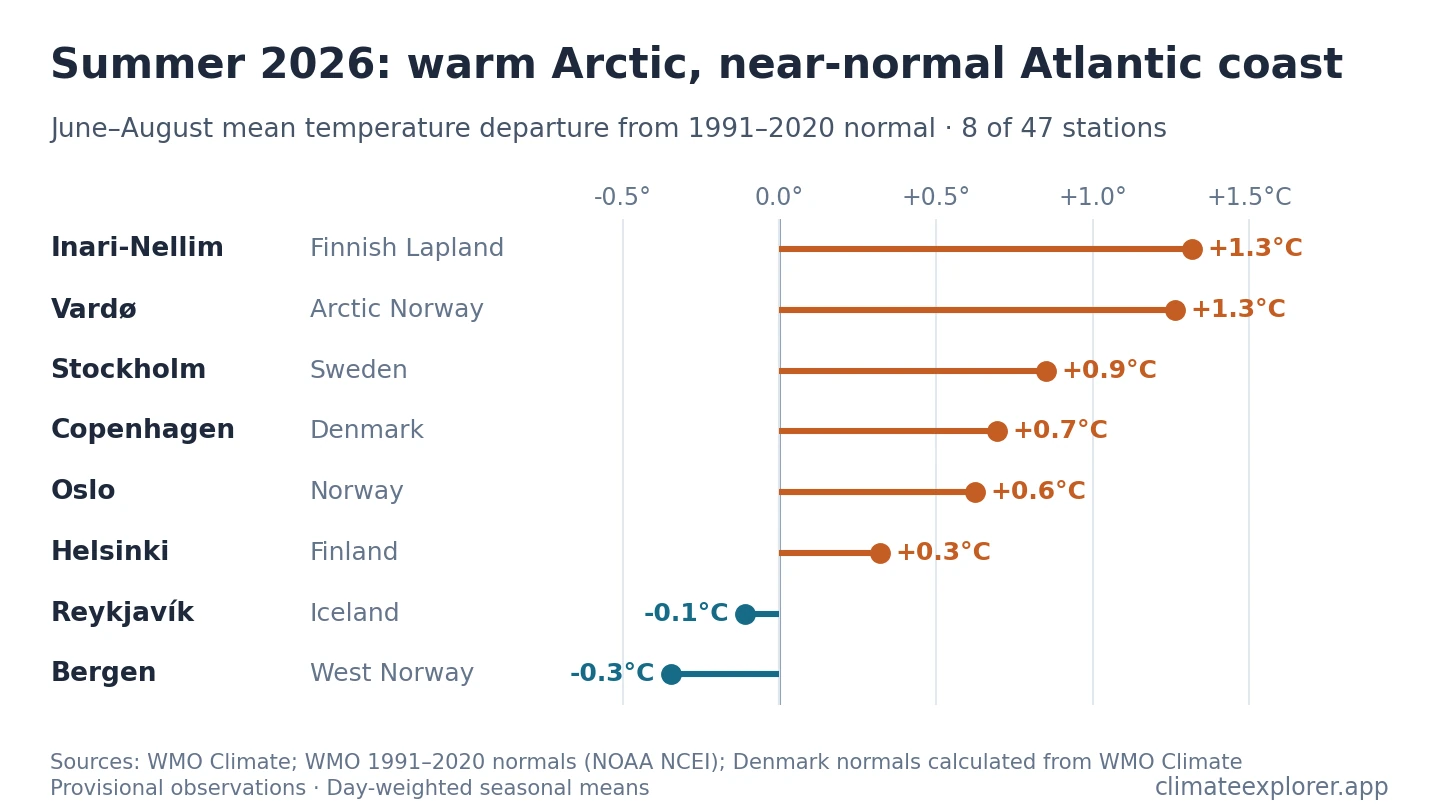
The far north was warmest; the Atlantic coast stayed near normal
The four warmest stations were all well north of the Arctic Circle: Inari-Nellim (WMO ID 02835, +1.3°C), Vardø (01098, +1.3°C), Utsjoki-Kevo (02805, +1.2°C) and Karasjok (01065, +1.1°C). Stockholm (02484, +0.9°C), Copenhagen (06186, +0.7°C) and Oslo (01492, +0.6°C) were also clearly above normal.
Eight stations finished slightly below normal. Four are on Norway’s Atlantic coast: Bergen (01317, −0.3°C), Utsira Fyr (01403, −0.3°C), Trondheim Airport (01271, −0.2°C) and Ørland (01241, 0.0°C). Two are in south-west Iceland: Reykjavík (04030, −0.1°C) and Keflavík (04018, 0.0°C). The other two, Gunnarn (02126, −0.2°C) and Kvikkjokk (02119, −0.1°C), are inland in northern Sweden, so being below normal was not only a coastal pattern.
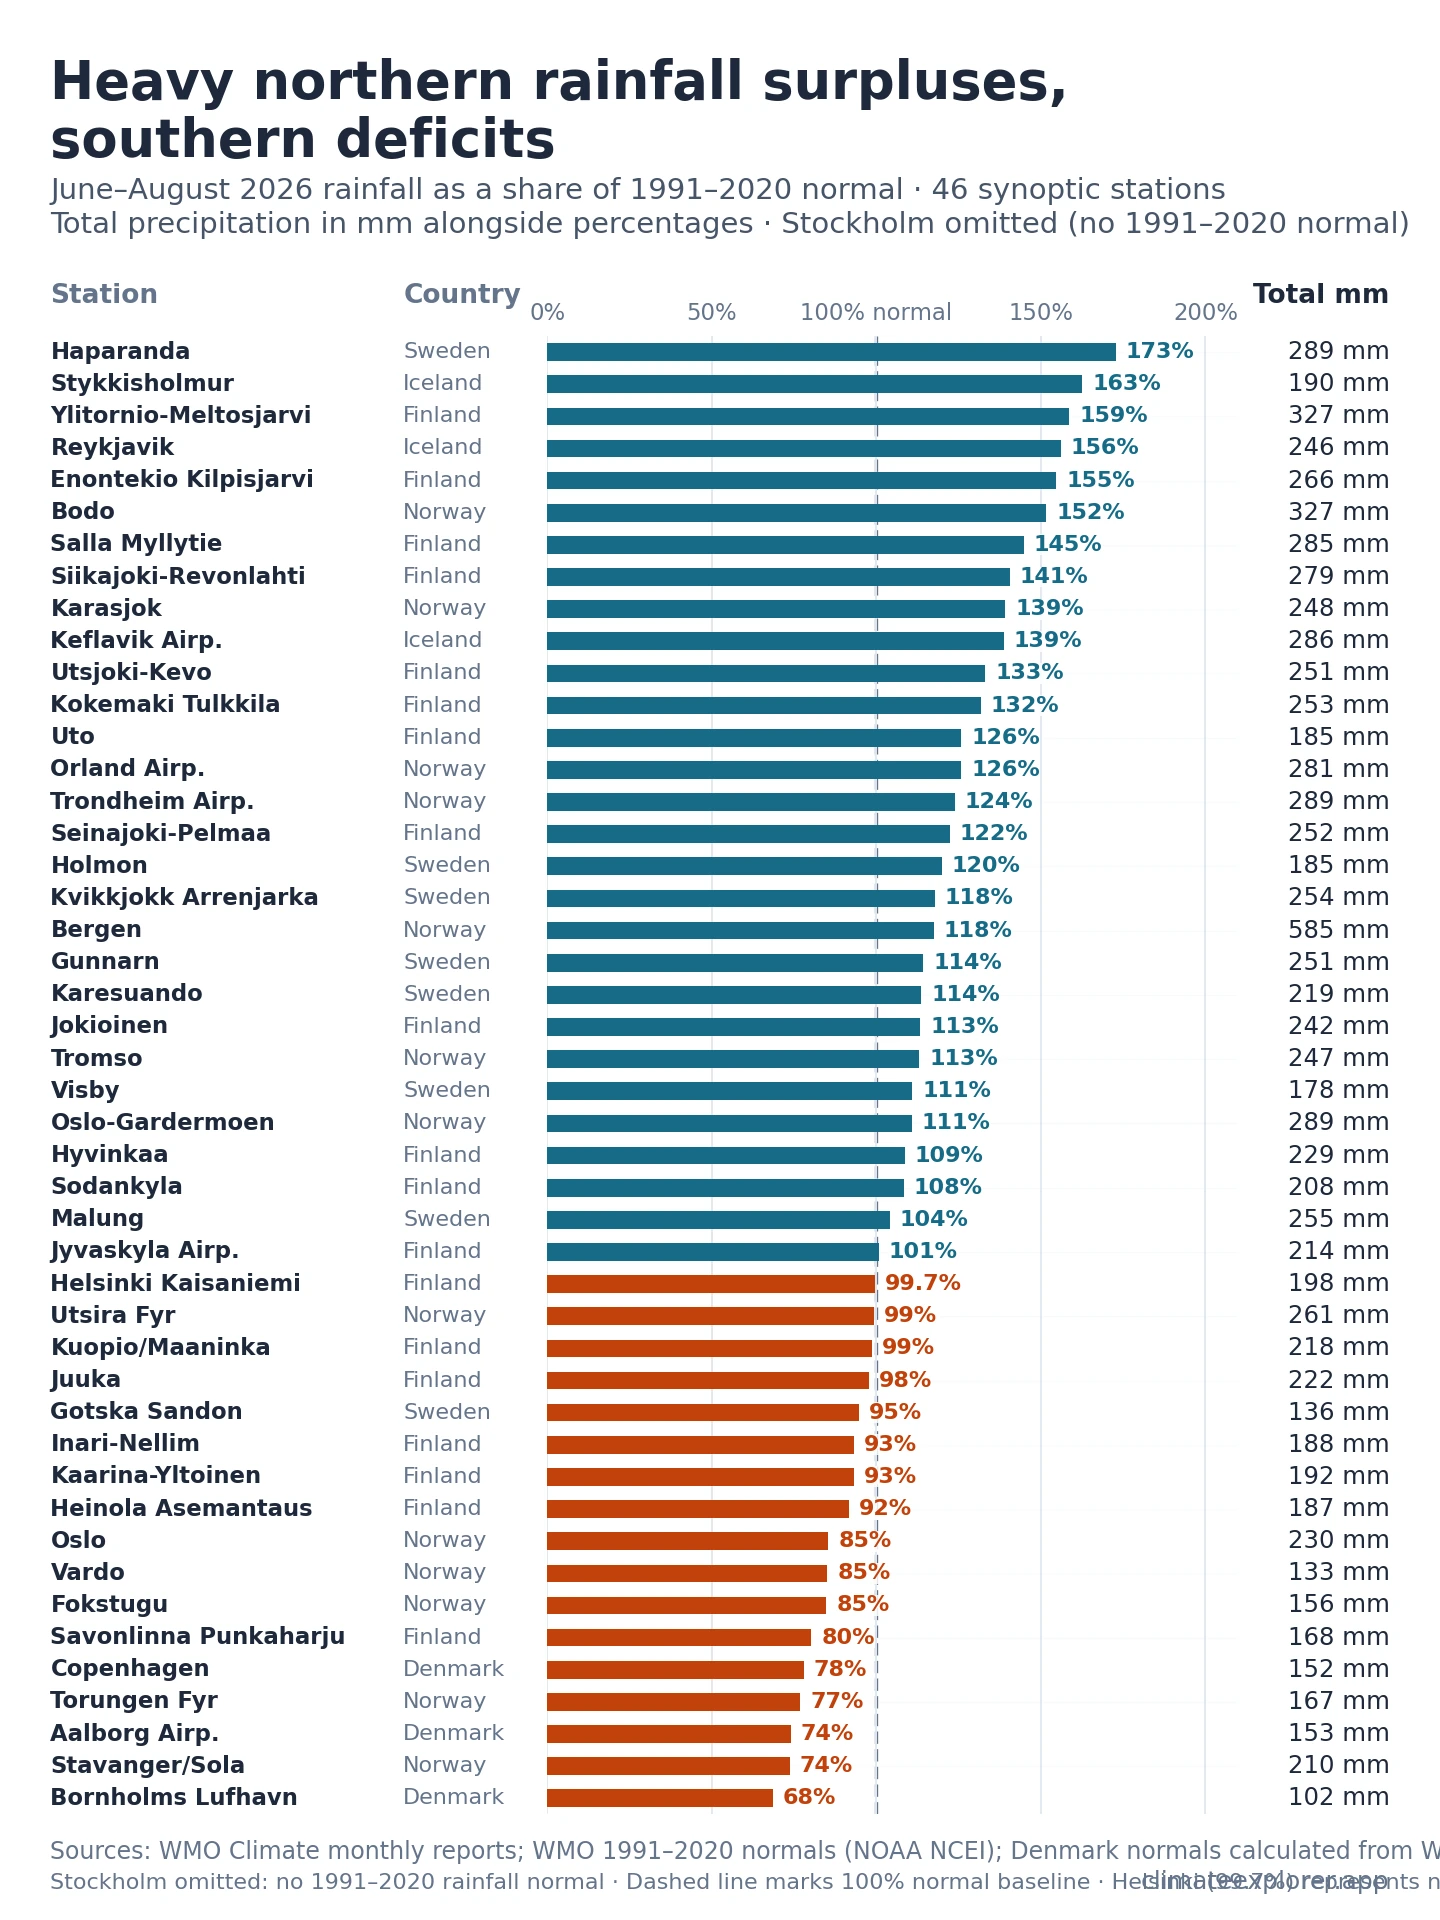
Wet around the Gulf of Bothnia, dry in Denmark and southern Norway
Of the 46 stations with a rainfall normal, 29 received at least their normal summer total. The wettest were Haparanda in northern Sweden (02197, 173%, 289 mm), Stykkishólmur in western Iceland (04013, 163%, 190 mm), Ylitornio-Meltosjärvi in Finnish Lapland (02812, 159%, 327 mm), Reykjavík (156%) and Bodø (01152, 152%). Bergen recorded the largest total, 585 mm, which was 118% of its normal.
The driest stations were in Denmark and along Norway’s southern coast. Bornholms Lufthavn (06190) received 69% of normal, Stavanger/Sola (01415) 74%, Aalborg Airport (06030) 74%, Torungen Fyr (01465) 77% and Copenhagen 78%. So western Norway was split: Bergen was wet, while Stavanger, about 170 km to the south, was dry.
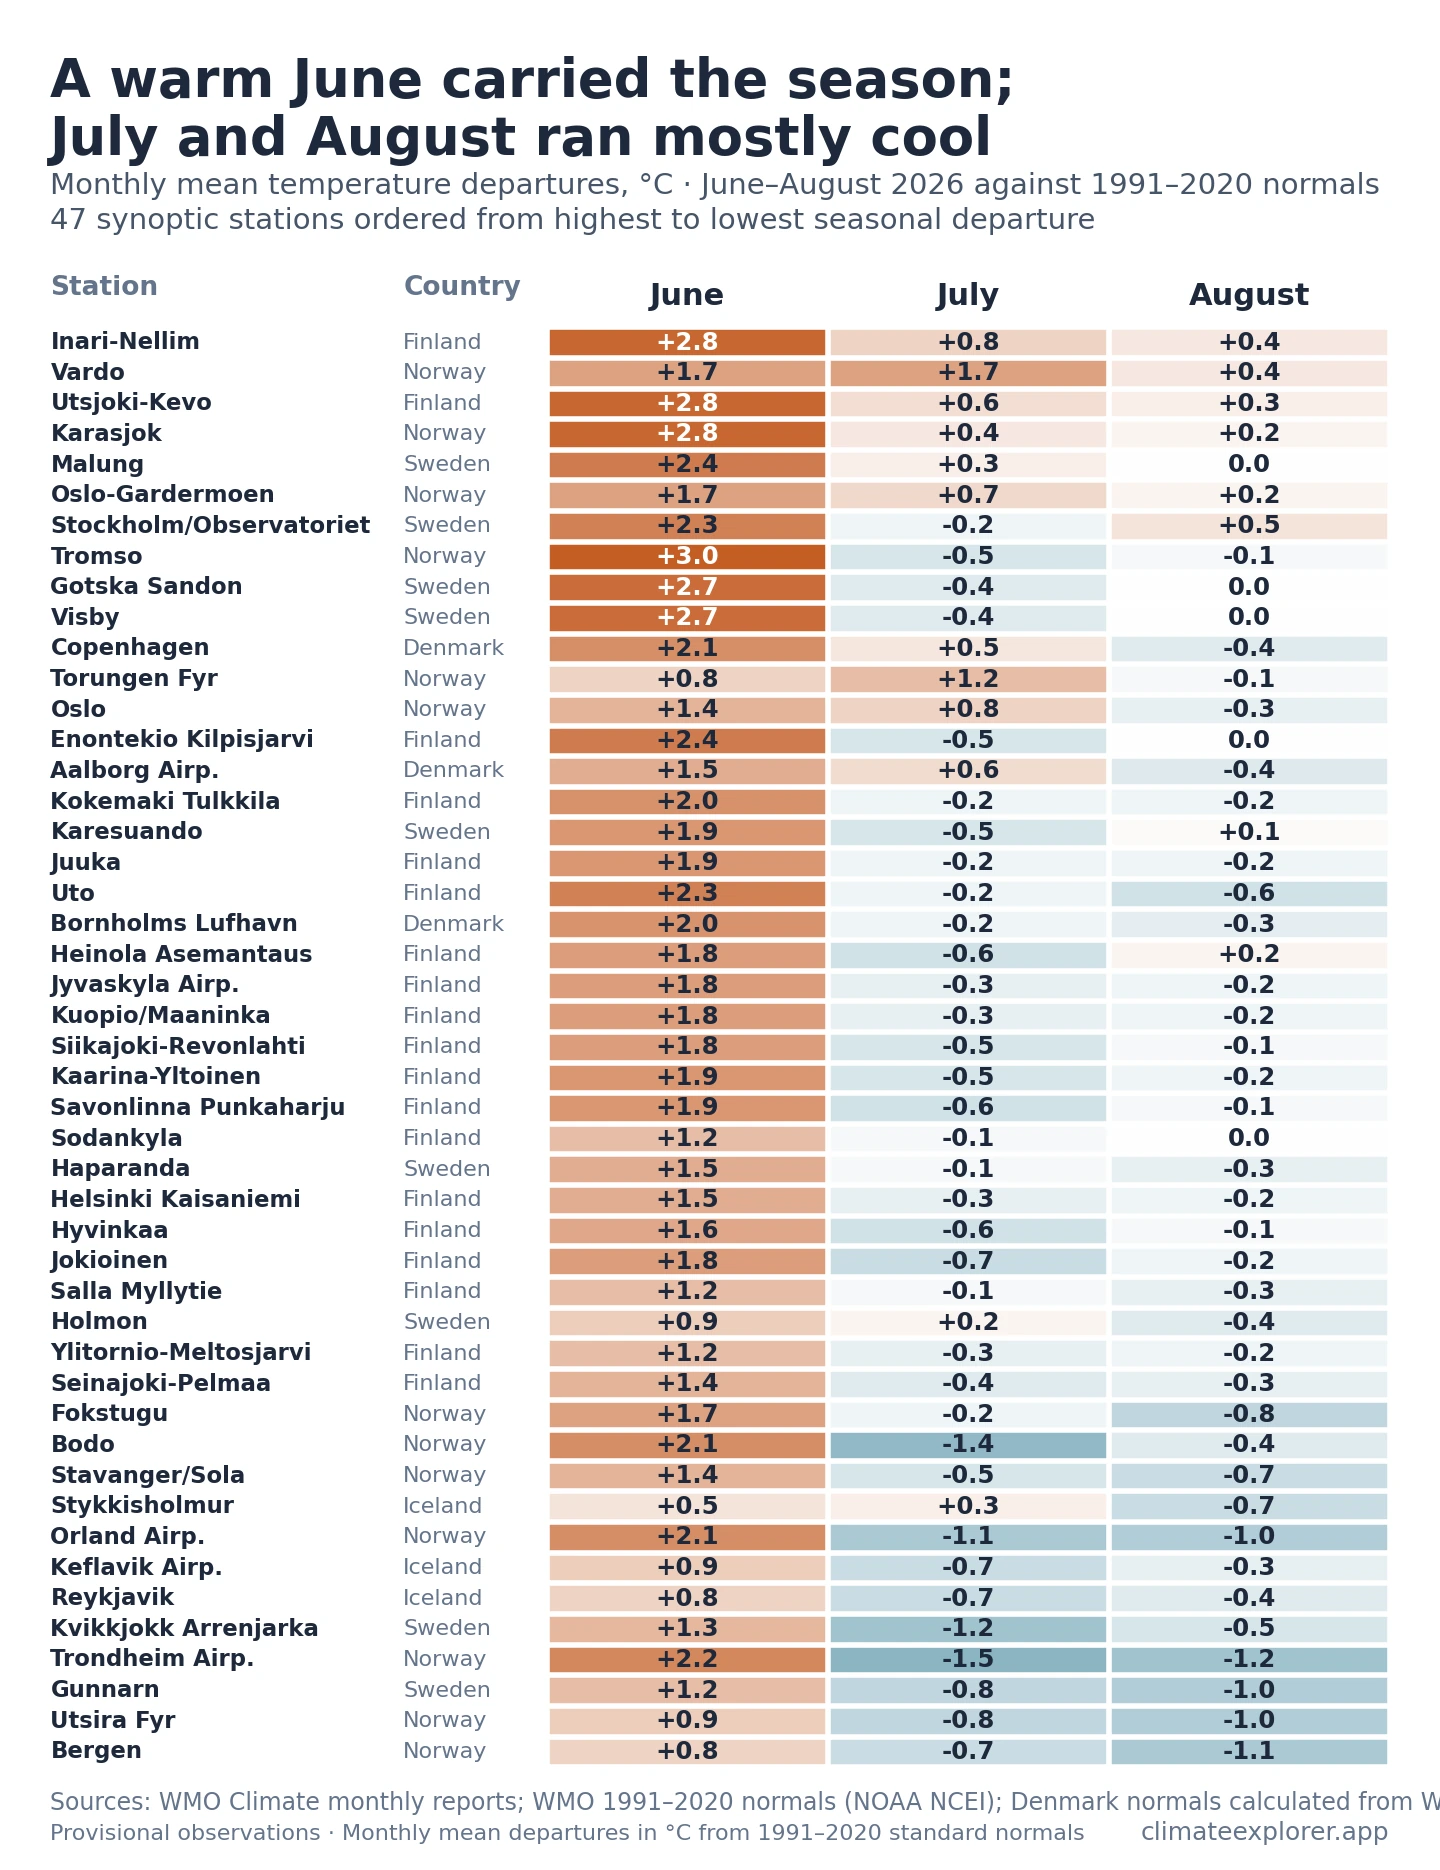
June made the summer warm
The monthly figures show where the seasonal warmth came from. June was above normal at all 47 stations, by +0.5°C to +3.0°C, including +2.8°C at Karasjok and Utsjoki-Kevo, +2.3°C at Stockholm and +2.1°C at Copenhagen.
July and August were different. July was below normal at 35 of the 47 stations and August at 34. At Bergen, a June departure of +0.8°C was followed by −0.7°C in July and −1.1°C in August. Only five stations were above normal in all three months: the four far-northern stations above and Oslo-Gardermoen (01384). For most stations, a warm June outweighed a slightly cool July and August.
Monthly means cannot show what caused these patterns, or how many hot or wet days there were. Explaining them would need daily data and analysis of weather patterns, which this comparison does not include.
How the comparison was made
The comparison uses 47 stations: Norway 13, Sweden 9, Finland 19, Iceland 3 and Denmark 3. All 47 are used for temperature. Stockholm (02484) is left out of the rainfall comparison because it has no matching 1991–2020 rainfall normal, so the rainfall figures cover 46 stations.
Observations are the June, July and August 2026 monthly mean temperatures and rainfall totals from WMO Climate, the archive of monthly CLIMAT reports exchanged through the World Meteorological Organization. Recent months are provisional and may still be revised by national weather services.
For Norway, Sweden, Finland and Iceland, each station is compared with its own official WMO 1991–2020 climate normal, matched by the same WMO station ID (NOAA NCEI accession 0253808, version 2.2, minimum-24-year composites). Denmark’s three stations have no matching normal under the same ID in that collection. For them, 1991–2020 normals were calculated from each station’s own WMO Climate monthly series, following the completeness rules in WMO-No. 1203. Temperature had all 30 years. Rainfall at Bornholms Lufthavn had 24 years for each summer month, the minimum the rules allow.
Summer temperatures are weighted by the number of days in each month (30, 31 and 31) for both observations and normals. Rainfall totals are the sum of the three months, divided by the sum of the three monthly normals.
Explore the inputs: In the WMO Climate Explorer, select Norway → Oslo (01492) or Finland → Sodankylä (02836), open Dashboard → Data, and look at MeanTemp and Precipitation for June–August 2026. In the WMO Normals Explorer, select Norway → OSLO_BLINDERN to see the 1991–2020 normals. Denmark’s calculated normals are not in the Normals Explorer; they are in the monthly CSV below. The WMO Climate guide and WMO Normals guide explain how to select stations and export data.
Period covered: 1 June–31 August 2026. Provisional monthly reports, checked against the source snapshot of 4 October 2026.
Data Annex
Download the seasonal comparison, monthly observations and normals, and station crosswalk. Temperature departures are rounded to one decimal place and rainfall percentages to whole numbers.
| Station | Country | Mean °C | Normal °C | Departure °C | Rain mm | Normal rain mm | Rain % of normal |
|---|---|---|---|---|---|---|---|
| Inari-Nellim | Finland | 13.5 | 12.2 | +1.3 | 188 | 202.0 | 93 |
| Vardø | Norway | 10.3 | 9.1 | +1.3 | 133 | 156.2 | 85 |
| Utsjoki-Kevo | Finland | 12.7 | 11.5 | +1.2 | 251 | 188.6 | 133 |
| Karasjok | Norway | 12.7 | 11.6 | +1.1 | 248 | 178.2 | 139 |
| Stockholm / Observatoriet | Sweden | 18.2 | 17.4 | +0.9 | 152 | — | — |
| Copenhagen | Denmark | 18.2 | 17.5 | +0.7 | 152 | 194.8 | 78 |
| Oslo | Norway | 17.1 | 16.5 | +0.6 | 230 | 269.2 | 85 |
| Karesuando | Sweden | 12.3 | 11.8 | +0.5 | 219 | 192.6 | 114 |
| Sodankylä | Finland | 13.5 | 13.1 | +0.4 | 208 | 192.1 | 108 |
| Helsinki / Kaisaniemi | Finland | 17.0 | 16.7 | +0.3 | 198 | 198.6 | 100 |
| Reykjavík | Iceland | 10.7 | 10.8 | -0.1 | 246 | 157.7 | 156 |
| Bergen | Norway | 14.5 | 14.9 | -0.3 | 585 | 497.7 | 118 |
| Station | Country | June °C | July °C | August °C |
|---|---|---|---|---|
| Inari-Nellim | Finland | +2.8 | +0.8 | +0.4 |
| Vardø | Norway | +1.7 | +1.7 | +0.4 |
| Utsjoki-Kevo | Finland | +2.8 | +0.6 | +0.3 |
| Karasjok | Norway | +2.8 | +0.4 | +0.2 |
| Stockholm / Observatoriet | Sweden | +2.3 | -0.2 | +0.5 |
| Copenhagen | Denmark | +2.1 | +0.5 | -0.4 |
| Oslo | Norway | +1.4 | +0.8 | -0.3 |
| Karesuando | Sweden | +1.9 | -0.5 | +0.1 |
| Sodankylä | Finland | +1.2 | -0.1 | 0.0 |
| Helsinki / Kaisaniemi | Finland | +1.5 | -0.3 | -0.2 |
| Reykjavík | Iceland | +0.8 | -0.7 | -0.4 |
| Bergen | Norway | +0.8 | -0.7 | -1.1 |
| Station | Country | Provider WMO ID | WIGOS ID | Latitude °N | Longitude °E | Elevation m | Baseline Source |
|---|---|---|---|---|---|---|---|
| Inari-Nellim | Finland | 02835 | 0-20000-0-02835 | 68.85 | 28.30 | 123 | WMO 1991–2020 Normals (NCEI) |
| Vardø | Norway | 01098 | 0-20000-0-01098 | 70.37 | 31.10 | 15 | WMO 1991–2020 Normals (NCEI) |
| Utsjoki-Kevo | Finland | 02805 | 0-20000-0-02805 | 69.76 | 27.02 | 107 | WMO 1991–2020 Normals (NCEI) |
| Karasjok | Norway | 01065 | 0-20000-0-01065 | 69.46 | 25.50 | 131 | WMO 1991–2020 Normals (NCEI) |
| Stockholm / Observatoriet | Sweden | 02484 | 0-20000-0-02484 | 59.35 | 18.07 | 44 | WMO 1991–2020 Normals (TAVG only; PRCP omitted) |
| Copenhagen | Denmark | 06186 | 0-208-0-06186 | 55.69 | 12.54 | 9 | Calculated 1991–2020 Baseline (WMO-No. 1203) |
| Oslo | Norway | 01492 | 0-20000-0-01492 | 59.94 | 10.72 | 97 | WMO 1991–2020 Normals (NCEI) |
| Karesuando | Sweden | 02081 | 0-20000-0-02081 | 68.44 | 22.44 | 332 | WMO 1991–2020 Normals (NCEI) |
| Sodankylä | Finland | 02836 | 0-20000-0-02836 | 67.37 | 26.63 | 179 | WMO 1991–2020 Normals (NCEI) |
| Helsinki / Kaisaniemi | Finland | 02978 | 0-20000-0-02978 | 60.18 | 24.94 | 4 | WMO 1991–2020 Normals (NCEI) |
| Reykjavík | Iceland | 04030 | 0-20000-0-04030 | 64.13 | -21.90 | 61 | WMO 1991–2020 Normals (NCEI) |
| Bergen | Norway | 01317 | 0-20000-0-01317 | 60.38 | 5.33 | 36 | WMO 1991–2020 Normals (NCEI) |
Data Sources
- WMO Climate monthly observation archive: monthly mean temperature and precipitation totals for June, July, and August 2026.
- WMO 1991–2020 Climatological Standard Normals: NOAA NCEI accession 0253808, version 2.2, minimum-24-year primary parameter composites for Norway, Sweden, Finland, and Iceland.
- WMO-No. 1203: Guidelines on the Calculation of Climate Normals: standard criteria used for calculating Denmark’s 1991–2020 baseline series.
- WMO CLIMAT reporting templates and guidelines: parameter encoding and international exchange specifications.