September 2026 in European Capitals: Warmth Continued
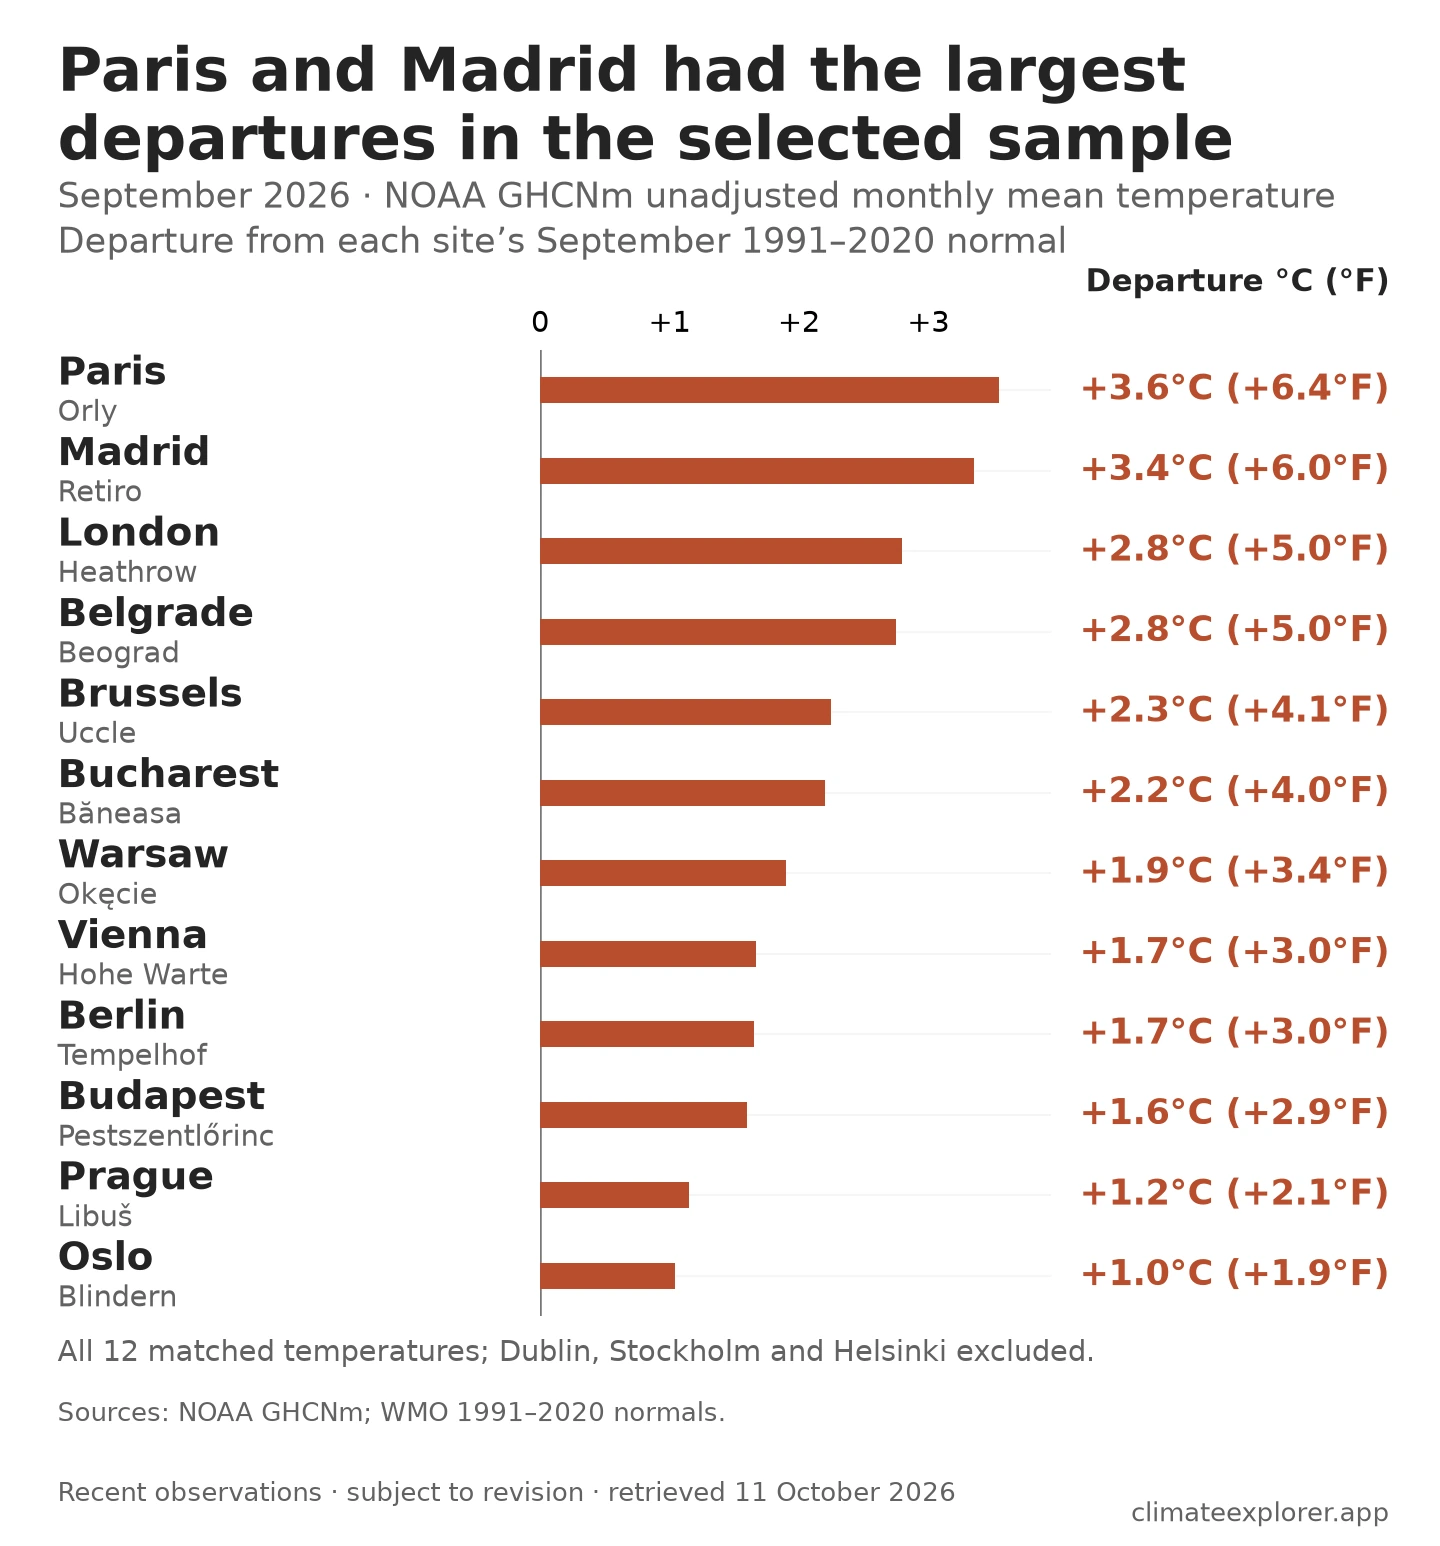
September stayed warmer than usual at all 12 European capital stations in this comparison. Rainfall told a different story: Budapest’s station received very little rain, while Prague’s recorded more than twice its usual September amount.
Here, “usual” means each station’s September average for 1991–2020, known as a climate normal. In the temperature charts, a departure is the difference from that normal. The observations describe named weather stations, including airports, rather than averages across entire cities.
The rainfall totals here measure precipitation: rain and any snow or other frozen forms expressed as an amount of water.
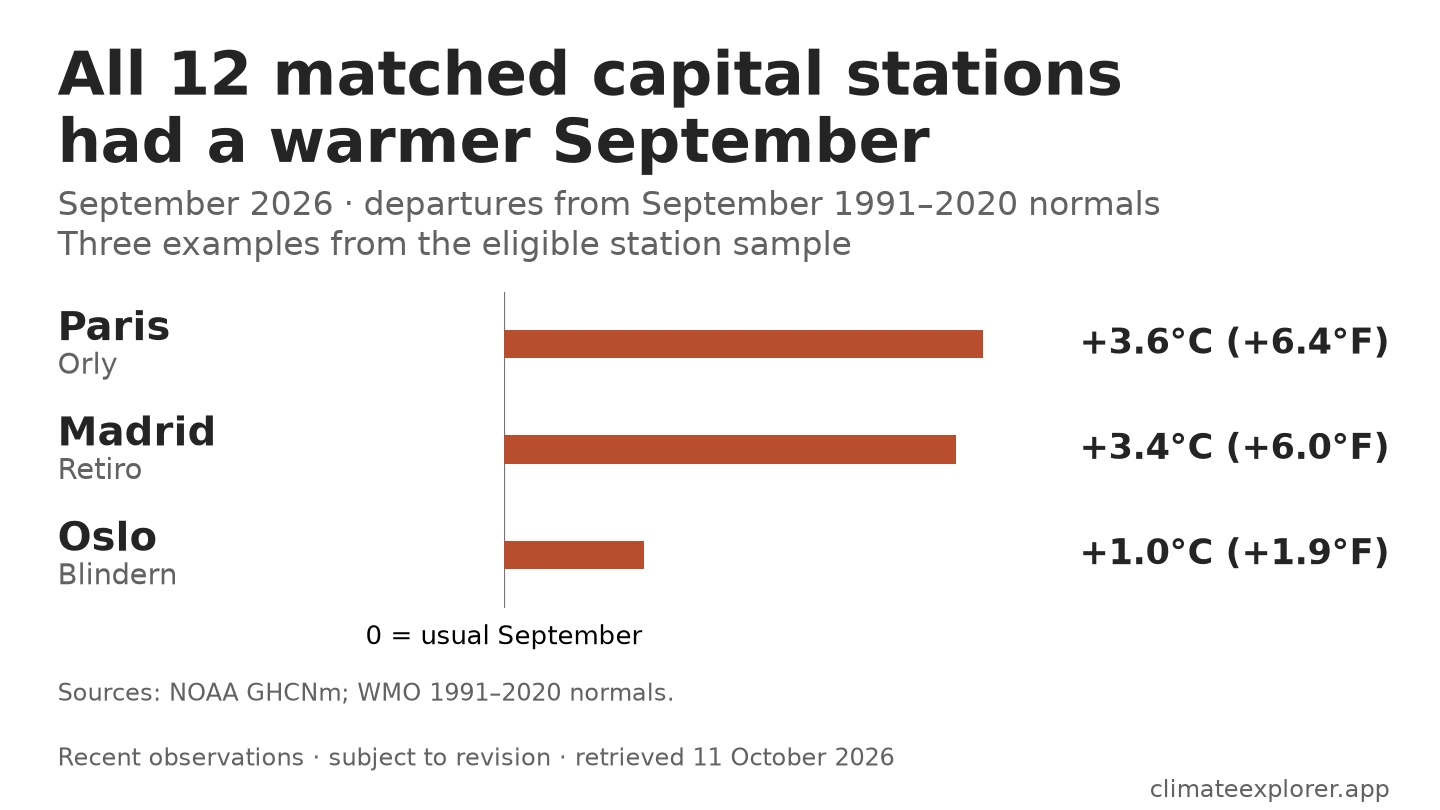
Madrid–Retiro was warmest; Paris–Orly was furthest above normal
Madrid–Retiro had the highest September average in this group, 24.6°C (76.2°F). Paris–Orly averaged 20.1°C (68.1°F). These are monthly means, not the highest temperatures reached during the month.
But Madrid normally has a warmer September. Compared with each station’s own usual conditions, Orly was further above normal: +3.6°C (+6.4°F), against +3.4°C (+6.0°F) at Retiro. That distinction helps separate a place’s warmer climate from an unusually warm month.
The two differences from normal were close. Their ordering should not be read as a meaningful ranking of whole-city climates; the station metadata limitations are explained in the annex. The broader finding is clearer: all 12 stations were warmer than their own September normal.
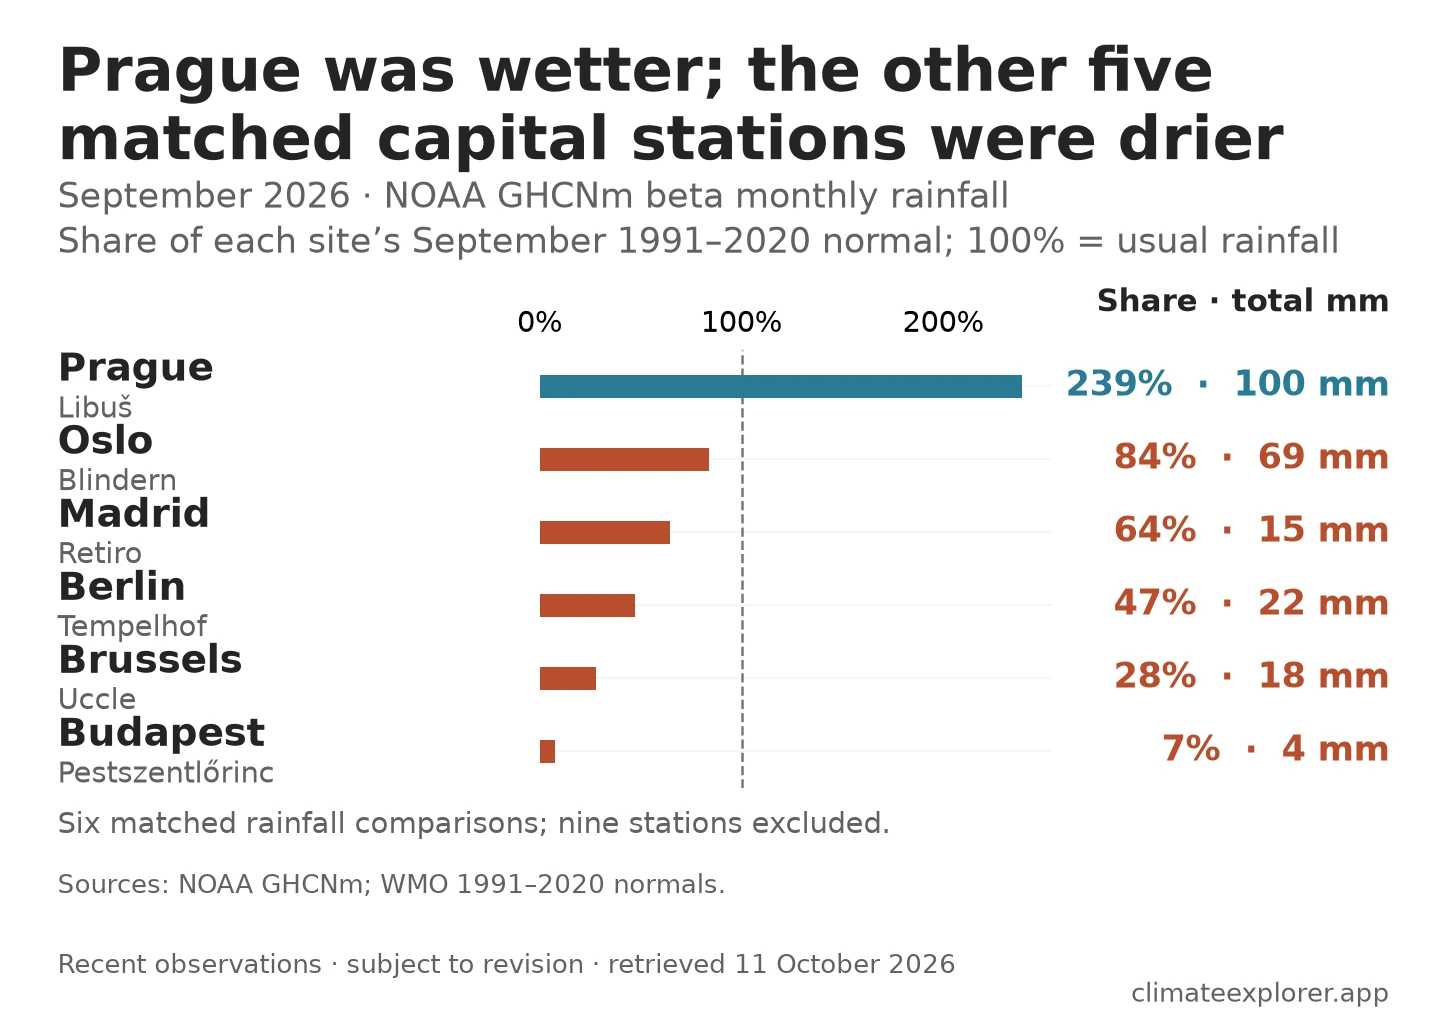
Very little rain at Budapest; more than twice usual at Prague
Budapest–Pestszentlőrinc reported just 3.7 mm of precipitation, compared with a September normal of 51.3 mm—about 7% of its usual total. Brussels–Uccle was also well below normal, receiving about a quarter of its usual September total (28%).
Prague–Libuš went the other way. Its 99.9 mm was about 2.4 times its normal of 41.8 mm (239%). Prague was the only one of the six rainfall stations above normal; Berlin, Madrid and Oslo also finished below their usual amounts.
Percentages make places with different precipitation climates easier to compare, while the millimetre totals show how much actually fell. These station observations alone do not establish drought or flooding.
How September compared with summer
Warmth continued, but its difference from usual conditions changed between summer and September. Five of the 12 stations were further above their September normal than they had been above their summer normal; seven were closer to normal.
Bucharest–Băneasa is one example. Its summer average was about 0.6°C (1.0°F) above normal; September was 2.2°C (4.0°F) above normal. Madrid’s difference also grew, while Budapest’s narrowed. This compares how unusual the warmth was for each season—not whether September was hotter than summer.
| Station | June–August above normal, °C (°F) | September above normal, °C (°F) |
|---|---|---|
| Bucharest–Băneasa | +0.6 (+1.0) | +2.2 (+4.0) |
| Madrid–Retiro | +2.5 (+4.5) | +3.4 (+6.0) |
| Budapest–Pestszentlőrinc | +2.4 (+4.3) | +1.6 (+2.9) |
For this seasonal comparison, both periods were calculated from the same NOAA temperature series. The original summer article used a different observation source, so its figures can differ from the summer values shown here. The annex explains the sources and calculations.
For another view of the month, read the Nordic September comparison. The Vienna September article examines a short hot spell rather than a full-month average.
Explore the comparison
The September comparison CSV contains the station observations and their local normals. The WMO Normals Explorer lets you inspect the published reference averages. Exact station identifiers and steps for checking the numbers are in the annex.
Conclusion
At these 12 capital stations, September remained warmer than usual. Rainfall was much less consistent: Budapest and Brussels had low totals, while Prague exceeded twice its normal September amount. The month’s warmth was shared across the temperature sample; the rainfall experience depended much more on location.
Period covered: 1–30 September 2026. Source data checked on 11 October 2026; recent monthly observations may be revised. A monthly report does not establish that every contributing day was observed.
Data Annex
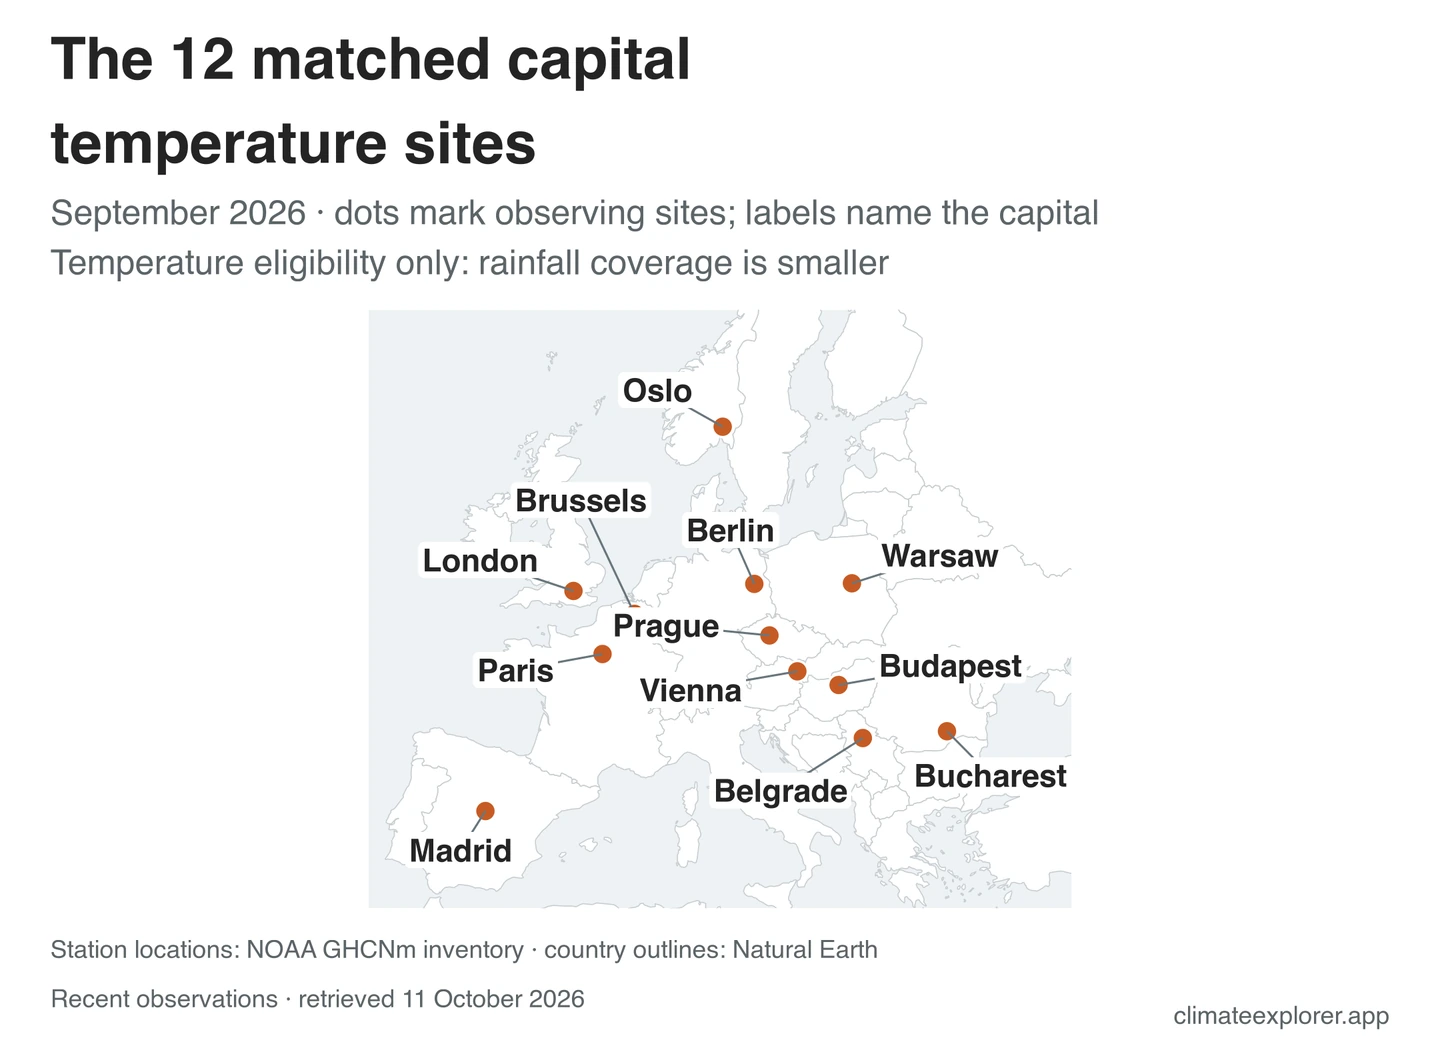
The starting selection was the 15 sites in the summer article. Twelve qualified for temperature and six for rainfall. Dublin Airport and Stockholm’s selected station lacked an accepted September temperature match. Helsinki’s available Ilmala record was not substituted for the Kaisaniemi reference site.
Temperature departures subtract the September normal from the observed monthly mean. Rainfall percentages divide the reported total by the September normal and multiply by 100. The June–August temperature comparison weights monthly means and normals by the number of days in each month. Missing observations are not filled in.
The monthly totals report total precipitation, including the water equivalent of frozen forms. They do not identify how much fell as rain, snow or another form. No snowfall event or phase proportion is inferred here.
NOAA’s monthly precipitation product is a beta release. Totals carrying a quality flag or a reported missing-day measurement flag were excluded: Vienna’s rainfall record indicated one missing day and Belgrade’s two. Even a blank flag can mean that missing-day information was unavailable, so this is not a certification of daily completeness.
Matching station names and identifiers does not prove an unchanged observing location or exposure. Observation and normal coordinates differ by about 2.9 km at Orly and 28 km at Warsaw; Vienna also has differing metadata. Removing all three leaves nine of nine retained temperature sites above normal, with Retiro having the largest departure in that reduced group. The broad warmth is more robust than the precise ordering of the leading stations.
The normal references are NCEI’s version 2.2, minimum-24-year composites. Their year-count rule depends on the supplied metadata; NCEI assumes 30 years where year counts were not supplied. These references and NOAA’s source-processing choices do not make the paired series a homogeneous climate-trend record.
Downloads: monthly inputs and departures, station identifiers and metadata, and coverage and exclusions. In the comparison CSV, summer temperature fields use the recalculated NOAA series; the summer rainfall field is retained from the earlier WMO Climate analysis and is not used for a rainfall-change claim.
Station identifiers
WIGOS is a globally unique station identifier; WMO is the legacy station code. These verified identifiers identify the sites discussed above; the full crosswalk supplies NOAA identifiers and separate observation and normal metadata.
- Oslo–Blindern: WIGOS 0-20000-0-01492.
- Madrid–Retiro: WIGOS 0-20000-0-08222.
- Prague–Libuš: WIGOS 0-20000-0-11520.
- Brussels–Uccle: WIGOS 0-20000-0-06447.
- Bucharest–Băneasa: WIGOS 0-20000-0-15420.
- Paris–Orly: WMO 07149; no WIGOS identifier was supplied in the normal metadata.
- London–Heathrow: WMO 03772; no WIGOS identifier was supplied in the normal metadata.
- Budapest–Pestszentlőrinc: WMO 12843; no WIGOS identifier was supplied in the normal metadata.
The WIGOS values are from the verified normal metadata. Their source-backed NOAA associations are recorded in the crosswalk; an identifier match does not establish an unchanged observing location.
Verify the exact observations
Download the September station comparison to inspect observations, reference values and eligibility. For example, Orly is WMO station 07149, paired with NOAA station FRM00007149. Its reported mean is 20.05°C (68.09°F) and its September normal 16.5°C (61.7°F).
Open the WMO Normals Explorer, select France and the Orly station with that identifier, then read September under Mean Temperature. The normals guide explains station selection and the reference columns.
The observations here use NOAA’s quality-controlled, unadjusted QCU temperature archive. The GHCNm Explorer currently displays adjusted QCF temperature, so use this article’s CSV and the upstream archive to check the exact observations. The GHCNm guide explains that distinction.
Selected station metadata
These examples use NOAA observation-inventory coordinates and elevations. These are provider-listed surface observing stations; an urban/rural classification was not independently audited. The full crosswalk records the normal-site metadata separately; WIGOS identifiers below come from the normal metadata, with WMO identifiers used where no WIGOS identifier was supplied.
| Station | WMO / WIGOS | NOAA temperature ID | Latitude, longitude | Elevation (m) |
|---|---|---|---|---|
| Orly | 07149 | FRM00007149 | 48.7250, 2.3590 | 88.7 |
| Retiro | 0-20000-0-08222 | SP000003195 | 40.4117, -3.6781 | 667.0 |
| Pestszentlőrinc | 12843 | HUM00012843 | 47.4330, 19.1830 | 139.0 |
| Libuš | 0-20000-0-11520 | EZM00011520 | 50.0000, 14.4500 | 303.7 |
Selected September values
Monthly means, departures and eligible rainfall values for the same examples are shown below. A dash means no eligible rainfall comparison. The downloadable comparison contains every candidate station, rainfall values, flags and eligibility.
| Station | Mean, °C (°F) | Normal, °C (°F) | Departure, °C (°F) | Precipitation (mm) | Precipitation normal (mm) | Precipitation (% of normal) |
|---|---|---|---|---|---|---|
| Orly | 20.1 (68.1) | 16.5 (61.7) | +3.6 (+6.4) | — | — | — |
| Retiro | 24.6 (76.2) | 21.2 (70.2) | +3.4 (+6.0) | 15.2 | 23.6 | 64 |
| Pestszentlőrinc | 18.5 (65.3) | 16.9 (62.4) | +1.6 (+2.9) | 3.7 | 51.3 | 7 |
| Libuš | 15.9 (60.5) | 14.7 (58.5) | +1.2 (+2.1) | 99.9 | 41.8 | 239 |
Data Sources
WMO precipitation measurement guidance, section6.1.1: liquid and frozen forms are expressed as water depth or water equivalent.
NOAA GHCNm v4 precipitation product paper: monthly totals, source datasets and published output documentation.
NOAA GHCNm unadjusted monthly temperature archive: September and June–August monthly means; the downloaded release was produced on 10 October 2026.
NOAA GHCNm monthly precipitation station files and precipitation format and missing-day flags.
NOAA GHCNm product description: temperature processing and beta precipitation status.
WMO 1991–2020 mean-temperature normals, NCEI accession 0253808, version 2.2 and precipitation normals.
NCEI normal archive and completeness conventions, NOAA station inventory with WMO associations, and DWD WMO Climate station metadata.