Summer 2026 in European capitals: warmth and rainfall
Every station in this comparison of 15 European capitals had a warmer June–August than its own 1991–2020 average. The largest departure was at Paris–Orly, +4.0°C, followed by London–Heathrow at +3.3°C. Rainfall told a less uniform story: Budapest’s selected station received about one-fifth of its usual summer total, while several others finished close to normal.
These are comparisons between named weather stations, not averages across entire cities. A climate normal is a reference average for a stated period—here, 1991–2020. Comparing each station with its own normal helps separate places that are usually hot from places that experienced the greatest additional warmth. The observations come from DWD’s recent monthly CLIMAT archive and remain provisional.
The hottest station was not the furthest above normal
Paris–Orly, an airport station with provider WMO ID 07149, averaged 23.6°C across the three months. London–Heathrow (03772) averaged 21.4°C. Their departures from normal were the largest in this selected group, although Madrid–Retiro had the highest actual summer mean in the group.
That distinction belonged to Madrid–Retiro: its mean was 27.6°C, with a departure of +2.5°C. Its WIGOS ID, 0-20000-0-08222, is a globally unique station identifier; the shorter provider ID is 08222. The higher absolute temperature and smaller departure answer different questions: how warm it was, and how far it differed from that station’s usual summer.
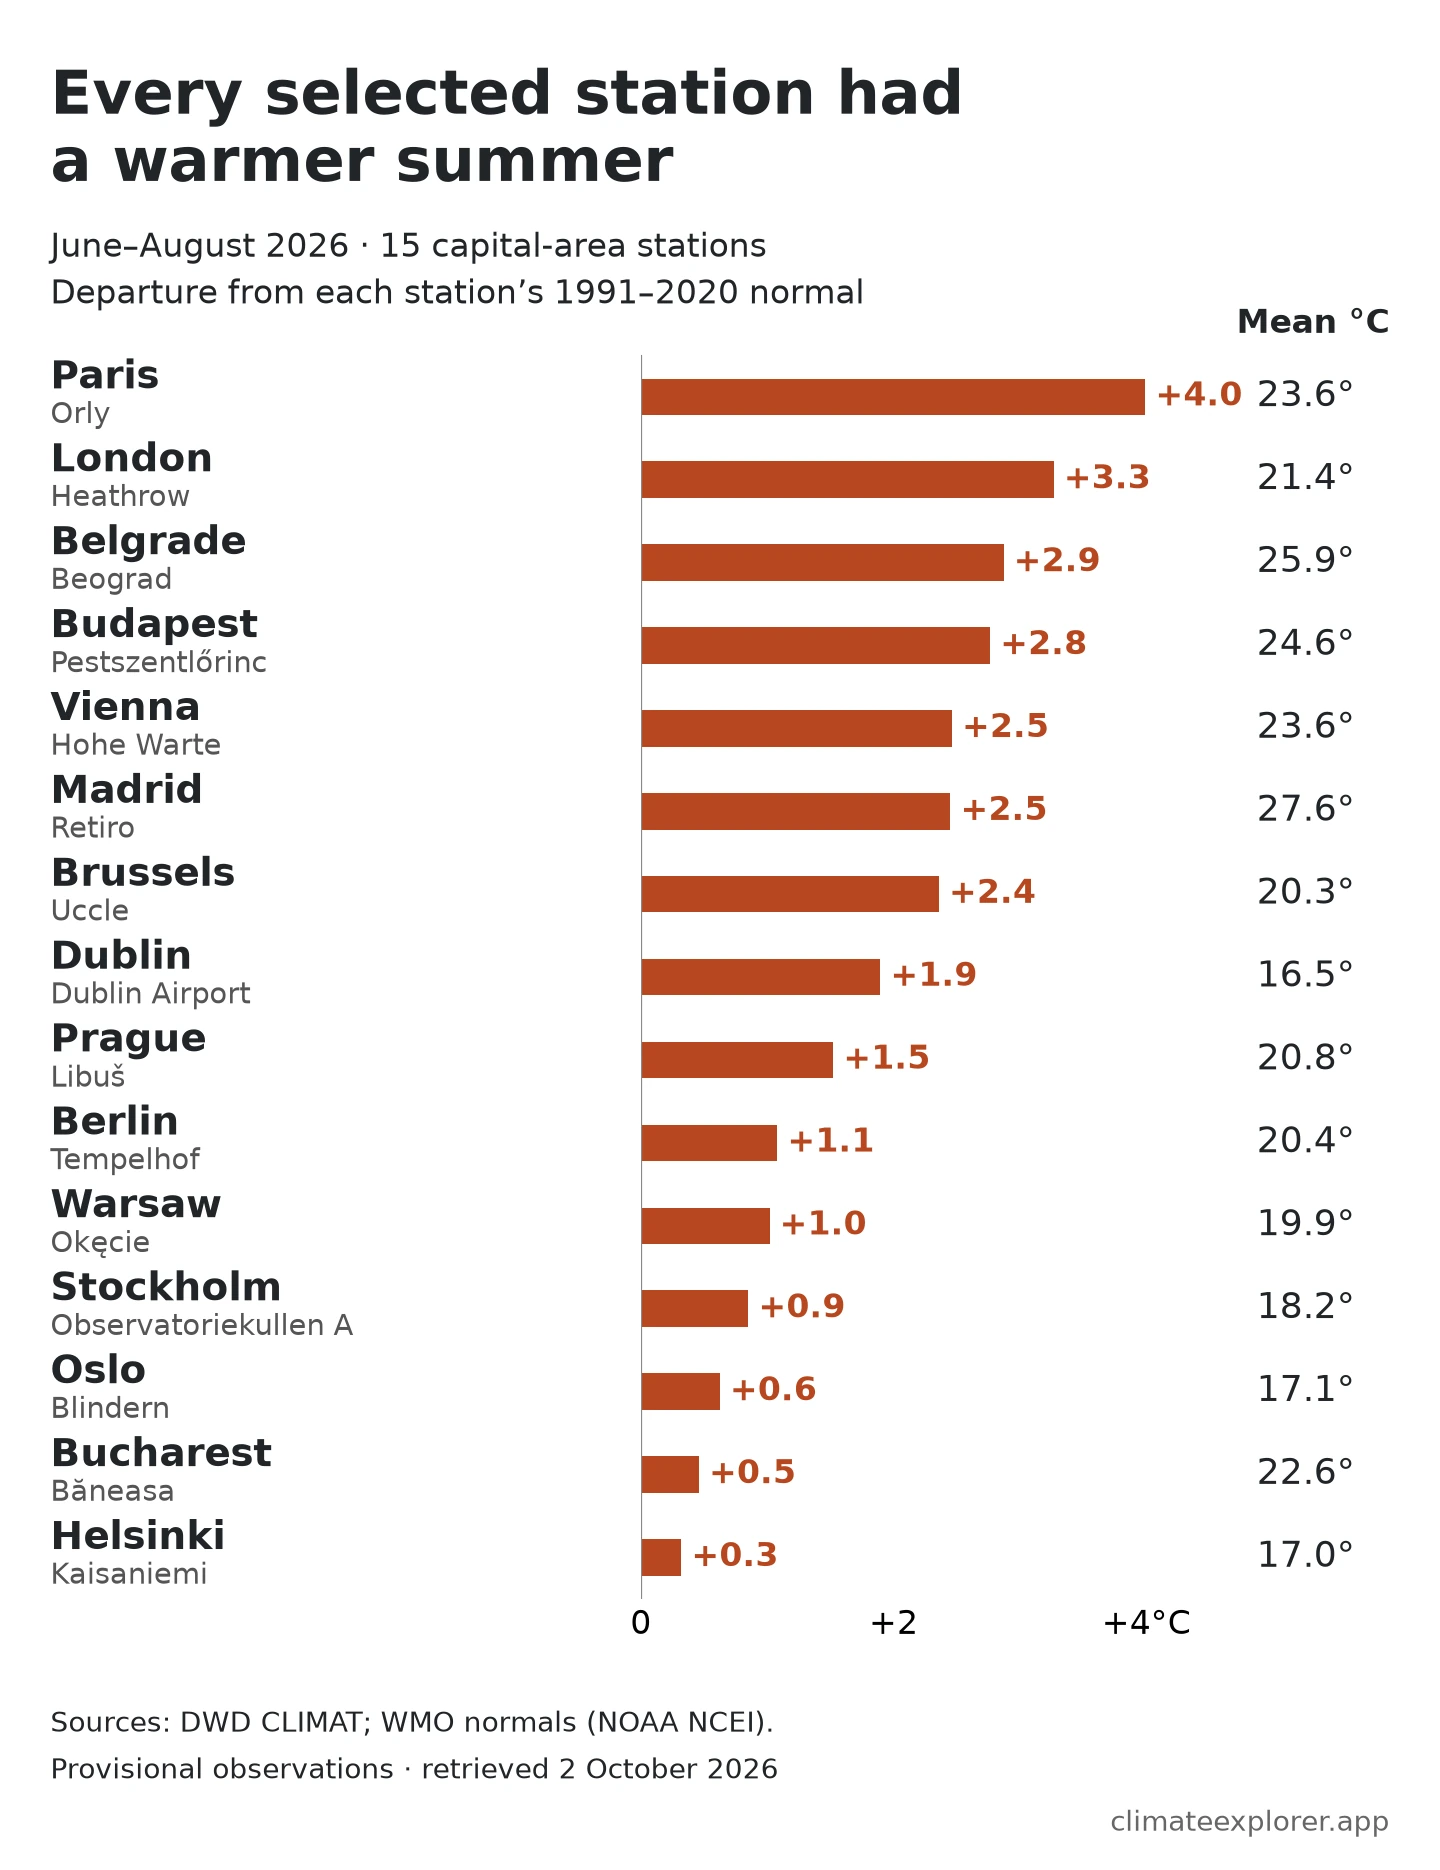
At the other end of the comparison, Helsinki–Kaisaniemi (WIGOS 0-20000-0-02978, provider ID 02978) was 0.3°C above normal. The range is substantial, but it does not establish which station experienced its rarest or most damaging summer. Those questions require longer distributions or evidence about impacts.
A warmer summer did not mean three warmer months everywhere
June was above normal at all 15 stations. In July, five fell below their own monthly reference: the selected stations in Berlin, Stockholm, Helsinki, Warsaw and Bucharest. Oslo and Helsinki were below normal in August. Each still finished the three-month season above its summer reference.
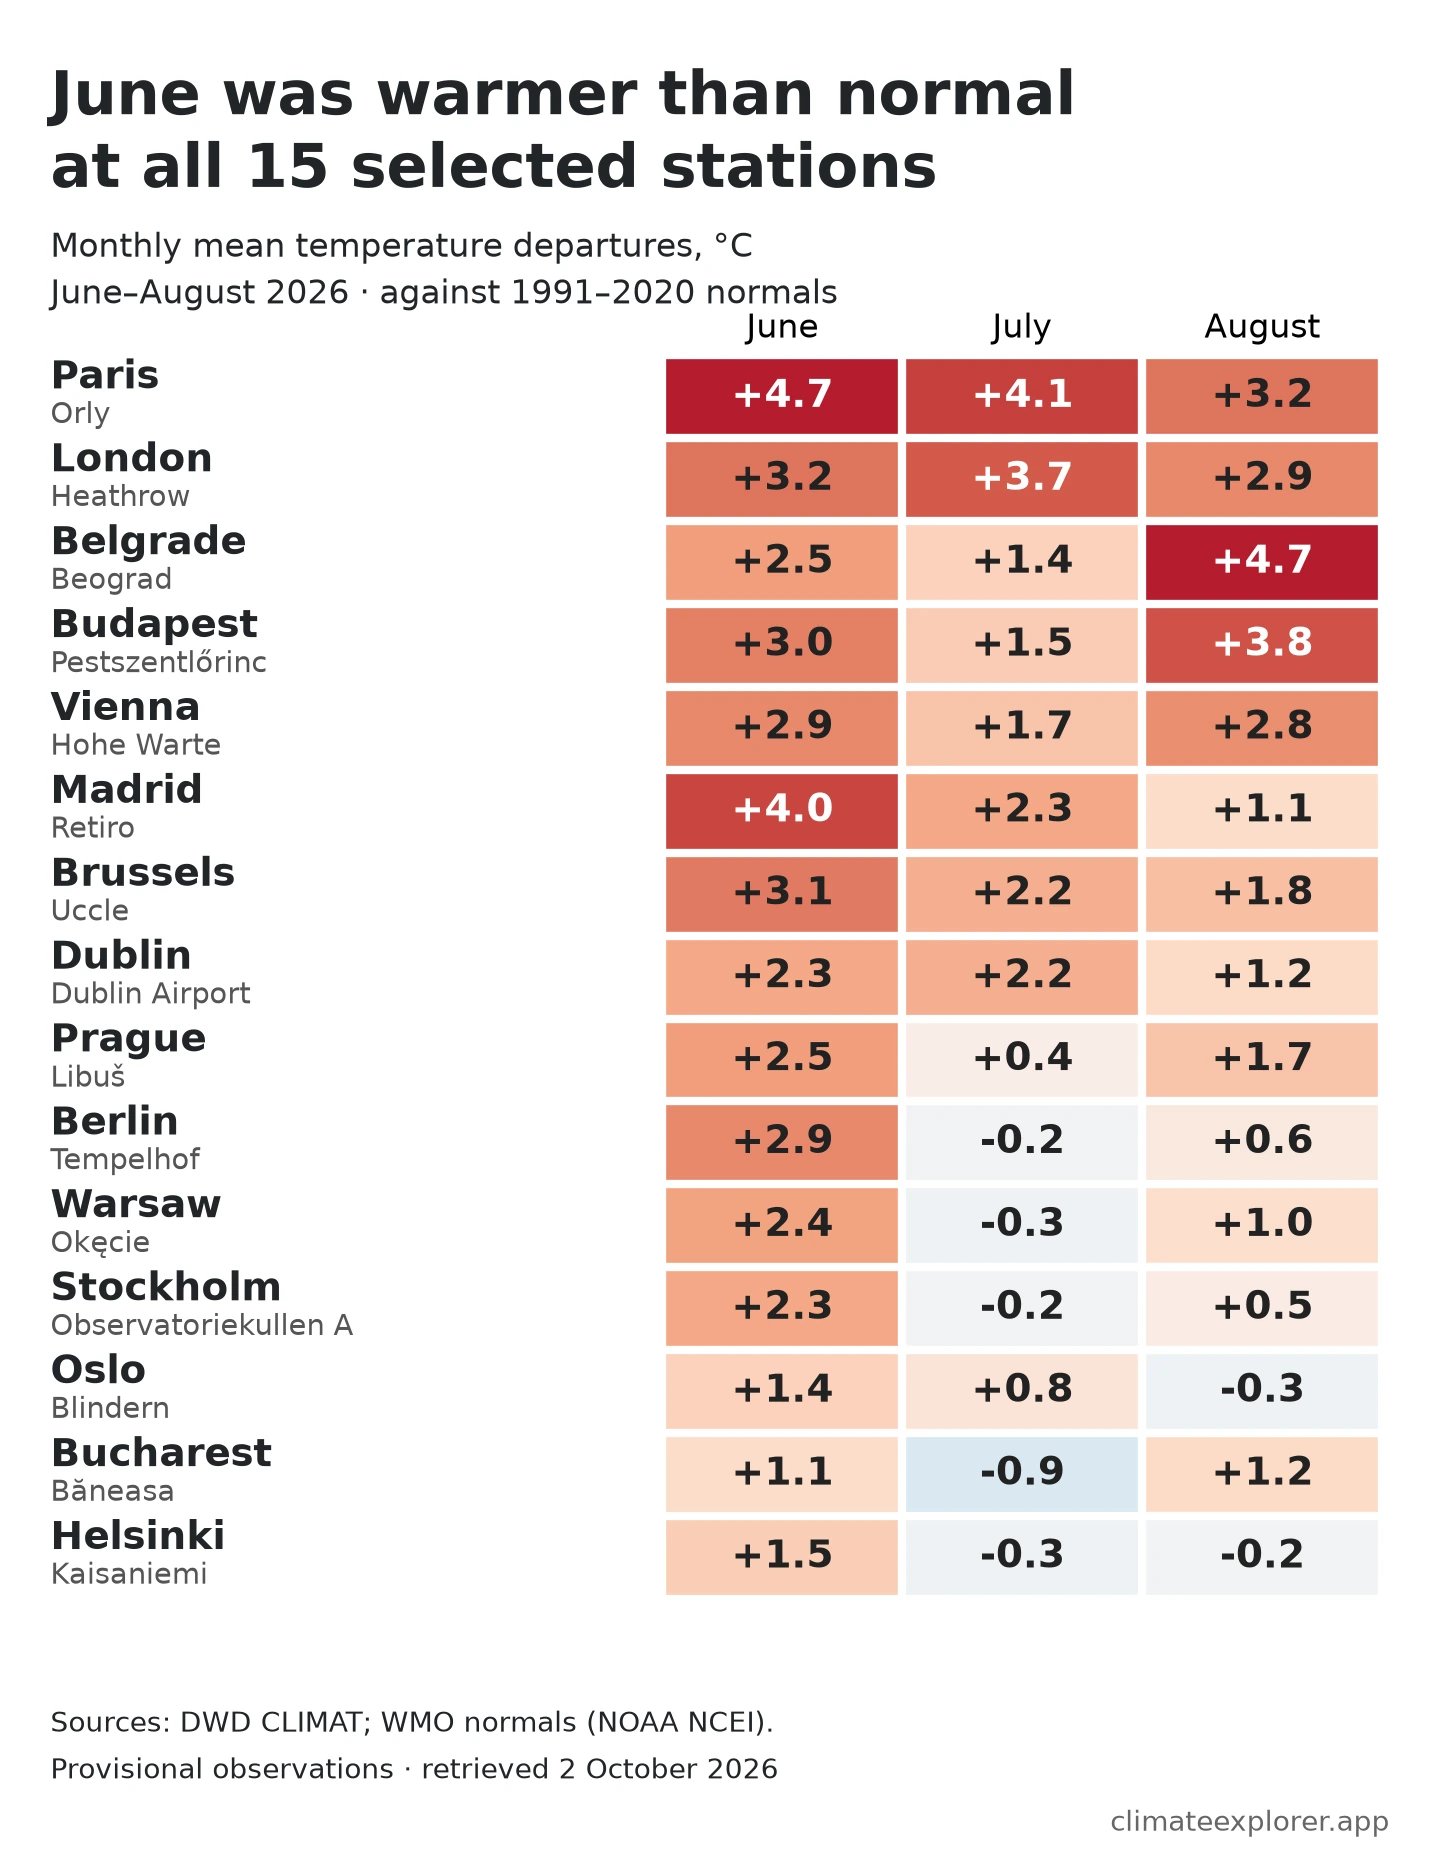
The monthly view shows why a seasonal average cannot describe the timing of individual heatwaves. A warm June can outweigh a cooler July; monthly means cannot tell us how many consecutive hot days occurred. This comparison measures the season and its component months, rather than the day-by-day experience.
Rainfall ranged from a large shortfall to above normal
Budapest–Pestszentlőrinc (provider ID 12843) recorded 43 mm, compared with a summer normal of 197.7 mm—about 22% of normal. Paris–Orly received 63 mm, or 38% of normal.
Warsaw–Okęcie (WIGOS 0-20000-0-12375, provider ID 12375) recorded 255 mm, about 123% of normal. Its identifiers and station name match across the datasets, but the source coordinates disagree; that qualification matters and is retained in the methods below.
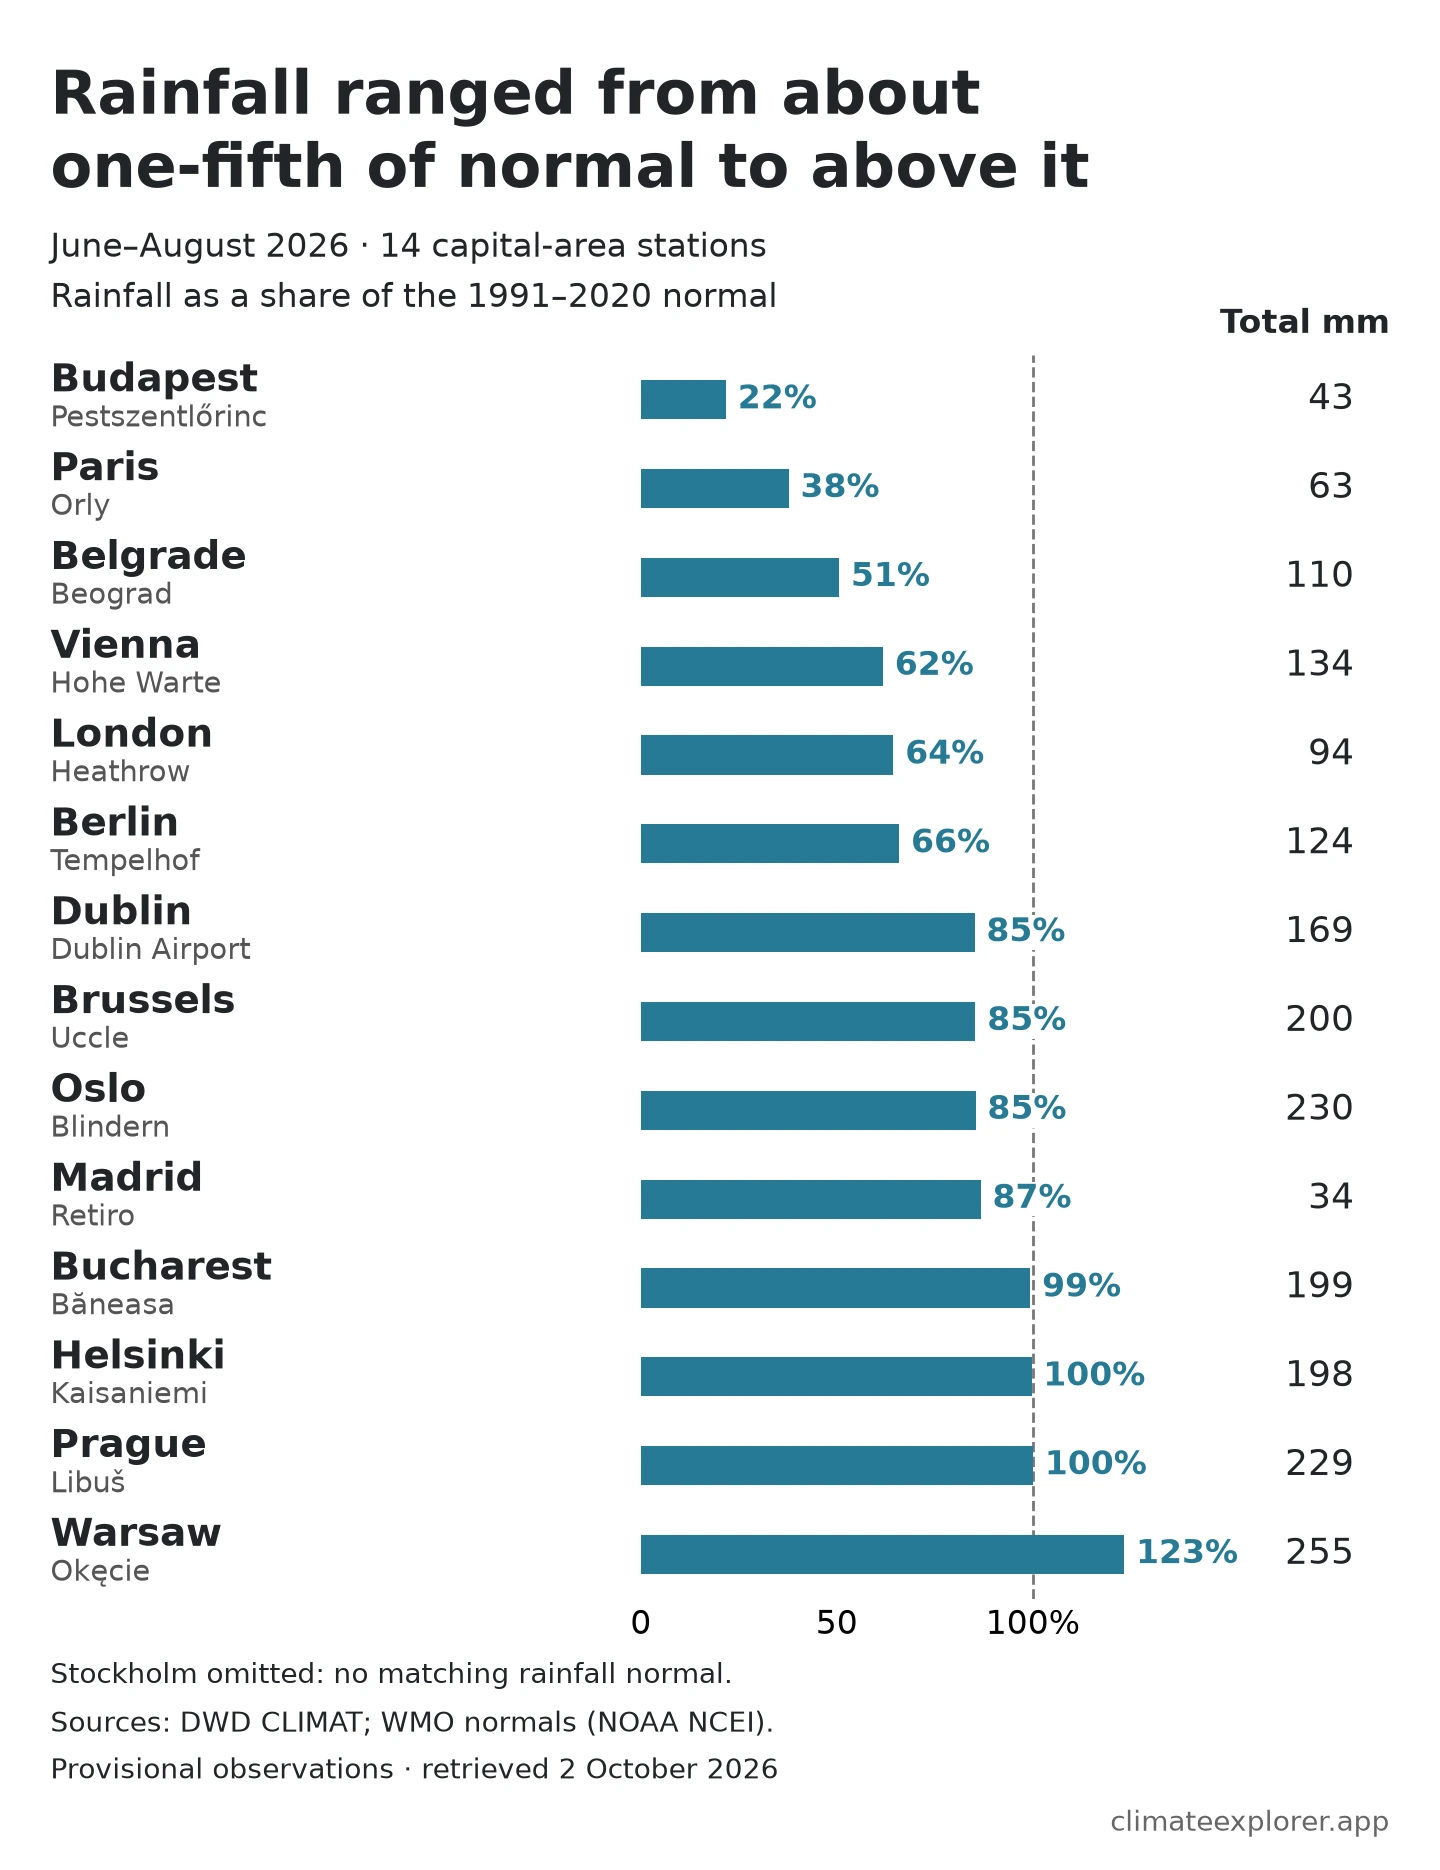
The selected stations in Prague, Bucharest and Helsinki finished close to their normal rainfall totals. Percentages help compare places with different usual rainfall, while the millimetre totals show how much actually fell. Neither a seasonal deficit nor a surplus, by itself, establishes drought or flooding.
Stockholm is absent from the rainfall chart because its selected station, 02484, has no matching precipitation normal in the composite used here. Another Stockholm station’s normal was not substituted.
How the comparison was made
The analysis uses June, July and August 2026 monthly mean temperatures and precipitation totals from DWD, paired by station identifier with the corresponding WMO 1991–2020 normals hosted by NOAA NCEI. Temperature averages use the number of days in each month—30, 31 and 31—for both observations and normals. Rainfall amounts are added across the three months; the observed total is then divided by the normal total.
One station was retained for each capital, with all three monthly reports and matching temperature normals. The audited candidates for Amsterdam, Rome, Copenhagen, Lisbon and Athens did not provide qualifying matches in these two source products. This is a selected comparison, not a survey of every capital or a claim that those countries lack other observations. Airport stations such as Orly and Heathrow describe their own locations, not city centres.
Comparing historical archives also reveals minor metadata differences. For example, Warsaw’s listed coordinates differ by about 27 km between the WMO Climate observations provided by DWD and the WMO normals files, while Dublin’s and Vienna’s listed elevations differ by 14 m and 11 m respectively—likely due to coordinate rounding or instrument relocations over the 30-year period. However, these discrepancies do not alter the outcome: even if Warsaw and Dublin are excluded entirely, all 13 remaining capital stations still experienced a warmer-than-normal summer.
DWD’s recent observations have not completed its full quality-control process. Having three monthly reports does not establish that every contributing daily observation was present. The normals come from NCEI’s minimum-24-year composites; where countries did not supply year counts, NCEI assumes 30 years. These limitations rule out treating this table as a definitive ranking of whole cities or as evidence of records or climate-change attribution.
Explore the inputs: In the WMO Climate Explorer, select Austria → Vienna (11035), open Dashboard → Data, and inspect MeanTemp and Precipitation for June–August 2026. In the WMO Normals Explorer, select Austria → Wien_Hohe_Warte and read the same months in Mean Temperature and Precipitation. The seasonal comparisons here are calculated from those monthly inputs; the observation dashboard’s all-month average is not the summer normal. The WMO Climate guide and normals guide explain selection and export.
Across these selected stations, the consistent finding is a warmer-than-normal summer. The scale of that warmth, the months contributing to it and the rainfall balance differed substantially from one place to another.
Period covered: 1 June–31 August 2026. Provisional monthly reports, checked against the source snapshot of 2 October 2026.
Data Annex
Download the seasonal comparison, monthly observations and normals and station crosswalk. Temperature departures are rounded to one decimal place and rainfall percentages to whole numbers. Values that round to 100% are close to normal, not necessarily exactly equal to it.
| Capital / station | Mean °C | Normal °C | Departure °C | Rain mm | Normal rain mm | Rain % of normal |
|---|---|---|---|---|---|---|
| Paris / Orly | 23.6 | 19.6 | +4.0 | 63 | 166.9 | 38 |
| London / Heathrow | 21.4 | 18.2 | +3.3 | 94 | 145.8 | 64 |
| Belgrade / Beograd | 25.9 | 23.0 | +2.9 | 110 | 217.3 | 51 |
| Budapest / Pestszentlőrinc | 24.6 | 21.8 | +2.8 | 43 | 197.7 | 22 |
| Vienna / Hohe Warte | 23.6 | 21.2 | +2.5 | 134 | 216.8 | 62 |
| Madrid / Retiro | 27.6 | 25.1 | +2.5 | 34 | 39.2 | 87 |
| Brussels / Uccle | 20.3 | 17.9 | +2.4 | 200 | 234.2 | 85 |
| Dublin / Dublin Airport | 16.5 | 14.6 | +1.9 | 169 | 198.4 | 85 |
| Prague / Libuš | 20.8 | 19.3 | +1.5 | 229 | 228.8 | 100 |
| Berlin / Tempelhof | 20.4 | 19.3 | +1.1 | 124 | 188.0 | 66 |
| Warsaw / Okęcie | 19.9 | 18.8 | +1.0 | 255 | 206.7 | 123 |
| Stockholm / Observatoriekullen A | 18.2 | 17.4 | +0.9 | — | — | — |
| Oslo / Blindern | 17.1 | 16.5 | +0.6 | 230 | 269.2 | 85 |
| Bucharest / Băneasa | 22.6 | 22.2 | +0.5 | 199 | 200.2 | 99 |
| Helsinki / Kaisaniemi | 17.0 | 16.7 | +0.3 | 198 | 198.6 | 100 |
| Capital / station | June °C | July °C | August °C |
|---|---|---|---|
| Paris / Orly | +4.7 | +4.1 | +3.2 |
| London / Heathrow | +3.2 | +3.7 | +2.9 |
| Belgrade / Beograd | +2.5 | +1.4 | +4.7 |
| Budapest / Pestszentlőrinc | +3.0 | +1.5 | +3.8 |
| Vienna / Hohe Warte | +2.9 | +1.7 | +2.8 |
| Madrid / Retiro | +4.0 | +2.3 | +1.1 |
| Brussels / Uccle | +3.1 | +2.2 | +1.8 |
| Dublin / Dublin Airport | +2.3 | +2.2 | +1.2 |
| Prague / Libuš | +2.5 | +0.4 | +1.7 |
| Berlin / Tempelhof | +2.9 | -0.2 | +0.6 |
| Warsaw / Okęcie | +2.4 | -0.3 | +1.0 |
| Stockholm / Observatoriekullen A | +2.3 | -0.2 | +0.5 |
| Oslo / Blindern | +1.4 | +0.8 | -0.3 |
| Bucharest / Băneasa | +1.1 | -0.9 | +1.2 |
| Helsinki / Kaisaniemi | +1.5 | -0.3 | -0.2 |
All entries below are surface stations represented in the CLIMAT archive. Coordinates and elevations in this table follow DWD; the crosswalk download preserves both sources. A dash means that the normals composite did not supply a usable WIGOS identifier.
| Capital / station | Provider WMO ID | WIGOS ID | Latitude °N | Longitude °E | Elevation m |
|---|---|---|---|---|---|
| London / Heathrow | 03772 | — | 51.48 | -.45 | 25 |
| Dublin / Dublin Airport | 03969 | — | 53.42 | -6.3 | 85 |
| Paris / Orly | 07149 | — | 48.72 | 2.38 | 90 |
| Brussels / Uccle | 06447 | 0-20000-0-06447 | 50.8 | 4.36 | 101 |
| Madrid / Retiro | 08222 | 0-20000-0-08222 | 40.41 | -3.68 | 667 |
| Berlin / Tempelhof | 10384 | — | 52.47 | 13.4 | 49 |
| Oslo / Blindern | 01492 | 0-20000-0-01492 | 59.94 | 10.72 | 97 |
| Stockholm / Observatoriekullen A | 02484 | 0-20000-0-02484 | 59.35 | 18.07 | 44 |
| Helsinki / Kaisaniemi | 02978 | 0-20000-0-02978 | 60.18 | 24.94 | 4 |
| Warsaw / Okęcie | 12375 | 0-20000-0-12375 | 52.16 | 20.96 | 107 |
| Prague / Libuš | 11520 | 0-20000-0-11520 | 50.01 | 14.45 | 304 |
| Vienna / Hohe Warte | 11035 | — | 48.25 | 16.36 | 209 |
| Budapest / Pestszentlőrinc | 12843 | — | 47.43 | 19.18 | 139 |
| Bucharest / Băneasa | 15420 | 0-20000-0-15420 | 44.51 | 26.08 | 91 |
| Belgrade / Beograd | 13274 | 0-20000-0-13274 | 44.8 | 20.46 | 132 |
Data Sources
- DWD recent monthly mean temperature files and precipitation totals: the 2026 June–August observations, queried using the five-digit station IDs above.
- DWD recent temperature documentation and precipitation documentation: units, monthly aggregation and quality-control status.
- DWD CLIMAT station list: observation-series identifiers and metadata.
- WMO 1991–2020 mean temperature normals and precipitation normals: NCEI accession 0253808, version 2.2, minimum-24-year composites.
- NOAA NCEI WMO Climate Normals documentation: reference-period definitions, national submissions and the treatment of missing year counts.