Isaias at Three Airports: The Gusts a Daily Average Hides
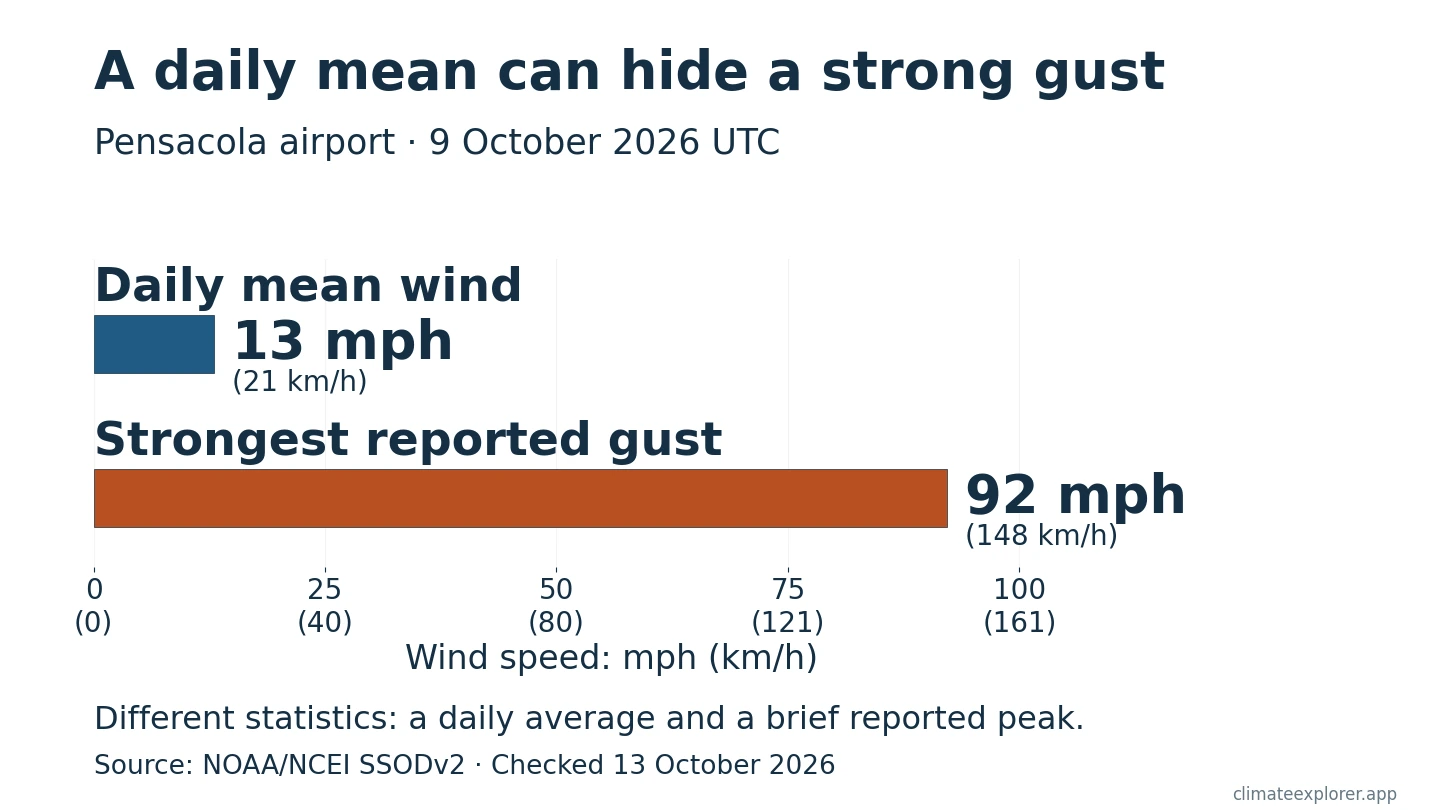
At Pensacola Regional Airport, NOAA’s daily summary for 9 October 2026 UTC gives a mean wind of 13 mph (21 km/h). The same day includes a reported gust of 92 mph (148 km/h). Both numbers belong in the record: the mean summarizes the selected wind observations, while the gust captures a brief peak.
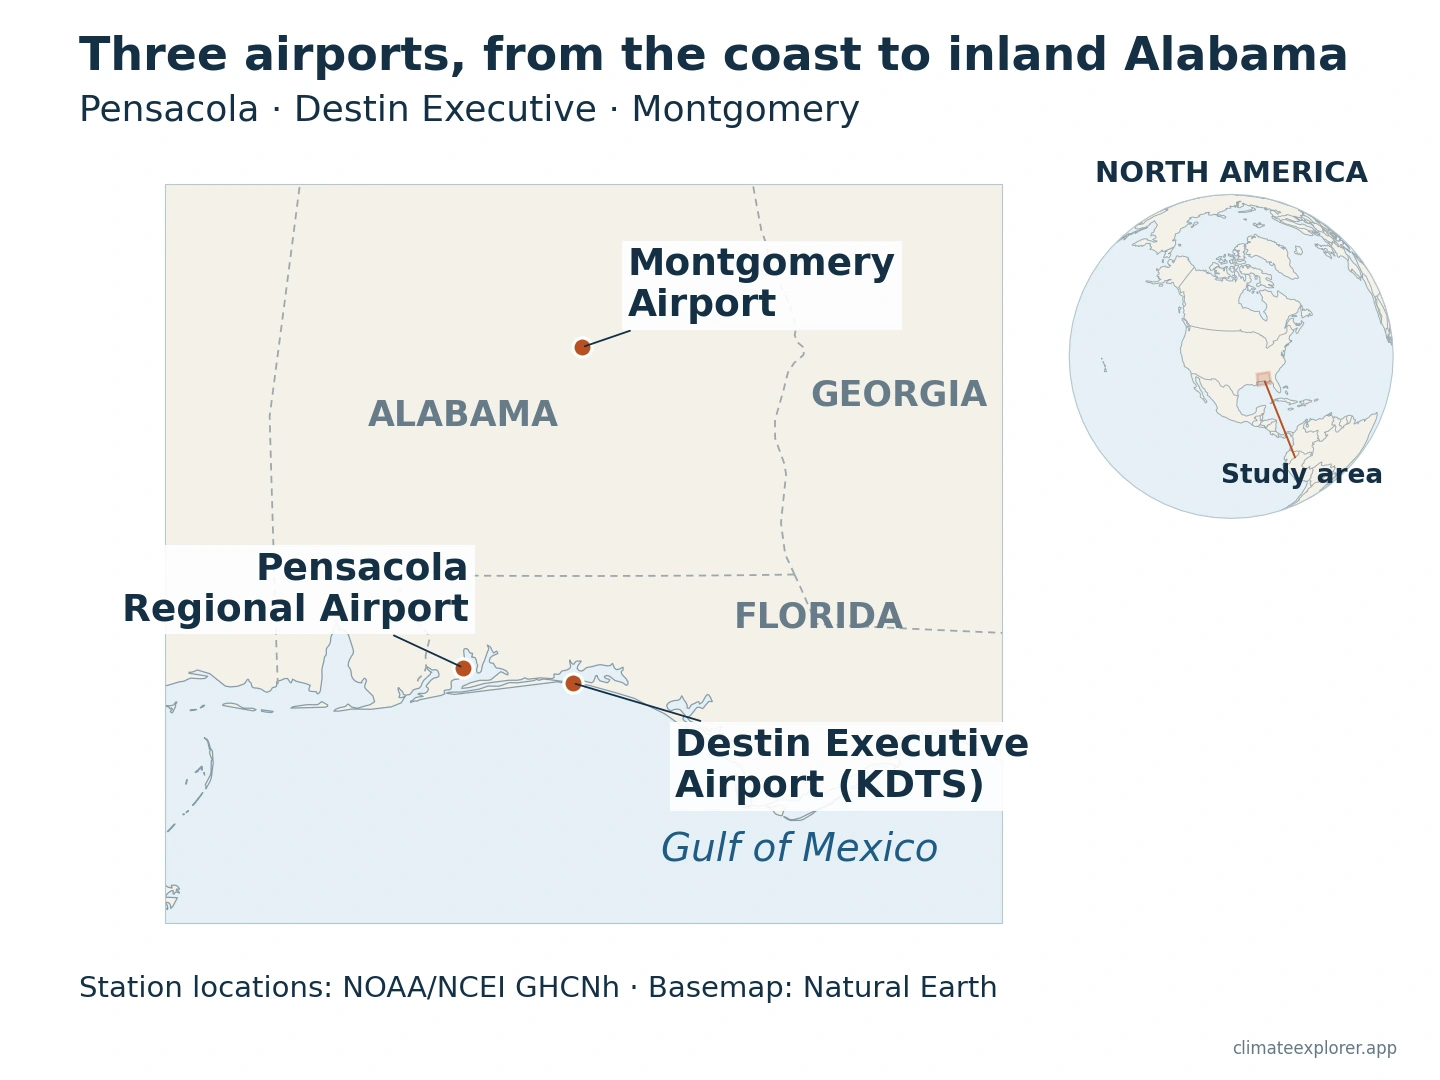
Looking inside the day makes the difference clear. The hourly and special weather reports show when the winds strengthened and when pressure reached its lowest sampled reading. We follow three airport stations: Pensacola and Destin Executive in the Florida Panhandle, then Montgomery in Alabama. The Destin record has missing hours, which remain empty in the charts.
Clock times below use Central Daylight Time (CDT), five hours behind UTC. NOAA’s daily SSOD rows use UTC dates.
A gust and a daily mean tell different stories
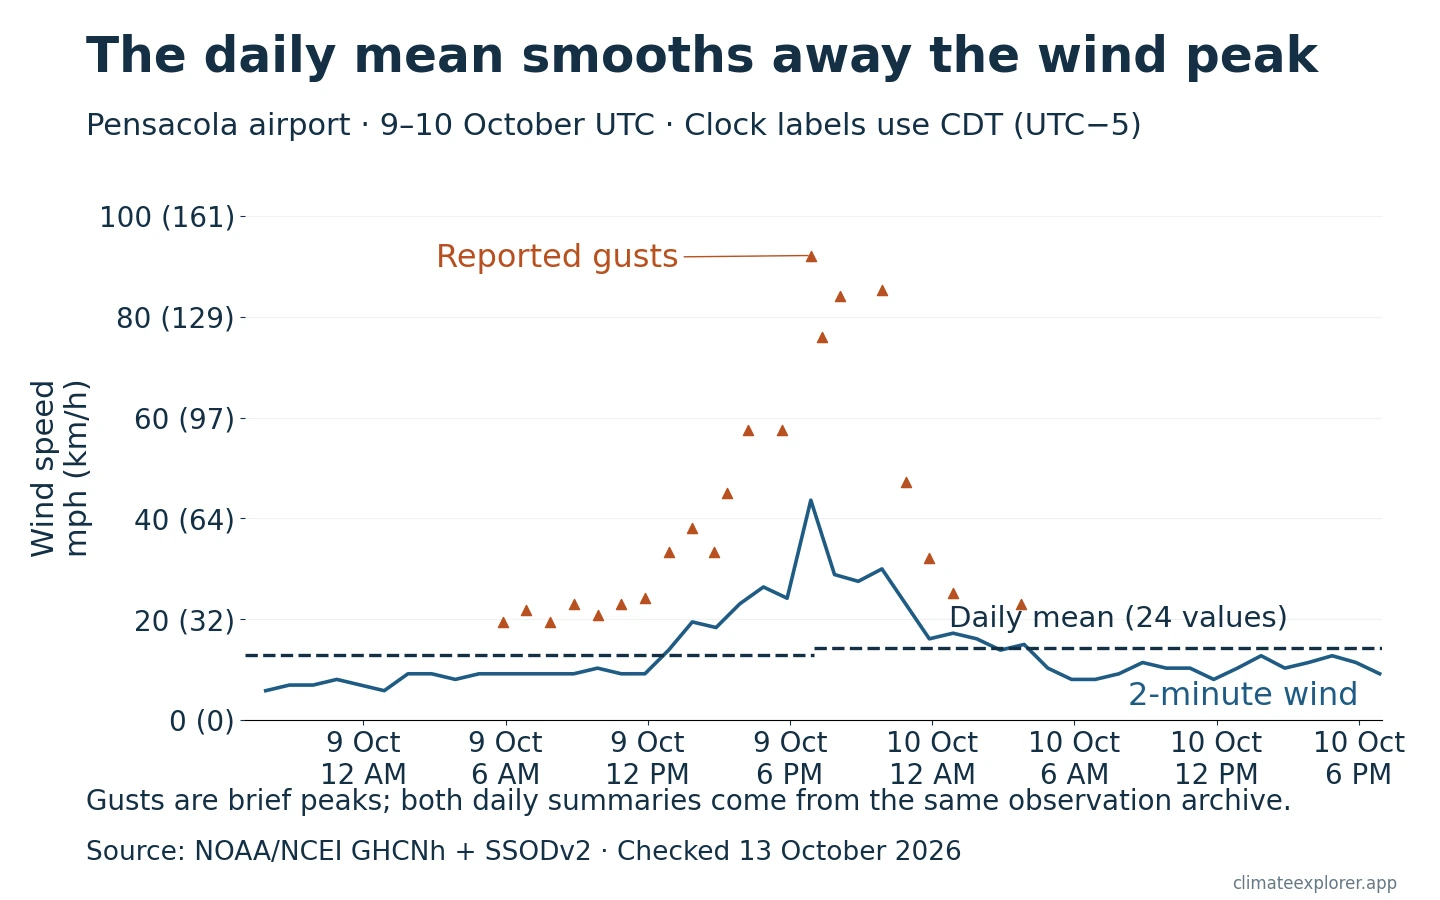
The 92 mph (148 km/h) gust appears in Pensacola’s report at 6:53 p.m. on 9 October. That report also gives an average wind of about 44 mph (70 km/h). Airport wind speed in these reports is a two-minute average; NOAA describes a gust as a short peak, usually lasting less than 20 seconds. A daily mean smooths those changing conditions into one number.
The chart keeps those measurements separate. The line uses one selected airport wind report per hour. Triangles mark the largest reported gust in each hour. The dashed lines are NOAA’s published daily means, each based on 24 values at Pensacola. Gusts disappear from the plot when no gust was reported; they are not set to zero.
There is a second reason to keep the underlying reports. At Destin Executive Airport, the largest reported gust in the 9–10 October UTC window was 76 mph (122 km/h). It appears in special weather reports at 6:12 and 6:16 p.m. on 9 October. Restricting the search to routine reports would give 63 mph (102 km/h) instead. The extra reports preserve a burst that a routine-only series would miss.
These are measurements at particular airports. They should not be read as the hurricane’s official maximum sustained wind or used to assign it a category. The National Hurricane Center and the airport records describe different wind statistics and locations.
The pressure low came later inland
The pressure timeline adds the sequence. These NOAA readings are estimates adjusted to sea level, expressed in hectopascals, or hPa. They are separate from the hurricane’s central pressure.
Pensacola’s lowest sampled reading was 990.3 hPa at 6:53 p.m. on 9 October. At Destin Executive it was 984.5 hPa at 8:53 p.m. Montgomery’s 1004.4 hPa reading came at 3:53 a.m. on 10 October, seven hours after Destin’s. These minima come from the available reports during 9–10 October UTC.
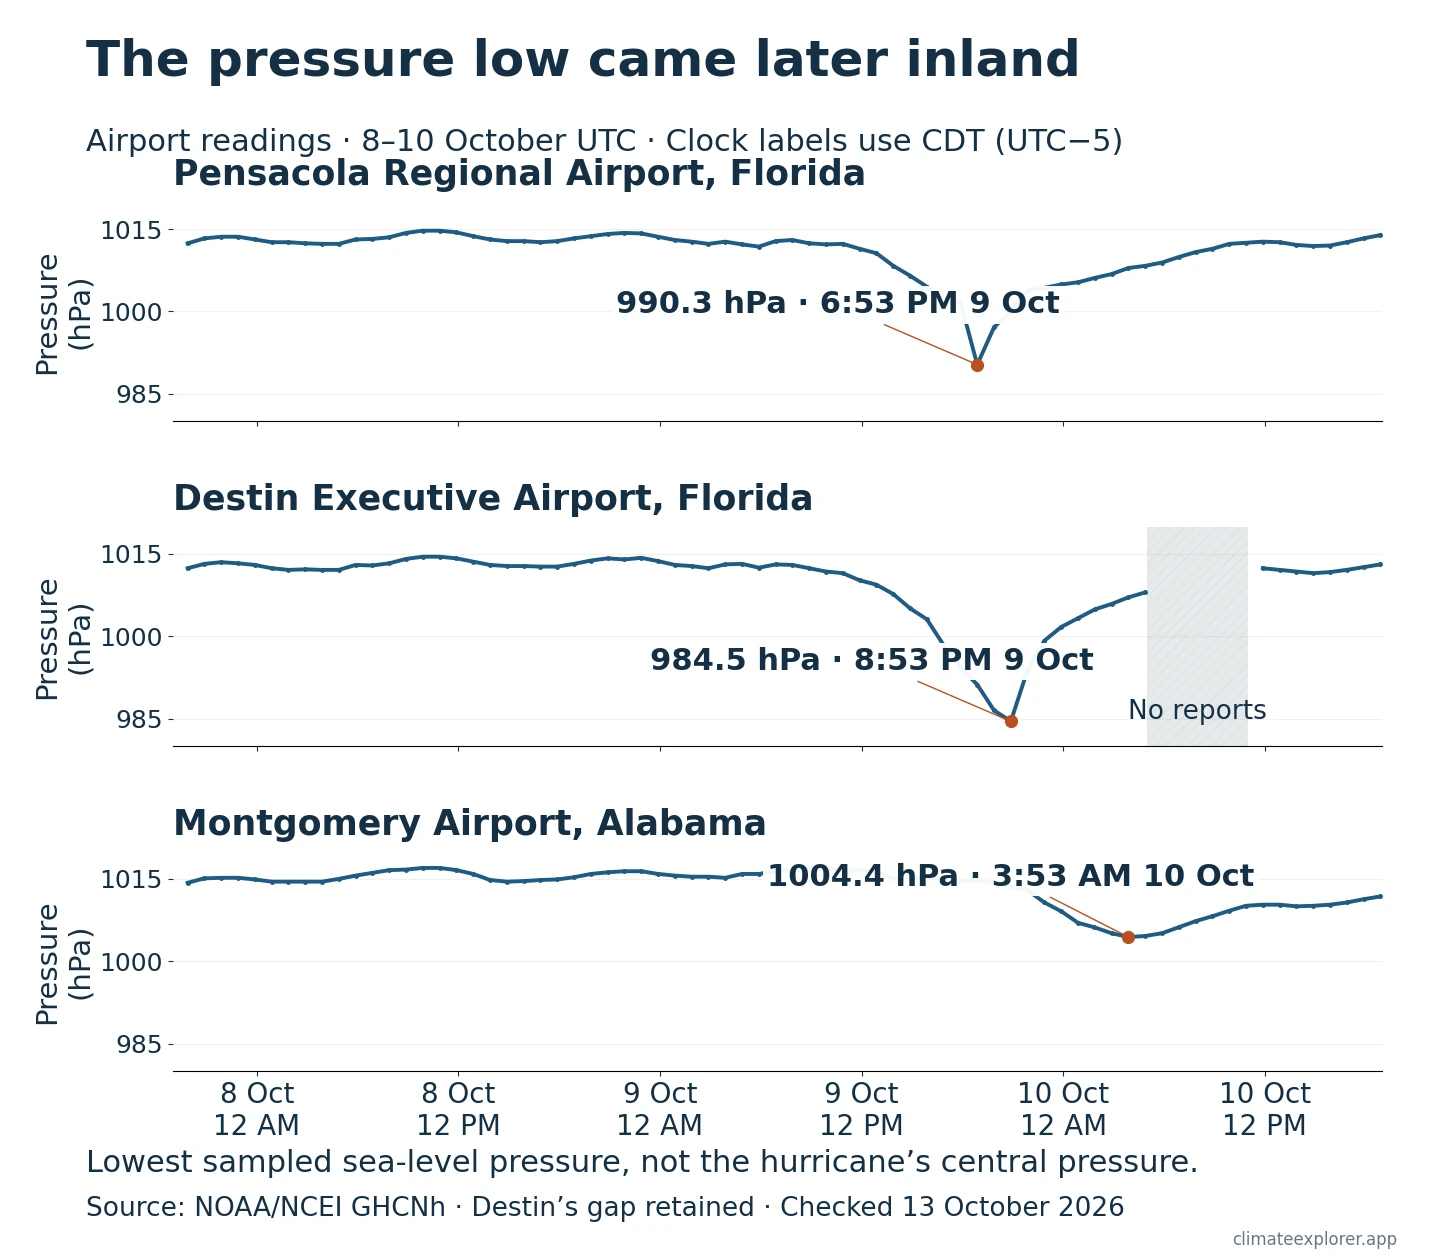
The National Hurricane Center placed landfall near Destin at about 8:30 p.m. on 9 October. By 1 a.m. on 10 October, its advisory described Isaias as post-tropical over southern Alabama. The airport pressure records add local timing to that broad chronology. A pressure minimum alone does not prove that the eye passed over an airport.
One evening falls across two NOAA dates
SSOD stands for Synoptic Summary of the Day. NOAA makes these daily summaries from GHCNh observations. Comparing the two products shows what aggregation changes; it does not provide independent confirmation from a second observing network.
An SSOD date runs from midnight to midnight in UTC. During this event, the row labelled 9 October covers 7 p.m. on 8 October to just before 7 p.m. on 9 October CDT. Pensacola’s 6:53 p.m. gust falls near the end of that summary day. Landfall, later that evening, belongs to 10 October UTC. A local headline and a UTC data table can therefore use different dates for the same evening.
A daily row does not fill missing hours
Destin Executive has no reports from 5 a.m. to 10:59 a.m. CDT on 10 October—six hourly slots. The pressure chart breaks there. There are additional gaps in reported wind speed, and an absent gust is not evidence of calm weather.
SSOD still provides a row for 10 October. Its temperature and sea-level-pressure means use 18 values, while the wind mean uses only four. Counts differ by variable. We retain those counts and do not use that wind mean as a fully sampled daily comparison. The archive documents broad averaging rules, but we have not reproduced NOAA’s exact wind selection for that Destin day.
Explore the observations
Use the GHCNh Explorer for individual pressure, wind and gust reports, and the SSOD Explorer for the daily summaries. Select 7–10 October 2026 and confirm the native station identifier in the dashboard. The links request that interval in the plots view; confirm the dashboard’s station and dates before comparing values.
- Pensacola Regional Airport:
USW00013899. Hourly reports · Daily summary. - Destin Executive Airport:
USW00053853. Hourly reports · Daily summary. NOAA’s catalog retains the older labelDESTIN FT WALTON BEACH AP; this station is KDTS, distinct from the modern VPS airport. - Montgomery Airport:
USW00013895. Hourly reports · Daily summary.
The GHCNh guide and SSOD guide explain the controls. The article downloads preserve the observations and daily counts used here. We checked the GHCNh parser against the frozen source values; the live dashboard has not been matched value by value for this revision.
Conclusion
Pensacola’s 13 mph (21 km/h) daily mean and 92 mph (148 km/h) reported gust describe different parts of the same day. The individual reports preserve the burst, while the pressure sequence puts the three airports’ changes on a clock. SSOD makes daily comparisons easier, provided its UTC dates and observation counts remain visible.
The Destin gaps limit what we can say about its complete passage window. These station observations support a local data story, rather than a regional wind map, a rainfall total or a climate-change attribution.
Editor’s note: Data current as of 13 October 2026. The analysis selects observations through 10 October UTC. Recent source records may be revised.
Data Annex
Stations and identifiers
Coordinates and elevations below come from the NOAA observation files. WIGOS codes are globally unique station identifiers. The Pensacola and Montgomery codes were checked against official WMO normal files; their station metadata differ slightly from NOAA’s observation metadata. No WIGOS mapping was verified for Destin.
| Station | GHCN identifier | WIGOS identifier | Latitude | Longitude | NOAA elevation |
|---|---|---|---|---|---|
| Pensacola Regional Airport | USW00013899 |
0-20000-0-72222 |
30.4781 | −87.1869 | 34.1 m |
| Destin Executive Airport (KDTS) | USW00053853 |
Not verified | 30.3933 | −86.4675 | 5.5 m |
| Montgomery Airport | USW00013895 |
0-20000-0-72226 |
32.2997 | −86.4075 | 66.1 m |
Selected observations
The following values are sampled extrema from 9–10 October UTC, with local report times. Destin’s missing hours prevent treating its sampled maximum as a continuously observed event maximum.
| Station | Lowest reported pressure | Pressure report CDT | Largest reported gust | First gust report CDT |
|---|---|---|---|---|
| Pensacola | 990.3 hPa | 9 Oct, 6:53 p.m. | 92 mph (148 km/h) | 9 Oct, 6:53 p.m. |
| Destin Executive | 984.5 hPa | 9 Oct, 8:53 p.m. | 76 mph (122 km/h) | 9 Oct, 6:12 p.m. |
| Montgomery | 1004.4 hPa | 10 Oct, 3:53 a.m. | 41 mph (67 km/h) | 9 Oct, 11:53 p.m. |
How the figures were made
The source snapshots contain 2,171 timestamped rows across the three stations during 7–10 October UTC. Reporting frequencies and available fields vary; a row containing only an intermediate precipitation value does not supply a pressure or wind measurement.
The quoted extrema use all available nonmissing, unflagged reports in the selected 9–10 October UTC window. For the hourly lines, we prefer routine reports and select one value per variable per hourly bin; gust marks use the largest reported gust within each hour. Each selected variable retains its own actual timestamp. No values are interpolated across missing hours.
Core quoted GHCNh values have blank quality-code fields. We describe them as unflagged, which is not a certificate that every possible quality check passed. Basic range, identity and timestamp checks supplement the source information. Wind conversions use 1 mph (1.609344 km/h) = 0.44704 m/s.
SSOD summaries share the GHCNh archive. Pensacola’s selected-hour wind mean reproduces the published 9 October value after rounding; Destin’s wind sampling does not reproduce the published mean exactly. Daily counts and raw source values are retained rather than replaced. No precipitation accumulation, historical ranking or monthly climate anomaly was calculated.
Download the individual reports, selected hourly chart data, SSOD daily summaries, station and identifier crosswalk and event summary.
Data Sources
- Natural Earth supplies the locator map’s land outlines and boundaries; station positions use the NOAA coordinates in the crosswalk above.
- NOAA/NCEI GHCN-Hourly observations, Pensacola’s 2026 annual Parquet file and GHCNh documentation.
- NOAA/NCEI Synoptic Summary of the Day v2, Pensacola’s 2026 daily CSV file and SSODv2 documentation.
- National Hurricane Center 9 October landfall update and 10 October overnight advisory.
- National Weather Service ASOS wind sensor and averaging and NHC wind terminology.
- Destin Executive Airport’s operator and Destin–Fort Walton Beach Airport’s location information for the distinction between DTS and VPS.
- NOAA-hosted WMO 1991–2020 normal files for the source-backed Pensacola and Montgomery identifier crosswalk. Monthly normals were screened but are not used as a baseline for hurricane wind or pressure.