Central Park’s July 2026 Heatwave in a Full-Month View
Central Park opened July 2026 with four consecutive UTC-day highs of at least 90°F (32.2°C). The hottest was 100°F (37.8°C) on July 2. Later, cooler days changed the monthly picture: the mean of all 31 daily maxima was 83.5°F (28.6°C).
That is about 1.5°F (0.8°C) below the station’s 1991–2020 July mean daily maximum. The month contained a short heatwave even though its average daytime high was below that reference. These are provisional NOAA Synoptic Summary of the Day (SSOD) observations.
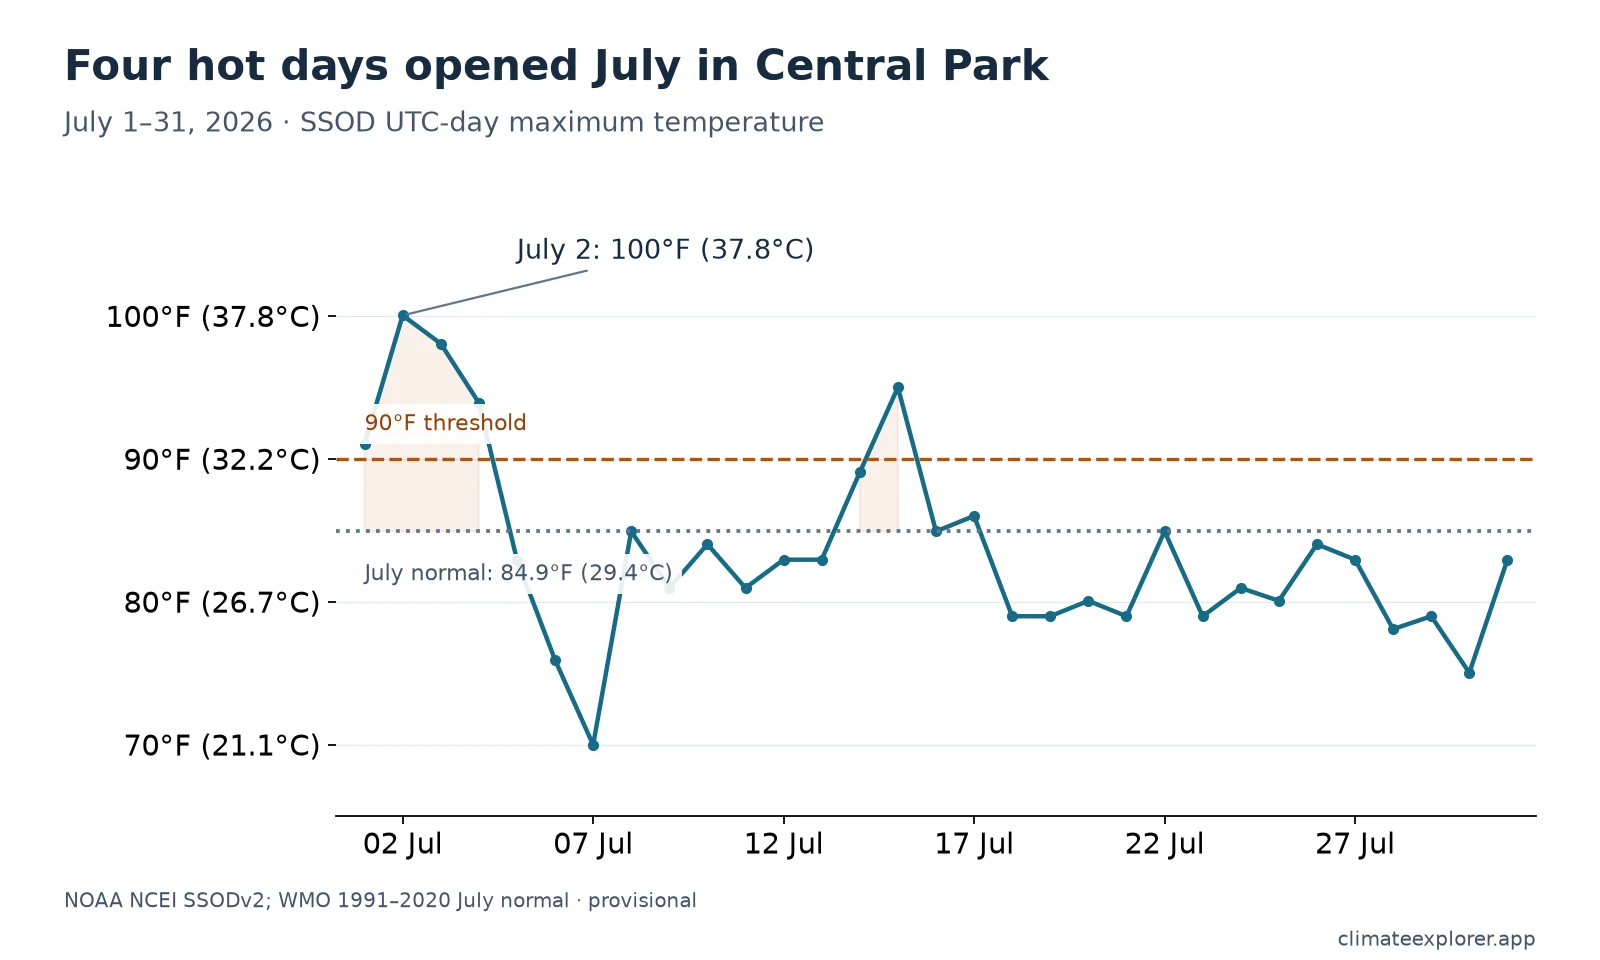
The four-day run and what followed
The first four highs were 91°F, 100°F, 98°F and 94°F (32.8°C, 37.8°C, 36.7°C and 34.4°C). NWS New York uses at least three consecutive days reaching 90°F as its heatwave definition. The SSOD series meets that temperature threshold over four UTC days.
July 15 also reached 90°F, making five qualifying days in the month. It was an isolated day in this series, rather than an extension of the opening run. A monthly average cannot show that sequence; keeping the individual dates visible explains how a brief event and a cooler monthly average can coexist.
What the baseline means
The WMO July normal is 84.9°F (29.4°C): the 1991–2020 average of daily maximum temperatures in July. Comparing it with this July’s mean maximum is more like-for-like than comparing it with the hottest instant of the month. The comparison still combines different source products and does not establish unchanged instruments, exposure or daily boundaries over time.
The 100°F peak was about 15.1°F (8.4°C) above that monthly reference. That is useful seasonal context, but it is neither a calendar-day anomaly nor proof of a record. This revision makes no historical-record claim.
Check the dates as well as the temperature
SSOD summarizes a 00:00–23:59 UTC day. That window crosses two New York local calendar dates in summer, so an SSOD daily result can differ from a local climatological report. The UTC-day explainer shows the conversion.
Open Central Park for July 1–31, confirm NOAA station USW00094728, and compare the dashboard with the 31-row calculation extract. The SSOD guide explains export and completeness checks.
Conclusion
Central Park’s July 2026 observations demonstrate the importance of placing acute weather extremes within a full-period context. An intense four-day heatwave from 1 to 4 July brought triple-digit heat (100°F / 37.8°C on 2 July), but the remainder of the month was characterized by sustained moderation, with only one subsequent day reaching 90°F. Across all 31 days, the mean daily maximum temperature was 83.5°F (28.6°C)—which sat 1.4°F below the 1991–2020 WMO July baseline of 84.9°F (29.4°C). The SSOD series establishes when the peak occurred and how conditions evolved, illustrating that brief extreme episodes do not necessarily produce an above-average calendar month.
Editor’s note: Data current as of July 31, 2026. Complete 31-day UTC daily maxima and WMO 1991–2020 normals were rechecked against NOAA SSODv2 archives on September 13, 2026. Interim daily reports may differ slightly from final homogenized NCEI climate records.
Data Annex
Station and baseline metadata
| Station/site | Identifiers | Dataset use |
|---|---|---|
| New York City Central Park | NOAA/GHCN/SSOD USW00094728; legacy WMO 72506; WIGOS 0-20000-0-72506 |
NOAA SSODv2 supplies the July 2026 UTC-day maxima; WMO normals supplies the 1991–2020 July mean daily maximum of 84.9°F (29.4°C) |
Metadata note: These identifiers refer to the same Central Park observing site, not two independent stations. The NOAA station list associates USW00094728 with WMO 72506. NOAA SSOD metadata reports 40.7789° N, 73.9692° W and 42.7 m; the WMO normals record, named New York Central Park Tower, reports the rounded coordinates 40.779° N, 73.969° W and 40.0 m. These source-specific metadata differences do not demonstrate a second site, but the identifier match does not imply that instruments or exposure remained unchanged throughout 1991–2020 and 2026. WMO explains how legacy five-digit station numbers became WIGOS identifiers.
Daily maxima used in the chart
| UTC date | Maximum | At least 90°F? |
|---|---|---|
| 2026-07-01 | 91°F (32.8°C) | Yes |
| 2026-07-02 | 100°F (37.8°C) | Yes |
| 2026-07-03 | 98°F (36.7°C) | Yes |
| 2026-07-04 | 94°F (34.4°C) | Yes |
| 2026-07-05 | 83°F (28.3°C) | No |
| 2026-07-06 | 76°F (24.4°C) | No |
| 2026-07-07 | 70°F (21.1°C) | No |
| 2026-07-08 | 85°F (29.4°C) | No |
| 2026-07-09 | 81°F (27.2°C) | No |
| 2026-07-10 | 84°F (28.9°C) | No |
| 2026-07-11 | 81°F (27.2°C) | No |
| 2026-07-12 | 83°F (28.3°C) | No |
| 2026-07-13 | 83°F (28.3°C) | No |
| 2026-07-14 | 89°F (31.7°C) | No |
| 2026-07-15 | 95°F (35.0°C) | Yes |
| 2026-07-16 | 85°F (29.4°C) | No |
| 2026-07-17 | 86°F (30.0°C) | No |
| 2026-07-18 | 79°F (26.1°C) | No |
| 2026-07-19 | 79°F (26.1°C) | No |
| 2026-07-20 | 80°F (26.7°C) | No |
| 2026-07-21 | 79°F (26.1°C) | No |
| 2026-07-22 | 85°F (29.4°C) | No |
| 2026-07-23 | 79°F (26.1°C) | No |
| 2026-07-24 | 81°F (27.2°C) | No |
| 2026-07-25 | 80°F (26.7°C) | No |
| 2026-07-26 | 84°F (28.9°C) | No |
| 2026-07-27 | 83°F (28.3°C) | No |
| 2026-07-28 | 78°F (25.6°C) | No |
| 2026-07-29 | 79°F (26.1°C) | No |
| 2026-07-30 | 75°F (23.9°C) | No |
| 2026-07-31 | 83°F (28.3°C) | No |
The source CSV was retrieved on September 13, 2026. One valid row was retained per date, with no missing July dates. The unrounded mean is 83.468°F (28.594°C); differences from the 29.4°C baseline are calculated before rounding. The station crosswalk and baseline are documented above. Download the chart data to reproduce the mean or count threshold days.
Data Sources
- NOAA SSODv2 Central Park 2026 CSV: daily observations, subject to revision.
- NOAA SSODv2 documentation: fields and daily aggregation window.
- NWS New York extreme heat: regional heatwave definition.
- NOAA NCEI WMO Climate Normals: the 1991–2020 reference collection.