Why long climate records need homogenization
A weather station can keep the same name while its thermometer, surroundings and observing routine change. A century-long chart can therefore contain two kinds of change: changes in climate and changes in how it was measured. Homogenization estimates and adjusts for the second, so that different parts of a record can be compared more consistently.
This matters when you use a long series to investigate warming, compare decades or count unusually hot days. Length alone does not tell you whether the measurements are comparable. Climate Explorer’s Hungarian century series offers a practical example: HungaroMet publishes both original, checked observations and a separate homogenized product.
A plausible observation can still interrupt a climate record
Quality control asks whether an observation is credible: is it missing, mistyped or inconsistent with other evidence? Homogenization asks a different question: has the relationship between measurements from different periods changed? A shift following a station move can leave every day’s value physically plausible while affecting a comparison across decades. Passing quality checks therefore does not establish that a series is homogeneous.
Budapest’s city series—shown in the Explorer as Budapest belterület, provider station ID 44121—makes that distinction tangible. HungaroMet’s station history describes measurements in an instrument garden from March 1910, a move to a terrace in April 1985, and replacement of traditional thermometers with an electric sensor in January 1998. A record spanning these periods cannot be understood solely from its city label.
These dates explain why station history matters. They do not, by themselves, tell us the size of a temperature adjustment or prove which change caused a particular difference between two datasets.
Nearby records help identify a shift
One way to investigate a suspected discontinuity is to compare a station with other records that experience similar climate variations. A warm year may appear across the region. A persistent change in one station’s relationship with several others calls for closer examination.
NOAA’s GHCNm temperature method uses repeated comparisons between station pairs to detect shifts and estimate adjustments. The stations do not need identical temperatures; their differences through time provide the evidence. Metadata such as relocation dates adds context, while statistical comparisons can help where records of observing changes are incomplete.
HungaroMet uses a different system, MASH, for its century series. Its documentation says earlier observations are adjusted to present measurement conditions. The processing also fills missing values and includes further checks. The resulting product represents a more consistent set of observing conditions across time.
What changes in the Budapest series?
We compared HungaroMet’s original and homogenized daily mean temperatures for 1901–2025, then averaged each complete year. Both files contain every date in that period, so this comparison is not affected by one version filling dates missing from the other.
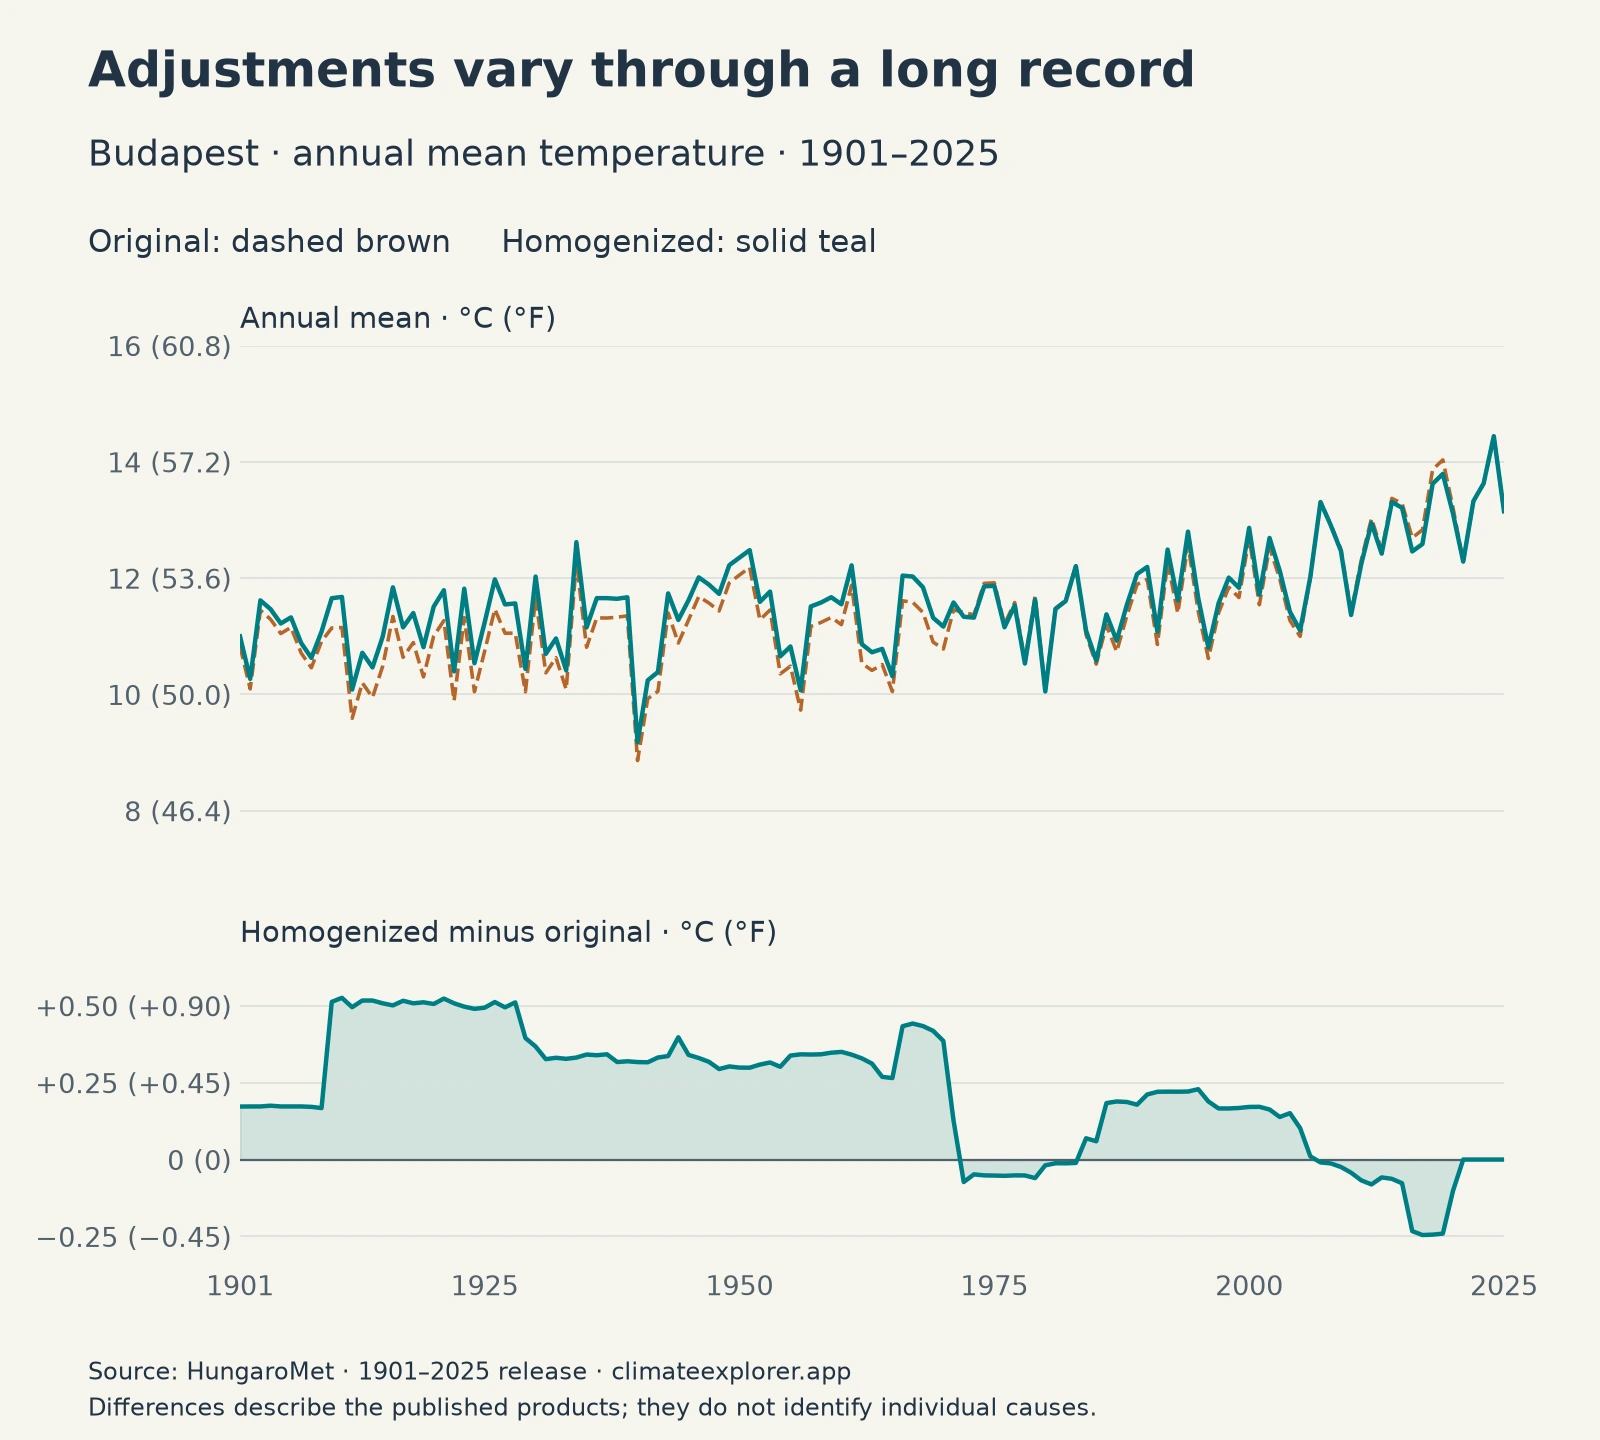
The chart retains pronounced year-to-year variation in both versions, while their separation changes through time. The largest upward difference in the annual mean occurs in 1911: +0.53°C (+0.95°F). The largest downward difference occurs in 2017: −0.25°C (−0.44°F). These are differences between the two products for the same year, not departures from a climate normal.
This is the practical point: the processing does not add one fixed amount to the entire record. The lower panel makes that visible without hiding the temperature swings in the upper panel. It shows the net difference between the published products; it does not isolate the contribution of each instrument change, move or further quality check.
The comparison concerns two versions of the Budapest record. It does not establish how much Hungary as a whole has warmed, and the difference between the products is not an independent measure of climate change.
An adjusted record still contains weather variability
Homogenization is different from smoothing a line or subtracting a climate normal. A moving average makes fluctuations less prominent; an anomaly expresses temperature relative to a chosen baseline. Neither operation alone estimates the effect of a station move or instrument change.
The purpose of an adjusted series also matters when discussing extremes. HungaroMet cautions that a historical measured extreme may change in the homogenized product, and new extremes can appear after adjustment. To answer “what was measured on that day?”, consult the original archive and its quality information. To investigate changes in the frequency of hot days, use a suitably documented daily climate series and state its processing.
Adjustment remains an estimate. The WMO guidelines explain that no method guarantees a completely homogeneous dataset. The available reference records, missing data and the method used affect what can be resolved. “Homogenized” is valuable information about processing, not a promise that every local influence has disappeared.
Check the product behind the chart
The useful question is which version of a dataset you are viewing. The provider’s name or the word “historical” is not enough. Three examples available through Climate Explorer illustrate this:
- HungaroMet Century (1901+): the configured source is HungaroMet’s homogenized daily product. The original counterpart used for this article comes from HungaroMet’s separate archive; it is not an original-versus-adjusted toggle in the Explorer.
- GHCNm monthly temperature: the GHCNm Explorer uses NOAA’s adjusted temperature series. NOAA distinguishes quality-controlled unadjusted files, QCU, from quality-controlled adjusted files, QCF. The distinction concerns temperature; it should not be extended automatically to other variables.
- DWD daily station observations: in the DWD archive documentation, “historical” means that routine quality checking is complete. That label does not certify homogenization. Consult the product’s metadata and station history before interpreting a long station trend.
Before drawing a conclusion from a century-long line, identify its variable, period, measurement history and adjustment status. Those details establish what can fairly be compared and which questions need another version of the observations.
Explore the example
Open the HungaroMet Explorer, choose Century (1901+), then Budapest belterület, and select mean temperature for 1 January 1901 to 31 December 2025. The station-selection and export guide explains the controls. Use the upstream links below for the two product versions and the downloadable annual table for the comparison in this article.
The Explorer displays the homogenized daily values; the figure above summarizes them by year. Its initial date window may be shorter, so set both dates explicitly. Climate Explorer visualizes the records; HungaroMet produces the underlying observations and homogenized series.
Data Annex
The worked example uses HungaroMet’s original and homogenized Budapest daily mean-temperature products for 1901–2025. “Original” means non-homogenized here: those observations have already undergone quality checking, including correction of identified archive transcription errors.
The two temperature metadata files identify the same sequence of Budapest observing locations. These are successive parts of one city series, not three simultaneously compared stations. The provider’s station numbers below describe that history; a modern site label does not imply unchanged exposure since 1901.
| Period within the comparison | Provider station number | Observing location | Latitude | Longitude | Elevation |
|---|---|---|---|---|---|
| 1901–28 February 1910 | 44119 | Budapest Víziváros | 47.4994°N | 19.0400°E | 120.0 m |
| 1 March 1910–31 March 1985 | 44120 | Budapest Országút | 47.5114°N | 19.0261°E | 118.0 m |
| 1 April 1985–2025 | 44121 | Budapest belterület | 47.5111°N | 19.0281°E | 152.3 m |
For each product, the annual value is the arithmetic mean of the daily mean temperatures. All 45,656 dates are present and valid, giving 125 complete years, with leap days included. The comparison uses no climatological baseline, fitted trend or smoothing. Differences are homogenized minus original. Fahrenheit differences equal Celsius differences multiplied by 1.8; absolute Fahrenheit temperatures also include the 32-degree offset.
| Year | Original annual mean, °C (°F) | Homogenized annual mean, °C (°F) | Difference, °C (°F) |
|---|---|---|---|
| 1911 | 11.15 (52.07) | 11.68 (53.02) | +0.53 (+0.95) |
| 2017 | 12.83 (55.10) | 12.59 (54.66) | −0.25 (−0.44) |
Download the annual comparison table, which includes both temperature units and the daily count for each year. The underlying files are HungaroMet’s 1901–2025 release; later releases may revise historical values. The figure compares the provider’s products and does not independently validate its homogenization algorithm.
Data Sources
- WMO: Guidelines on Homogenization.
- HungaroMet: homogenized station-series description.
- HungaroMet: original daily station-series description.
- HungaroMet: Budapest station history.
- HungaroMet: original daily mean-temperature files and homogenized files.
- NOAA NCEI: GHCNm methods and version 4 file definitions.
- DWD: daily station-observation documentation.