October Heat at the Coast: San Diego and LAX Reach 100°F (37.8°C)
The heat reached the coast. During the opening days of Southern California’s October 2026 heatwave, San Diego International Airport recorded 102.9°F (39.4°C) and Los Angeles International Airport, better known as LAX, recorded 100.0°F (37.8°C) in the available hourly observations.
At both airports, the average October daily high is about 75°F (24°C). These readings stood roughly 26–28°F (14–16°C) above that seasonal reference. That is the striking part of this story: extreme heat at two stations close to the Pacific.
This is an early view of a longer heatwave: hourly observations cover October 1–3 UTC, while daily summaries extend through October 5 UTC. The data are provisional.
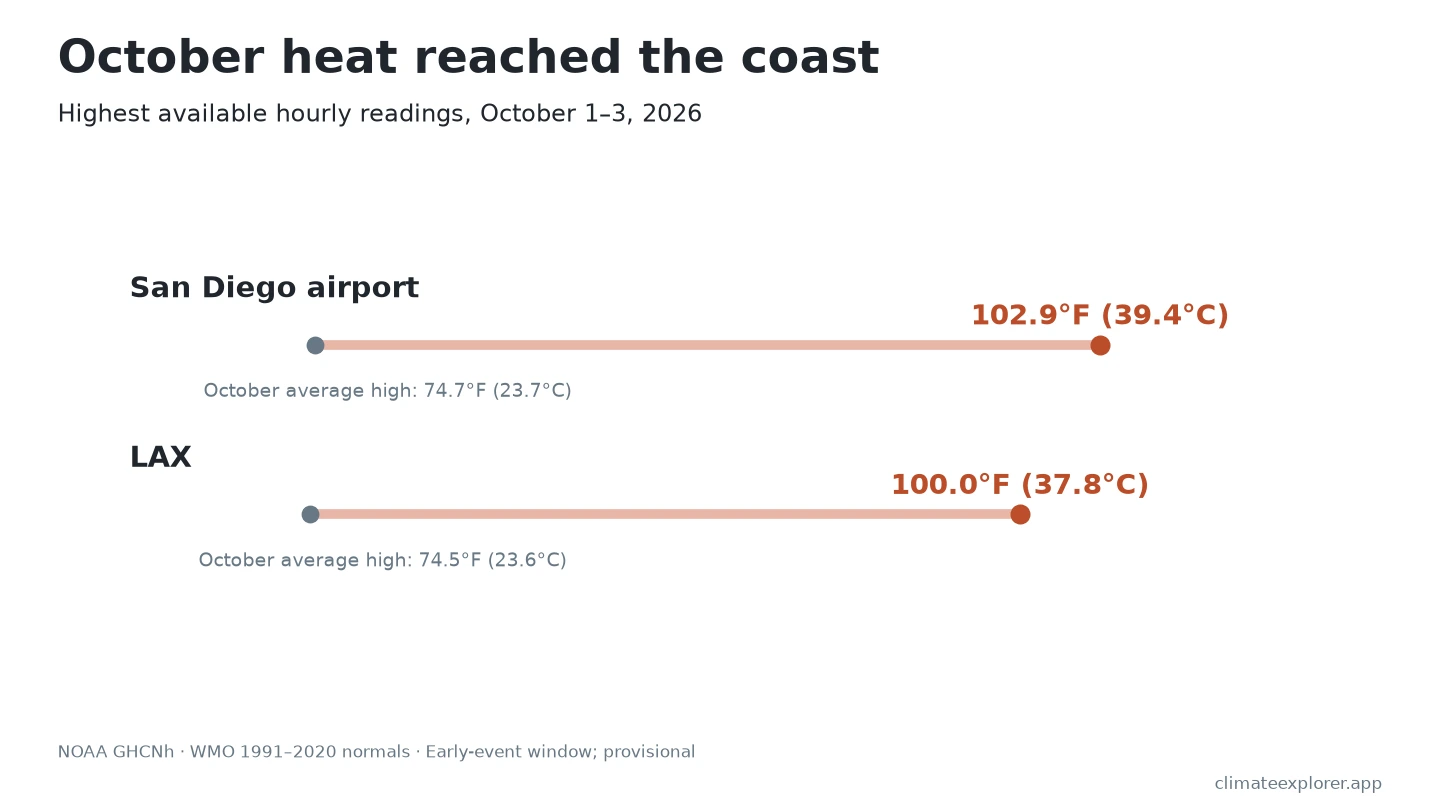
About 75°F (24°C) is the October reference
A climate normal is a long-term average. Here, it means the average of each day’s highest temperature during October over 1991–2020. The WMO Normals Explorer gives 74.7°F (23.7°C) for San Diego’s airport and 74.5°F (23.6°C) for LAX.
San Diego’s sampled peak was 28.3°F (15.7°C) above its October reference; LAX’s was 25.6°F (14.2°C) above its own. These are comparisons with a typical October daily high—not the amount by which the whole month was warmer. A monthly average also cannot tell us whether a reading broke a record.
The hourly view shows the surge
The hourly records show the repeated rise and fall of temperature, followed by a much higher crest on October 3. San Diego’s 102.9°F (39.4°C) reading was at 1:51 p.m. PDT; LAX’s 100.0°F (37.8°C) reading was at 11:53 a.m. PDT. Both timestamps fall on October 3 locally and in UTC.
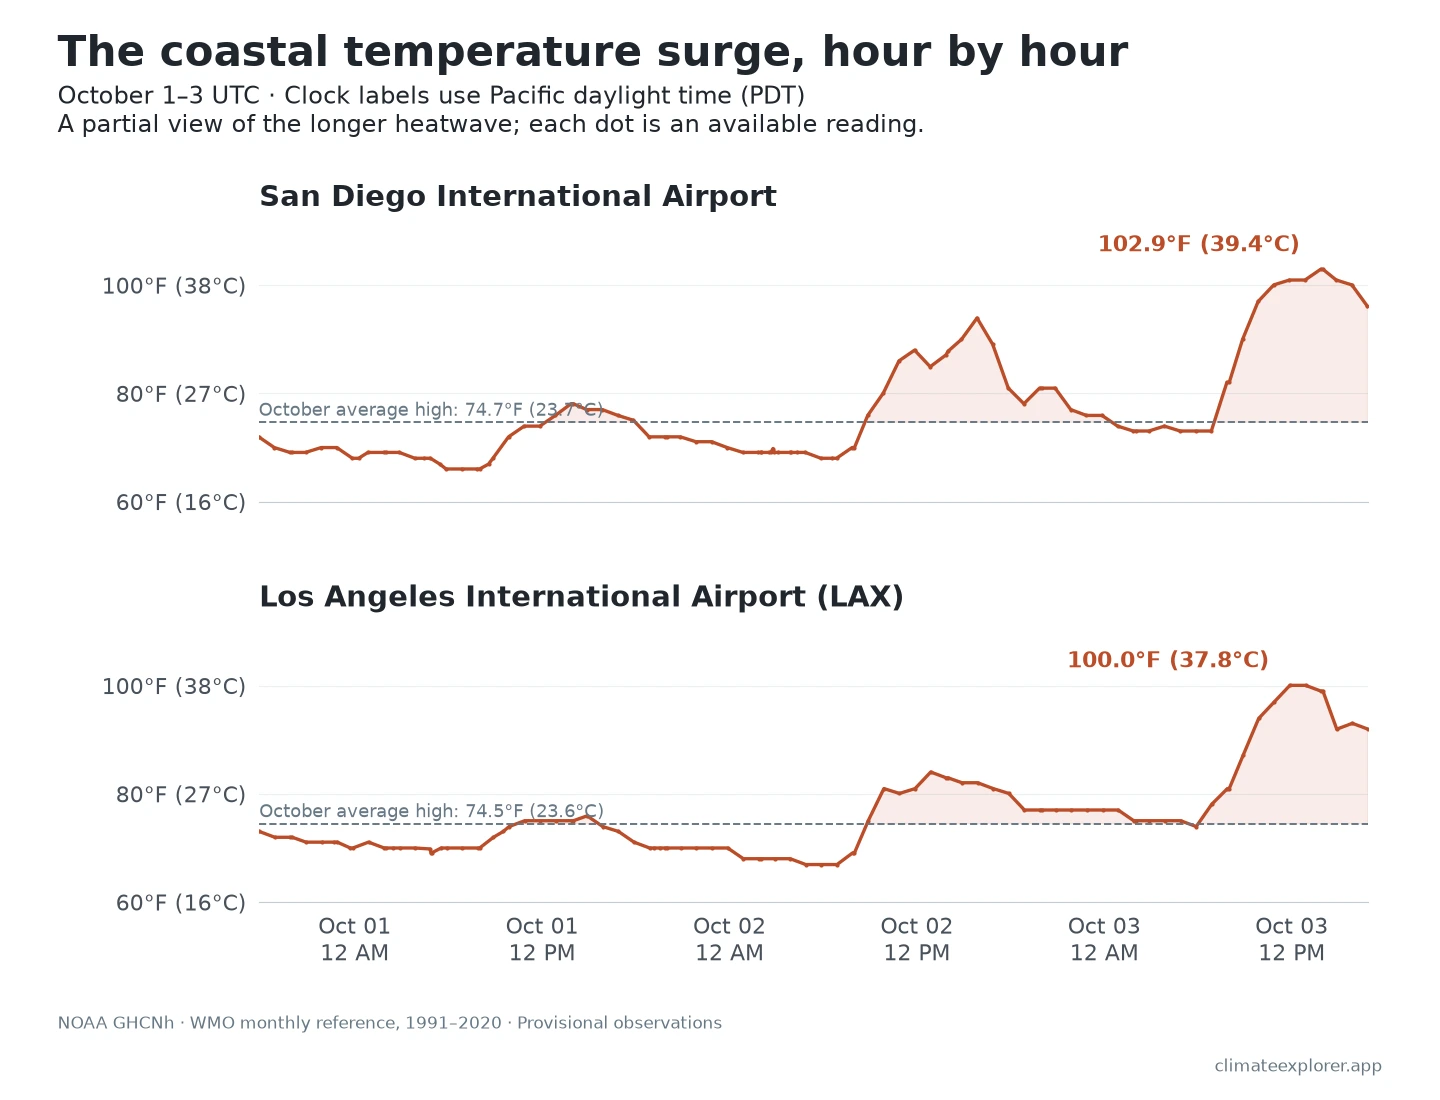
There is a useful distinction here: the highest available hourly reading is a snapshot. The temperature can climb higher between reports, so these numbers should not be treated as the official daily maximum or the final peak of the entire heatwave.
The wider station sample also shows substantial heat. Miramar, Riverside and Palm Springs each reached 104.0°F (40.0°C) in the October 1–3 hourly window. All nine selected airport stations reached at least 100°F (37.8°C). They show conditions at those sites, rather than a temperature for every neighbourhood.
Why the coast heated up
The National Weather Service described strong high pressure and winds blowing from inland toward the sea. Its October 3 discussion reported east winds reaching the coast that morning. Those conditions favoured heat spreading toward the coastal plain.
The marine layer is the shallow layer of ocean-influenced air that often brings coastal low cloud or fog. It was thin during the opening phase, according to the NWS. A thin marine layer can still bring patches of fog even during a heatwave.
Weather enthusiasts can investigate the sequence themselves: compare temperature, dew point and wind direction in the hourly explorer. Dew point describes how moist the air is; a falling dew point alongside rising temperature can help reveal a change in the air reaching a station.
The daily view shows that it lasted
The SSOD daily summaries add something the first three hourly days cannot: persistence. San Diego had two consecutive UTC days with maxima of at least 100°F (37.8°C), on October 3–4. LAX had three, on October 3–5, reaching 100.9°F (38.3°C) on October 5.
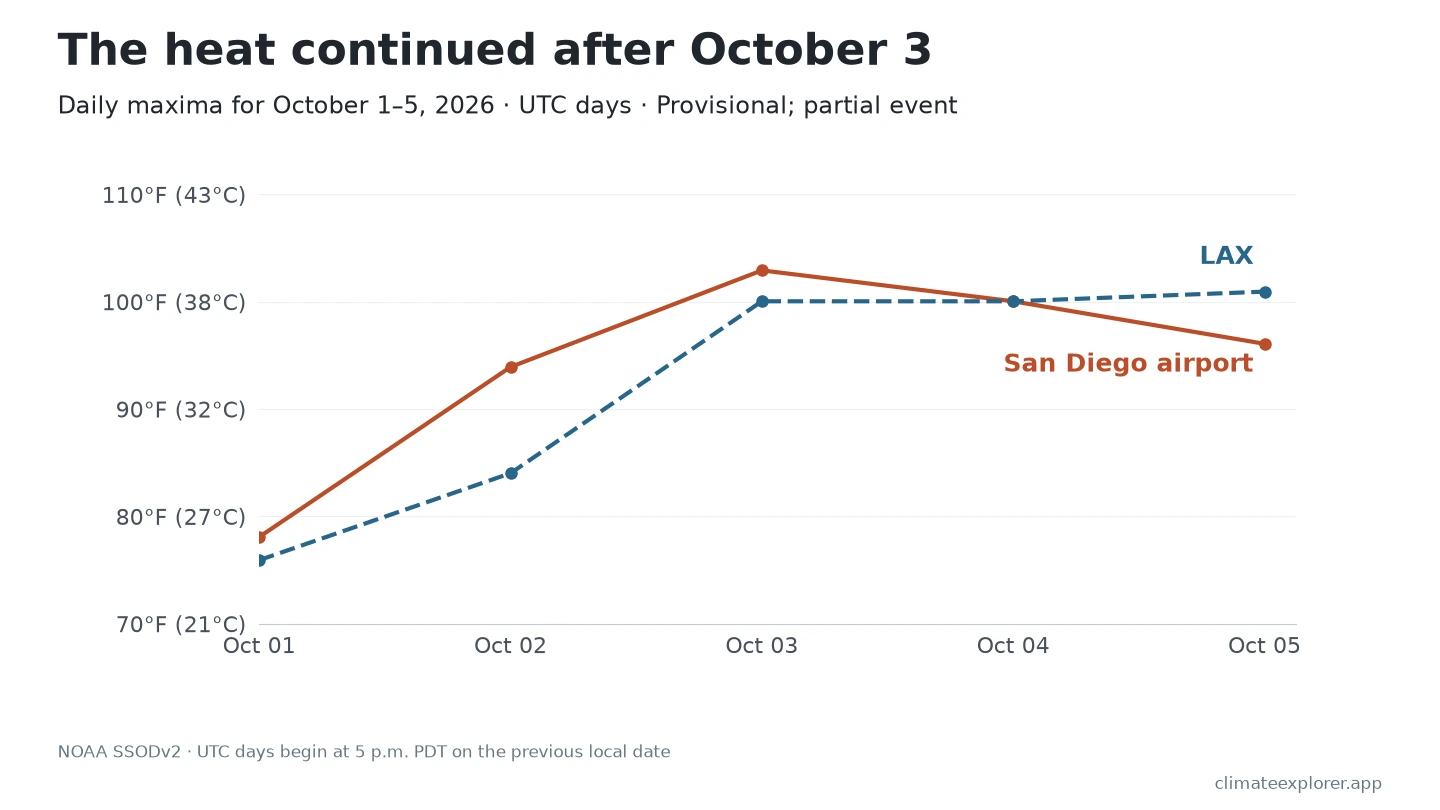
These are UTC days. In California at this time of year, each starts at 5 p.m. PDT on the previous local date. That explains why an explorer’s daily value can differ from a local weather report. The UTC-day explainer shows how the clocks fit together.
The heatwave continued beyond the observations shown here. NWS discussions issued late on October 7 still forecast extreme heat into October 8 along the coast and valleys, and into October 9 in the lower deserts. Those were forecasts, not a completed account of the event.
Explore the same heatwave
Start with the two coastal airports, then compare them with an inland station:
- See the hourly rise. Open San Diego in GHCNh or LAX in GHCNh. Select October 1–3, 2026 and inspect temperature. Then look at dew point and wind.
- See how many days stayed hot. Open San Diego in SSOD or LAX in SSOD. Use October 1–5 and maximum temperature.
- Put the heat in seasonal context. Open San Diego’s October normal or LAX’s October normal. Use the 1991–2020 reference period and Max Temperature. This means mean daily maximum temperature, rather than the hottest October day on record.
Confirm the station names and date ranges after opening. The explorers may receive newer data after this article’s cutoff. The hourly guide and daily guide explain selection and export.
Conclusion
Southern California’s opening October heat reached coastal airports as well as inland ones. The hourly view captures the surge, the daily view shows its persistence, and the normals show how far the coastal readings stood above an average October daily high. Together, they give readers a clearer picture of these opening days than a single headline temperature.
Editor’s note: Data checked October 8, 2026. Hourly comparison cutoff: October 3, 2026 at 23:59:59 UTC. Daily comparison cutoff: October 5, 2026 at 23:59:59 UTC. This is a partial event analysis using provisional NOAA observations.
Data Annex
Station metadata
The NOAA identifiers below let readers select the same stations. WIGOS codes are globally unique station identifiers; the two coastal codes are supplied by the WMO normals file and linked to NOAA’s legacy WMO station numbers. Other mappings have not been verified here. Identifiers connect dataset rows; they do not establish unchanged instruments or exposure over time.
| Station | NOAA ID | WIGOS ID, where verified | Latitude | Longitude | Elevation |
|---|---|---|---|---|---|
| San Diego International | USW00023188 |
0-20000-0-72290 | 32.7336 | -117.1831 | 4.6 m |
| Los Angeles International | USW00023174 |
0-20000-0-72295 | 33.9381 | -118.3867 | 29.6 m |
| San Diego Miramar | USW00093107 |
Not verified here | 32.8667 | -117.1333 | 145.4 m |
| Riverside Municipal | USW00003171 |
Not verified here | 33.9528 | -117.4353 | 257.6 m |
| Palm Springs | USW00093138 |
Not verified here | 33.8222 | -116.5044 | 124.7 m |
| Ontario International | USW00003102 |
Not verified here | 34.0531 | -117.5769 | 281.6 m |
| Van Nuys | USW00023130 |
Not verified here | 34.2122 | -118.4914 | 239.3 m |
| Long Beach | USW00023129 |
Not verified here | 33.8117 | -118.1472 | 10.4 m |
| Burbank | USW00023152 |
Not verified here | 34.1997 | -118.3656 | 222.8 m |
Highest available hourly temperatures, October 1–3 UTC
| Station | Sampled peak | First peak timestamp, UTC | Local date and time, PDT |
|---|---|---|---|
| San Diego International | 102.9°F (39.4°C) | 2026-10-03 20:51:00 | 2026-10-03 13:51 |
| Los Angeles International | 100.0°F (37.8°C) | 2026-10-03 18:53:00 | 2026-10-03 11:53 |
| San Diego Miramar | 104.0°F (40.0°C) | 2026-10-02 18:55:00 | 2026-10-02 11:55 |
| Riverside Municipal | 104.0°F (40.0°C) | 2026-10-02 22:53:00 | 2026-10-02 15:53 |
| Palm Springs | 104.0°F (40.0°C) | 2026-10-02 21:53:00 | 2026-10-02 14:53 |
| Ontario International | 102.9°F (39.4°C) | 2026-10-02 22:53:00 | 2026-10-02 15:53 |
| Van Nuys | 102.0°F (38.9°C) | 2026-10-02 21:51:00 | 2026-10-02 14:51 |
| Long Beach | 102.0°F (38.9°C) | 2026-10-02 20:53:00 | 2026-10-02 13:53 |
| Burbank | 100.9°F (38.3°C) | 2026-10-03 22:53:00 | 2026-10-03 15:53 |
Daily coastal maxima, October 1–5 UTC
| Station | Oct 1 | Oct 2 | Oct 3 | Oct 4 | Oct 5 |
|---|---|---|---|---|---|
| San Diego International | 78.1°F (25.6°C) | 93.9°F (34.4°C) | 102.9°F (39.4°C) | 100.0°F (37.8°C) | 96.1°F (35.6°C) |
| Los Angeles International | 75.9°F (24.4°C) | 84.0°F (28.9°C) | 100.0°F (37.8°C) | 100.0°F (37.8°C) | 100.9°F (38.3°C) |
How the charts were made
The hourly comparison uses the same NOAA Parquet files and quality filtering as the GHCNh Explorer. San Diego and LAX each have at least one valid temperature in every UTC hour of the 72-hour window, with some additional reports; this does not guarantee that the hottest instant was sampled. Van Nuys lacks a valid temperature in one hour. All nine sampled peaks agree with SSOD maxima for their corresponding UTC dates. SSOD is derived from GHCNh, so that agreement is a consistency check rather than an independent observation. The coastal daily maxima carry NOAA’s * measurement code, meaning they were derived from hourly values; they can also miss a higher temperature between reports.
The seasonal comparisons use station-matched WMO 1991–2020 mean daily maximum temperature for October, from NOAA accession 0253808, version 2.2. Temperature differences use the Fahrenheit–Celsius scale conversion without adding the freezing-point offset. No monthly mean, historical rank or attribution estimate is calculated.
Download the hourly observations, daily summaries, station peaks, matched normals and coverage counts.
Data Sources
- NOAA GHCNh documentation, station metadata and San Diego’s 2026 hourly file and LAX’s 2026 hourly file.
- NOAA SSODv2 technical documentation explains UTC-day aggregation and measurement codes.
- NOAA SSODv2: San Diego’s 2026 daily file and LAX’s 2026 daily file.
- WMO 1991–2020 mean daily maximum normals, version 2.2, and NOAA’s WMO normals documentation.
- NWS San Diego discussion issued October 2 at 11:48 a.m. PDT: high pressure, offshore flow and a thin coastal marine layer.
- NWS San Diego discussion issued October 3 at 10:33 p.m. PDT: observed east winds reaching the coast. NWS product links show rolling bulletin versions; confirm the issue date when checking.
- NWS Los Angeles forecast discussion and NWS San Diego forecast discussion: October 7 evening bulletins documenting the ongoing event and forecast heat.