Spain October 2026 Flash Floods: EuroMeteo Gauges and OPERA Radar
Very heavy rainfall affected eastern and northeastern Spain during the opening days of October 2026. AEMET associated the unsettled conditions with cold air at middle and upper levels and Mediterranean moisture, while forecasting a cut-off low (depresión aislada en niveles altos, or DANA) west of the peninsula. The relative contributions of the large-scale circulation and local convective organization are not established by the gauge–radar comparison presented here. At Barcelona Airport, the reported core-period accumulation of 178.7 mm through 06:00 UTC on 5 October was equivalent to 214.0% of the station’s 1991–2020 October precipitation normal of 83.5 mm.
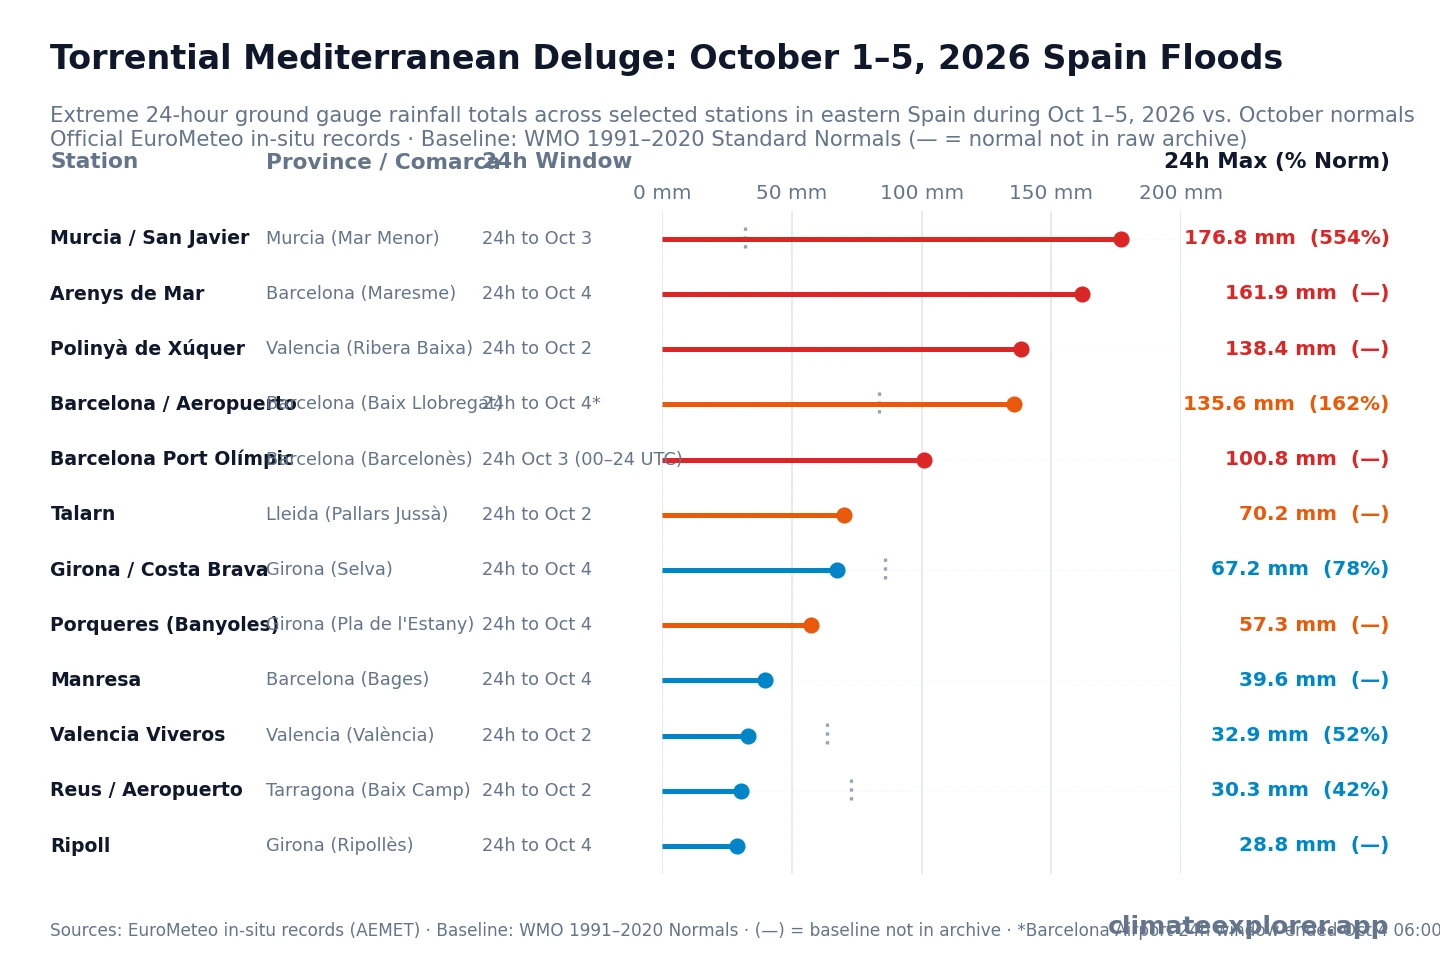
At Barcelona / Aeropuerto El Prat, the official rain gauge accumulated 181.4 mm across the 1–5 October episode (with 178.7 mm concentrated during the 3–5 October core storm, measured through the 5 October 06:00 UTC data cutoff). In EuroMeteo synoptic reports, the 24-hour accumulation ending at 06:00 UTC on 4 October reached 135.6 mm. In AEMET’s provisional extreme-value listing for observing date 3 October, a daily total of 135.6 mm was recorded for October maximum daily precipitation. According to AEMET’s provisional comparison, this value surpassed the station’s October maximum daily precipitation within the 1991–2020 climatological reference period (124.8 mm on 8 October 2002), though it remained below the full-series historical October record of 175.1 mm established on 3 October 1987. AEMET explicitly notes that these recent observations have undergone only automatic real-time quality checks and remain subject to final verification. Further up the coast at Arenys de Mar, a series of convective cloudbursts delivered 161.9 mm in 24 hours (in the 24 hours ending at 06:00 UTC on 4 October), peaking with 37.5 mm in a single hour.
This investigation examines the observational dynamics of the event by pairing in-situ surface rain gauge observations from the EuroMeteo explorer with instantaneous precipitation rate time series extracted from the European OPERA weather radar composite network. Comparing in-situ physical funnel catches (measuring point rainfall depth) with radar-derived surface precipitation rate estimates based on reflectivity measurements aloft provides an exploratory look at convective pulses while highlighting essential observational distinctions between point ground measurements and volumetric remote sensing.
Atmospheric circulation and maritime moisture inflow
The heavy rainfall episode occurred within a complex, evolving synoptic and mesoscale environment:
Upper-Tropospheric Cut-Off Low (DANA): In its special advisory bulletin issued on 3 October 2026 (Aviso especial de fenómenos adversos nº 34/2026, issued at 14:32 on 3 October 2026), AEMET forecast increasing atmospheric instability associated with cold air at middle and upper levels, anticipating the detachment and isolation of a cut-off low (DANA) centered west of the Iberian Peninsula. The bulletin noted uncertainty in the system’s evolution and in the timing and location of precipitation maxima. Contemporary event analyses presented differing interpretations of the episode’s primary driver: while AEMET framed the broader synoptic risk around the approaching upper-level cut-off low, meteorologist Alberto Alcántara for 3Cat argued that the extreme downpours in Catalonia were not driven by a DANA or a major surface depression, but rather by organized mesoscale convective systems developing within a persistent easterly maritime inflow. These sources describe the episode from different temporal and spatial perspectives. This article presents the observations without independently resolving the respective contributions of the large-scale circulation and local convective organization.
Warm Mediterranean Waters and Boundary-Layer Moisture: Warm sea-surface conditions can support heat and moisture transfer to the atmosphere, depending on air–sea temperature and humidity contrasts, wind, and stability; the specific contribution of these fluxes to this event was not quantified here.
Low-Level Conveyor (Llevantada): Sourced from AEMET surface synoptic charts and Barcelona radiosounding observations operated by Meteocat at the University of Barcelona (08190, Barcelona Servei), a tightening surface pressure gradient between lower pressure southwest of the peninsula and a high-pressure ridge over Central Europe established an easterly to southeasterly low-level flow (llevantada). This maritime conveyor transported moisture toward the Catalan coastline.
Coastal Orographic Anchorage: Topographic models from the Institut Cartogràfic i Geològic de Catalunya (ICGC) show the steep relief of the Catalan Coastal Ranges (Serralada Litoral and Serralada Prelitoral), rising to 500–1,700 m within 15 to 30 km of the coastline. In regional meteorological studies, this relief is frequently cited as a plausible mechanical mechanism for lifting maritime inflow and anchoring quasi-stationary convective cells, potentially fostering repetitive storm trains across coastal catchments, though verifying whether terrain forcing anchored specific cells during this event requires dedicated mesoscale modeling.
In-situ gauges recorded severe accumulations across coastal Catalonia
Official surface synoptic stations compiled in EuroMeteo captured extreme accumulations across Catalonia and the Mediterranean coast:
- Barcelona / Aeropuerto El Prat (WMO ID
08181, WIGOS0-20000-0-08181): The airport rain gauge registered a total event rainfall of 181.4 mm across the 1–5 October period through the data cutoff (217.2% of the 1991–2020 baseline of 83.5 mm; 199.3% of the 1981–2010 normal of 91.0 mm), with 178.7 mm concentrated in the 3–5 October core storm window (214.0% of the 1991–2020 normal). In EuroMeteo synoptic reports, the 24-hour accumulation ending at 06:00 UTC on 4 October was 135.6 mm (162.4% of the 1991–2020 monthly normal), with 90.0 mm falling in 12 hours. In AEMET’s provisional extreme-value listing for observing date 3 October, a daily total of 135.6 mm was recorded for October maximum daily precipitation. AEMET’s provisional comparison confirms that this total exceeded the station’s October maximum daily precipitation within the 1991–2020 reference period (124.8 mm on 8 October 2002), while remaining below the historical October record of 175.1 mm set on 3 October 1987 (full 1924–2025 series). AEMET explicitly notes that these recent observations have undergone only automatic real-time quality checks and remain subject to final verification. - Arenys de Mar (WMO
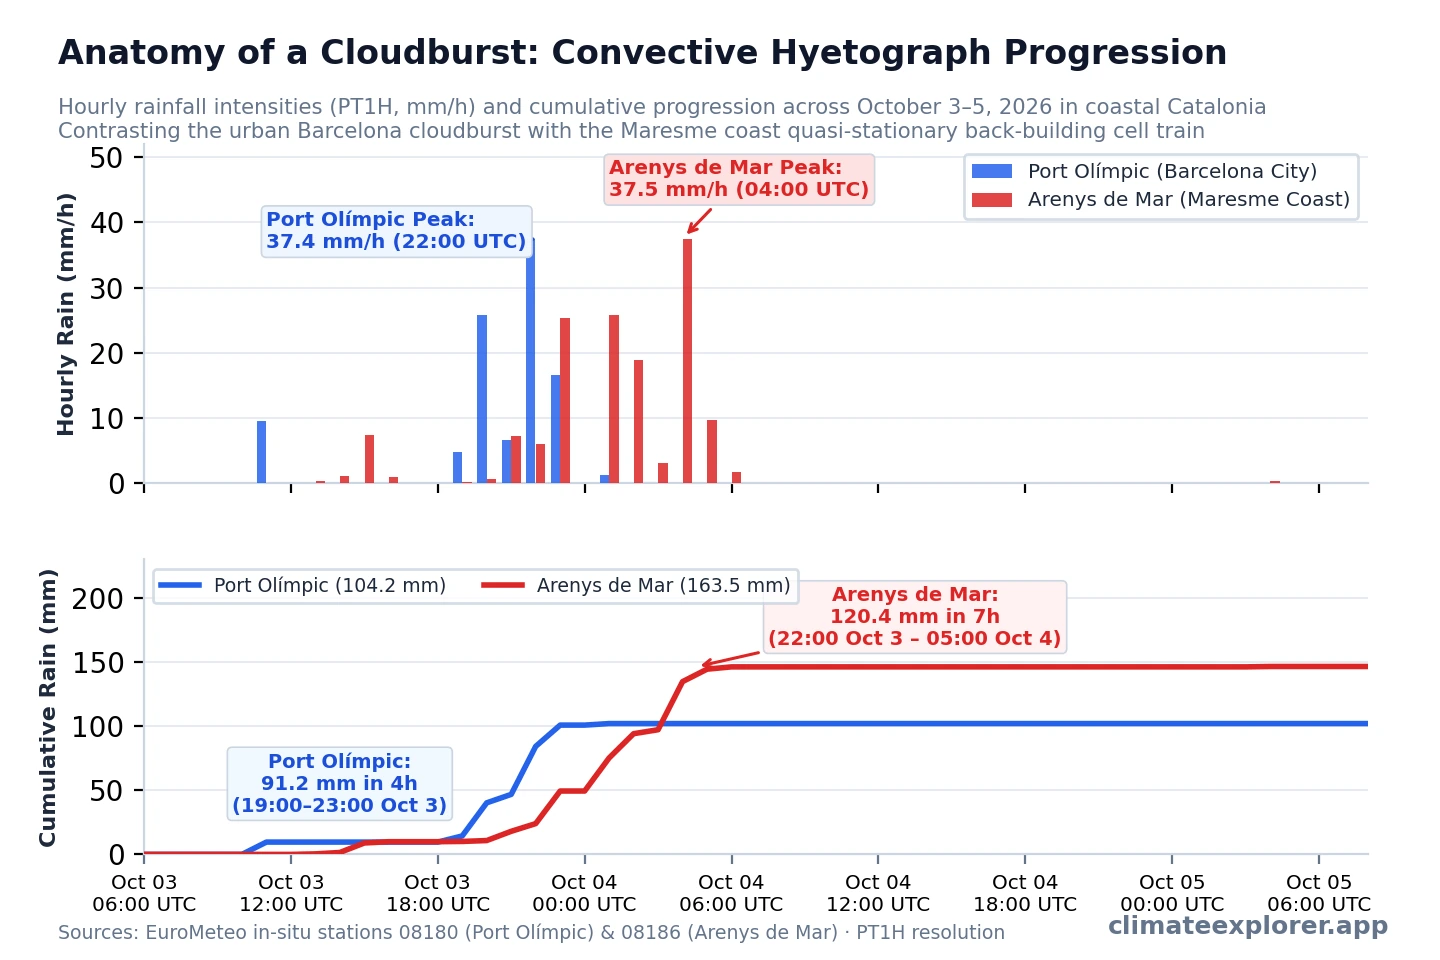
08186, WIGOS0-20000-0-08186, Maresme coast): Station records show an event accumulation of 163.5 mm, with 161.9 mm falling in the 24 hours ending at 06:00 UTC on 4 October (spanning 06:00 UTC on 3 October to 06:00 UTC on 4 October, assigned to observing date 4 October). High-resolution hourly data reveal that the storm hit as an elongated sequence of severe convective pulses: 25.4 mm at 23:00 UTC on 3 October, 25.8 mm at 01:00 UTC on 4 October, 18.9 mm at 02:00 UTC, and a peak pulse of 37.5 mm in a single hour at 04:00 UTC. In the 7 hours between 22:00 UTC and 05:00 UTC, the gauge accumulated 120.4 mm. - Barcelona, Port Olímpic (WMO
08180, WIGOS0-20000-0-08180, central city coastline): Central Barcelona experienced a concentrated cloudburst during the late evening of 3 October. In the 4-hour window from 19:00 to 23:00 UTC, the gauge recorded 91.2 mm (including 25.8 mm at 20:00 UTC, 37.4 mm at 22:00 UTC, and 16.6 mm at 23:00 UTC), bringing the 24-hour total to 100.8 mm (calculated across the 24 hours from 00:00 UTC on 3 October to 00:00 UTC on 4 October, from hourly observations) and the event total to 104.2 mm. - Regional Southern & Inland Gauges: Further south along the moisture conveyor, Polinyà de Xúquer in Valencia (
08287) recorded 185.8 mm across the episode (138.4 mm in 24 hours on 2 October; peak 1-hour rate of 31.4 mm/h). In Murcia, San Javier Airport (08433) registered an event total of 178.2 mm (558.6% of its WMO 1991–2020 October normal of 31.9 mm; 456.9% of the 1981–2010 normal of 39.0 mm), with 176.8 mm falling in a single 24-hour period on 3 October (554.2% of the 1991–2020 normal; 453.3% of the 1981–2010 normal). This single 24-hour catch represented 59.6% of the station’s entire annual climatological rainfall under the 1991–2020 normal (296.8 mm) and 56.5% of the AEMET 1981–2010 annual normal (313.0 mm). Note that while monthly normal percentages illustrate rainfall magnitude relative to average conditions, they do not denote statistical return periods or recurrence intervals, which require localized extreme-value distribution modeling.
Regional spatial variability and localized reports (>200 mm)
Initial meteorological bulletins from AEMET and regional civil protection services reported localized accumulations exceeding 200 mm in parts of the Barcelona metropolitan area and neighboring comarcas (notably in sectors of the Maresme and Vallès Oriental, such as Tordera and Montornès del Vallès). In the open EuroMeteo network, official synoptic and automated stations recorded peak event accumulations of 181.4 mm at Barcelona Airport (including 135.6 mm in 24 hours) and 163.5 mm at Arenys de Mar (161.9 mm in the 24 hours ending 06:00 UTC on 4 October).
Protecció Civil activated the INUNCAT alert phase on 30 September 2026 ahead of the forecast heavy rainfall, maintaining it through early October. By 3 October, the plan was escalated to its emergency phase (fase d’emergència), with precautionary restrictions on mobility and outdoor activities applying from 20:00 on 3 October to 14:00 on 4 October. Emergency services responded to localized flood-related incidents during the night of 3–4 October across the Maresme comarca and the Barcelona metropolitan belt—including flooded underpasses, ground-floor inundations, and swelling of coastal torrents (rieres such as the Riera d’Arenys)—accompanied by traffic diversions and disruptions on the coastal Rodalies commuter rail line (R1).
These heavy regional accumulations illustrate the pronounced spatial variability characteristic of Mediterranean convective systems, where narrow, quasi-stationary convective bands produce sharp gradients over short distances. However, reports from other networks or adjacent municipalities do not serve as numerical confirmation or validation of the measurements recorded at Barcelona Airport or Arenys de Mar. Each gauge measures rainfall at its particular location. Furthermore, observing a peak hourly rate between 35 and 45 mm/h (such as 37.5 mm/h at Arenys de Mar or 37.4 mm/h at Port Olímpic) indicates intense localized convective activity, but does not by itself prove sustained duration over multi-hour intervals; generating totals exceeding 200 mm requires either several consecutive hours of intense precipitation or repeated cell training over the same basin.
OPERA radar estimated instantaneous surface rain rates from reflectivity aloft
Weather radar provides continuous spatial and temporal tracking across Europe. Using the OPERA radar explorer, single-pixel time series were extracted from the permanent GeoZarr archive (RATE composite product, 2 km Cartesian grid, 15-minute cadence). Rather than spatial interpolation, extraction used the grid cell containing the station’s reference coordinates (for Barcelona Airport, EuroMeteo/WMO catalog lists 41.2969° N, 2.0783° E, while AEMET station directory 0076 catalogues 41.2928° N, 2.0700° E—a ~0.83 km difference across metadata versions). The selected radar pixel center is at 41.299° N, 2.086° E, situated approximately 0.7 km from the EuroMeteo coordinates and 1.5 km from the AEMET catalog entry. In the OPERA NIMBUS processing pipeline, the RATE composite represents a radar-derived estimate of instantaneous surface rainfall intensity (mm/h), calculated from volume reflectivity scans aloft using the standard Marshall-Palmer relation (\(Z = 200 R^{1.6}\)). These estimates are subject to observational uncertainties related to beam altitude, drop-size distribution shifts, and spatial-temporal sampling:
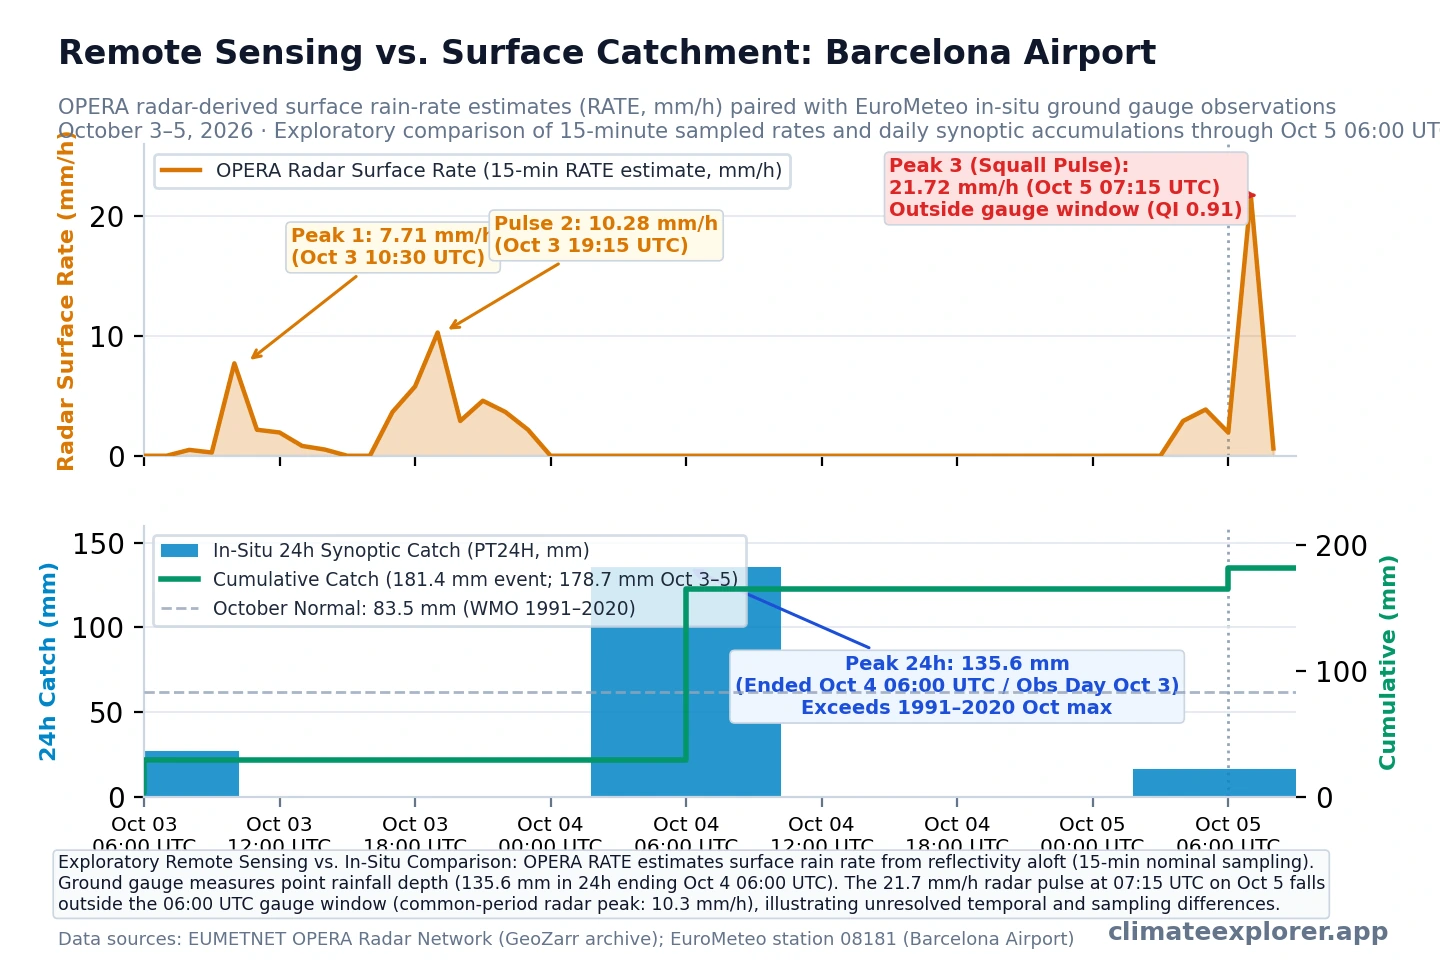
- Barcelona Airport (Coastal Lowland): For Barcelona Airport, the available radar extract spans through 12:00 UTC on 5 October, whereas in-situ gauge records are reported through the synoptic cutoff of 06:00 UTC on 5 October. Within the common comparison interval ending at 06:00 UTC on 5 October, OPERA radar recorded a maximum sampled instantaneous surface rain rate of 10.28 mm/h (at 19:15 UTC on 3 October), alongside an earlier sampled pulse of 7.71 mm/h on the morning of 3 October (10:30 UTC). In the full available radar extract, the peak instantaneous rate reached 21.72 mm/h at 07:15 UTC on 5 October (with rolling 1-hour radar accumulation
ACRRpeaking at 6.90 mm at 07:30 UTC), but this later squall pulse occurred outside the reported gauge coverage window. The composite quality index (RATE_quality_qi_total) reached 0.91 during these intervals. In EUMETNET’s published NIMBUS documentation, the total quality index is the minimum of three BALTRAD quality indicators associated with anomaly filtering (bropo), beam blockage (beamb), and satellite-based filtering (satfilter). The index should be interpreted according to the applicable processing version and should not be treated as an absolute measure of rainfall accuracy. EUMETNET cautions that the index can evaluate to 1.0 when none of those specific filters has been applied. - Barcelona Port Olímpic (Urban Coastal Fringe): Over central coastal Barcelona (pixel center 2.200° E, 41.391° N), OPERA radar captured the opening convective surge of the evening storm, recording a maximum sampled instantaneous surface rate of 43.34 mm/h at 19:30 UTC on 3 October (\(QI = 0.91\)). Ground gauge recordings show that this initial pulse was followed by successive convective bursts: 25.8 mm accumulated in the hour ending at 20:00 UTC, culminating in a secondary cloudburst of 37.4 mm in the hour ending at 22:00 UTC.
- Arenys de Mar (Maresme Convective Axis): Along the narrow coastal strip northeast of Barcelona (pixel center 2.540° E, 41.587° N), radar detected sustained high-intensity echoes during the overnight sequence of convective cells, peaking at a maximum sampled surface rate of 32.50 mm/h at 03:45 UTC on 4 October (\(QI = 0.91\)), closely aligned with the station’s peak hourly surface catch (37.5 mm recorded in the hour ending at 04:00 UTC).
- Inland and Mountain Stations: For inland stations such as Talarn in the Pre-Pyrenean foothills (
08112), the primary rainfall occurred during an earlier rainfall episode on 2 October (70.2 mm in 24 hours, with a 1-hour burst of 50.8 mm) prior to the 3–5 October coastal storm. During the main coastal convective episode on 3–5 October, radar rates extracted at the interior Talarn pixel remained minimal. Stations where radar time-series extractions were not performed for the 3–5 October window (including Girona, Porqueres, Reus, and Manresa) are marked as unqueried (—) in Table 2 to maintain strict archive fidelity.
Observational considerations: point rain gauges vs. radar surface estimates
The comparison between EuroMeteo ground gauges and OPERA radar curves highlights fundamental physical distinctions in how precipitation is observed:
- Point Collector Funnels vs. Volumetric Remote Sampling: A rain gauge provides a point measurement of accumulated rainfall at ground level. In contrast, OPERA composite
RATEprovides a radar-derived estimate of instantaneous surface rain rate based on volume backscatter reflectivity (\(Z\)) measured within a sampling volume aloft, with sampling height and spatial representativeness varying according to radar scan geometry and topography across a 2 km horizontal grid cell. An instantaneous rate in mm/h and a 24-hour accumulated depth in mm represent fundamentally different physical and temporal dimensions and cannot be compared directly as evidence of radar accuracy. While nominal 15-minute radar sampling captures snapshot intensity pulses, discrete scan intervals can miss brief downpours between sweeps. Differences between peak times may reflect discrete sampling intervals, differing observation windows, or beam elevation effects; their precise causes cannot be determined from this exploratory comparison alone. - Horizontal Wind Drift: Strong low-level maritime winds may advect falling raindrops horizontally between the altitude of radar beam detection and the surface. In the presence of vertical wind shear and downdrafts, horizontal drift is a plausible physical hypothesis explaining why the core of a convective echo detected aloft in one radar pixel may deposit its highest rainfall in an adjacent area or neighboring gauge.
- Topographic Beam Blockage and Quality Index: The total quality index in NIMBUS composite products reflects BALTRAD processing filters (
bropofor anomaly filtering,beambfor beam-blockage analysis, andsatfilterfor satellite consistency). While the extracted coastal pixels reported high QI values (0.91), these metrics should be interpreted according to published EUMETNET guidelines; they do not establish radar accuracy or eliminate the possibility of partial beam occultation by complex coastal topography at low scan elevations. Without comprehensive scan geometry and beam propagation modeling for each contributing radar, topographic shielding remains a plausible hypothesis rather than an established event-specific diagnosis. - Sub-Cloud Microphysical Processes: Below the radar beam altitude, microphysical processes in warm maritime air—such as drop coalescence, droplet breakup, or evaporation—can alter raindrop size distributions before precipitation reaches the surface funnel. These sub-cloud processes, together with potential departures from the standard Marshall-Palmer conversion (\(Z = 200 R^{1.6}\)), represent recognized sources of estimation error in radar-derived surface precipitation rates.
Explore or verify the result: In the EuroMeteo Explorer, select Spain, choose stations BARCELONA/AEROPUERTO (
08181) or ARENYS_DE_MAR (08186), and inspect hourly (PT1H) and daily (PT24H) precipitation values for 1–5 October 2026. In the OPERA Radar Explorer, select the RATE product for October 3–5, 2026 to inspect animated surface rain-rate estimates and single-pixel rain rate time series across Catalonia. The EuroMeteo guide and OPERA radar guide explain parameter definitions, quality indicators, and export workflows.
Conclusion
Ground gauge observations from EuroMeteo demonstrate the severity of the October 3–5, 2026 storm sequence across coastal Catalonia. At Barcelona Airport, the official rain gauge accumulated 178.7 mm during the 3–5 October core storm window (181.4 mm across 1–5 October through the data cutoff). In EuroMeteo synoptic reports, the 24-hour total ending at 06:00 UTC on 4 October reached 135.6 mm, while AEMET’s provisional extreme-value listing for observing date 3 October recorded 135.6 mm for October maximum daily precipitation. This total surpassed the station’s October reference-period maximum within 1991–2020 (124.8 mm on 8 October 2002), though it remained below the historical October record of 175.1 mm set on 3 October 1987. Further north at Arenys de Mar, convective downpours yielded 161.9 mm in 24 hours (in the 24 hours ending 06:00 UTC on 4 October), driven by hourly rainfall bursts reaching 37.5 mm/h.
Quality-controlled rain gauges provide the principal in-situ reference for point rainfall, while retaining instrument, exposure and sampling uncertainties, but their discrete reporting intervals can obscure rapid sub-hourly precipitation pulses. Weather radar composites provide continuous spatial monitoring and estimate instantaneous surface rain rates based on reflectivity measured aloft. In this exploratory comparison, OPERA radar extractions resolved maximum sampled surface rain rates of 32.50 mm/h along the Maresme coast at Arenys de Mar and 43.34 mm/h at Port Olímpic. At Barcelona Airport, within the common observation window ending at 06:00 UTC on 5 October, the maximum sampled radar rate occurred at 19:15 UTC on 3 October (10.28 mm/h), falling within the 24-hour synoptic interval containing the largest gauge accumulation (135.6 mm). A stronger radar pulse of 21.72 mm/h occurred at 07:15 UTC on 5 October, after the available gauge reporting cutoff, and cannot be evaluated against the gauge series used here. These findings underscore that point in-situ catches and volumetric radar estimates cannot be directly equated without matched accumulation integrations, and that differences may stem from 15-minute scan sampling intervals, beam elevation, wind drift, unequal observation windows, or microphysical evolution below the beam. Crucially, while the synoptic environment combined upper-level trough dynamics with warm Mediterranean moisture, this exploratory radar–gauge comparison does not itself establish the specific dynamical mechanisms of the storm.
Data current as of October 5, 2026, 06:00 UTC (with updates through 12:00 UTC where noted). Observations compiled from EuroMeteo and OPERA radar composites.
Data Annex
Download the station metadata and event summary, regional Catalonia accumulations, and paired hourly in-situ gauge vs. OPERA radar time series.
| Station Name | WMO ID | WIGOS Identifier | Latitude (°N) | Longitude (°E) | Elevation (m) | Comarca / Region | Observational Role |
|---|---|---|---|---|---|---|---|
| Barcelona / Aeropuerto | 08181 |
0-20000-0-08181 |
41.2969 | 2.0783 | 4.0 | Baix Llobregat, Barcelona | Primary Synoptic Airport Gauge |
| Arenys de Mar | 08186 |
0-20000-0-08186 |
41.5872 | 2.5400 | 74.0* | Maresme, Barcelona | Coastal Automated Weather Station |
| Barcelona, Port Olímpic | 08180 |
0-20000-0-08180 |
41.3906 | 2.2000 | 26.0* | Barcelonès, Barcelona | Urban Coastal Automated Station |
| Manresa | 08174 |
0-20000-0-08174 |
41.7199 | 1.8403 | 238.0 | Bages, Barcelona | Inland Foothills Station |
| Girona / Costa Brava | 08184 |
0-20000-0-08184 |
41.9008 | 2.7606 | 143.0 | Selva, Girona | Synoptic Airport Station |
| Porqueres (Banyoles) | 08120 |
0-20000-0-08120 |
42.1044 | 2.7636 | 175.0 | Pla de l’Estany, Girona | Pre-Pyrenean Automated Station |
| Talarn | 08112 |
0-20000-0-08112 |
42.2047 | 0.8647 | 807.0 | Pallars Jussà, Lleida | Pre-Pyrenean Mountain Station |
| Reus / Aeropuerto | 08175 |
0-20000-0-08175 |
41.1475 | 1.1672 | 71.0 | Baix Camp, Tarragona | Southern Catalonia Synoptic Airport |
| Polinyà de Xúquer | 08287 |
0-20000-0-08287 |
39.1839 | -0.3714 | 12.0 | Ribera Baixa, Valencia | Selected Mediterranean Coastal Station |
| Murcia / San Javier | 08433 |
0-20000-0-08433 |
37.7750 | -0.8125 | 4.0 | Mar Menor, Murcia | Southern Mediterranean Inflow Gauge |
| Station Name | WMO ID | Event Total (mm) | Max 24-h Rain (mm) | Observing Date of Max 24-h | Peak Hourly Gauge (mm/h) | Peak OPERA Radar Surface Rate (mm/h) | WMO 1991–2020 Normal (mm) | Event % of 1991–2020 Normal | WMO 1981–2010 Normal (mm) | Event % of 1981–2010 Normal |
|---|---|---|---|---|---|---|---|---|---|---|
| Polinyà de Xúquer | 08287 |
185.8 | 138.4 | 2026-10-02 | 31.4 | — | — | — | — | — |
| Barcelona / Aeropuerto | 08181 |
181.4 | 135.6 | 2026-10-03 (Obs Day) | not available in the extract used here | 10.3 (21.7†) | 83.5 | 217.2% | 91.0 | 199.3% |
| Murcia / San Javier | 08433 |
178.2 | 176.8 | 2026-10-03 | not available in the extract used here | — | 31.9 | 558.6% | 39.0 | 456.9% |
| Arenys de Mar | 08186 |
163.5 | 161.9 | 2026-10-04 | 37.5 | 32.5 | — | — | — | — |
| Barcelona, Port Olímpic | 08180 |
104.2 | 100.8* | 2026-10-03 | 37.4 | 43.3 | — | — | — | — |
| Girona / Costa Brava | 08184 |
85.7 | 67.2 | 2026-10-04 | not available in the extract used here | — | 86.0 | 99.7% | 87.9 | 97.5% |
| Talarn | 08112 |
82.4 | 70.2 | 2026-10-02 | 50.8 | — | — | — | — | — |
| Porqueres (Banyoles) | 08120 |
72.3 | 57.3 | 2026-10-04 | 18.9 | — | — | — | — | — |
| Reus / Aeropuerto | 08175 |
50.0 | 30.3 | 2026-10-02 | not available in the extract used here | — | 72.8 | 68.7% | 72.5 | 69.0% |
| Manresa | 08174 |
49.2 | 39.6 | 2026-10-04 | 8.4 | — | — | — | — | — |
Data Sources
- EuroMeteo European surface weather observations archive: in-situ precipitation measurements and synoptic station metadata across Spain.
- OPERA European weather radar composite program: EUMETNET OPERA instantaneous rain rate (
RATE) and rolling accumulation (ACRR) composites. - AEMET (Agencia Estatal de Meteorología): official meteorological bulletins, radar network operations, and station climatology for Spain.
- Meteocat (Servei Meteorològic de Catalunya): regional automatic weather station observations, radiosoundings, and meteorological warnings across Catalonia.
- Protecció Civil de la Generalitat de Catalunya: activation and escalation of the INUNCAT emergency plan (alert phase on 30 September; emergency phase on 3–4 October 2026) and incident logs across Catalonia.
- ICGC (Institut Cartogràfic i Geològic de Catalunya): high-resolution digital elevation models and topographic profiles of the Catalan coastal mountain ranges (Serralada Litoral and Prelitoral).
- WMO OSCAR/Surface Station Directory: official station coordinates, barometer elevations, and WIGOS station identifier registry.
- WMO Climatological Standard Normals: baseline monthly precipitation normals for official Spanish synoptic stations.