What a Weathergami Plot Reveals About Daily Temperature
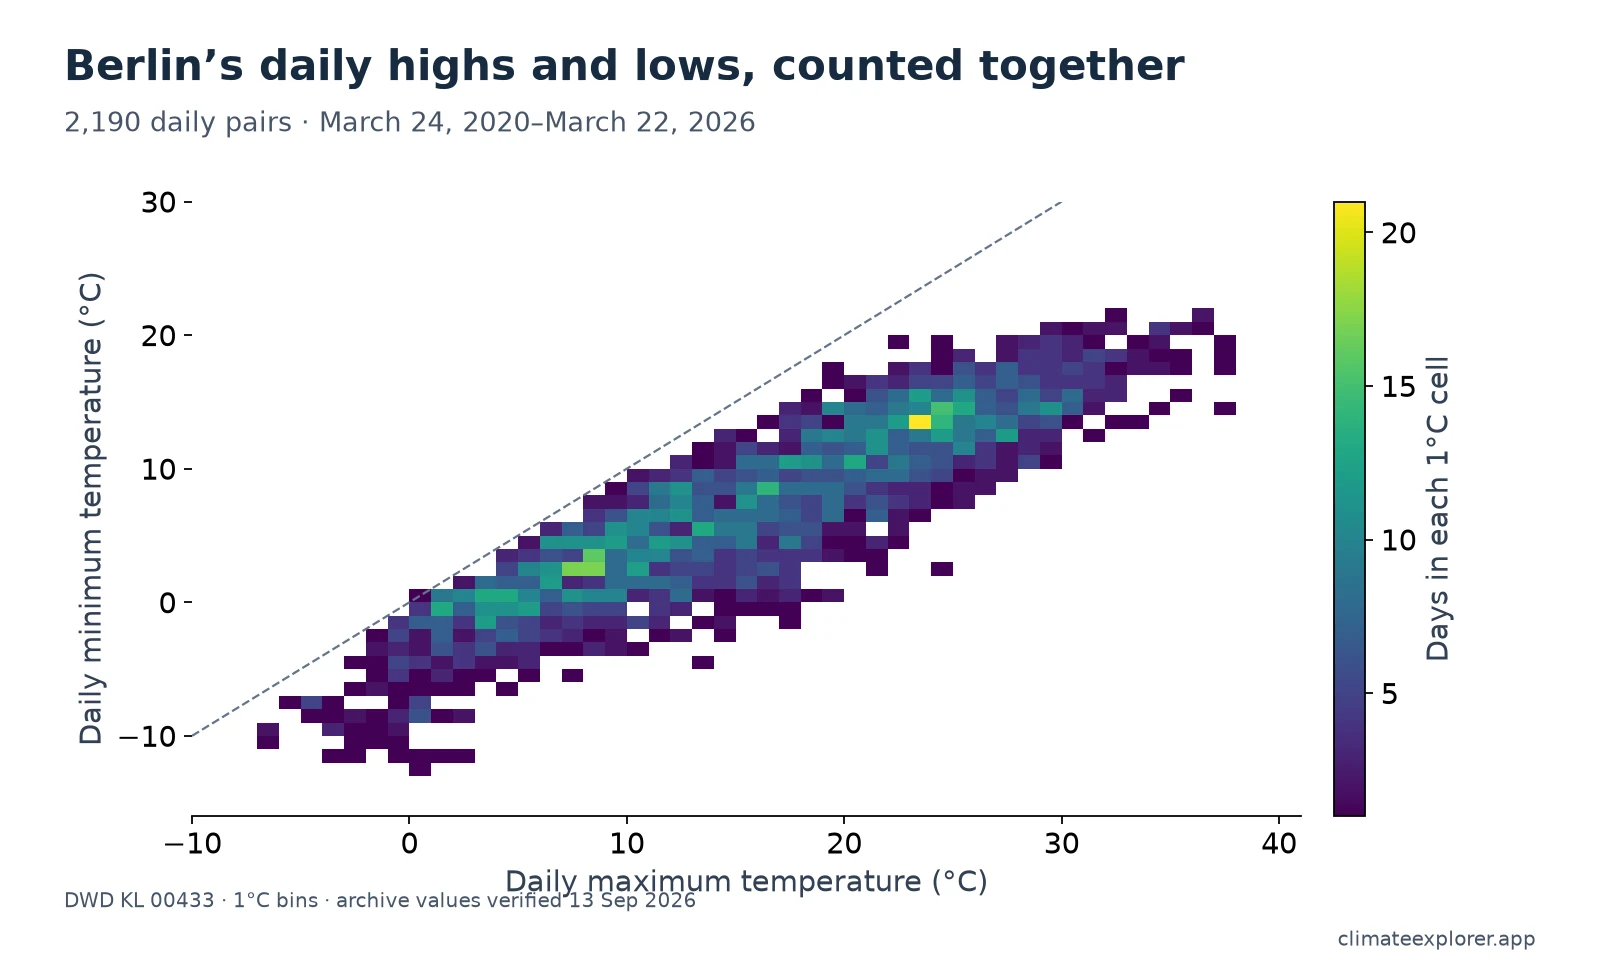
A day with a high of 30°C and a low of 15°C belongs in a different part of a temperature chart from a day with the same high and a low of 22°C. A Weathergami plot keeps those high–low pairs together and counts how often similar combinations occurred.
This example uses 2,190 daily pairs from Berlin-Tempelhof, March 24, 2020–March 22, 2026. It is a summary of that selected record, with the dates deliberately collapsed into counts.
Start with one cell
The horizontal axis gives the daily maximum; the vertical axis gives the daily minimum. A cell spanning 30–31°C horizontally and 15–16°C vertically collects days whose high and low both fall in those intervals. Its colour tells you how many such days there were. It does not show temperature or the date of the observation.
The cell width matters. Larger bins combine more different days and tend to contain larger counts. Compare two charts only after checking their bin widths and colour scales.
The diagonal shows the daily range
The dashed line marks equal maximum and minimum temperatures. For measurements covering the same day, the maximum cannot be below the minimum. The underlying pairs must therefore lie on or below that line.
The vertical distance from a pair to the line is its daily range: maximum minus minimum. A 30°C high and a 15°C low give a 15°C range. That is a difference between two daily extrema, which need not occur in the afternoon and at night in every weather situation.
Binning can place the edge of a cell across the line even if all its underlying pairs are valid. Inspect the original values before treating a cell boundary as a data error.
What the Berlin record adds
In the underlying extract, 97 days reached at least 30°C, and 341 had a minimum below 0°C. The median daily range was 8.5°C. These values come from the daily pairs, rather than estimates read from coloured cells.
The plot preserves the combinations behind those counts. It shows whether a high maximum coincided with a relatively low or high minimum. A single mean temperature loses that pairing.
It does, however, lose chronology. The shape alone cannot tell you which observations were in summer, whether hot days came consecutively, or whether temperatures rose over the six years. Use a dated time series or separate seasonal panels to answer those questions.
Comparing records fairly
A longer series has more opportunities to fill a bin. For comparisons across stations or periods, use matched coverage and the same bins, or express each cell as a fraction of valid days. Also check whether both daily extrema are present: counting one variable’s available dates is not enough.
The Berlin extract has 2,190 valid pairs and covers partial years at both ends. It is not a 30-year climate normal. To inspect the records, open the Berlin DWD view, select Berlin-Tempelhof, and follow the DWD guide for the daily table. The paired CSV provides the exact input used here.
Data Annex
The chart uses DWD daily climate observations for Berlin-Tempelhof from 24 March 2020 through 22 March 2026. Each valid day contributes one daily maximum and one daily minimum; missing placeholders and rows where the maximum was below the minimum were excluded.
Station and dataset metadata
| Station | WIGOS ID | DWD station ID | Latitude | Longitude | Elevation | Variables |
|---|---|---|---|---|---|---|
| Berlin-Tempelhof | 0-20000-0-10384 |
00433 |
52.4676° N | 13.4020° E | 48 m | Daily maximum and minimum air temperature |
The WIGOS ID is the globally unique station identifier; the DWD ID is the provider key required to reproduce the archive download.
Chart-ready annual summary
| Year | Valid daily pairs | Lowest Tmin (°C) | Highest Tmax (°C) |
|---|---|---|---|
| 2020 (from 24 Mar) | 283 | −3.8 | 36.4 |
| 2021 | 365 | −12.5 | 36.6 |
| 2022 | 365 | −10.2 | 37.9 |
| 2023 | 365 | −8.6 | 35.5 |
| 2024 | 366 | −11.1 | 34.7 |
| 2025 | 365 | −11.6 | 37.6 |
| 2026 (through 22 Mar) | 81 | −11.4 | 19.4 |
The figure uses 1°C bins. Download the 2,190 chart-ready daily pairs to reproduce it. Both DWD archive files were retrieved again on September 13, 2026; all published daily pairs matched. The source files retain quality levels 3 and 9, so this check does not imply a uniform final quality status. Where the recent and historical archives overlapped, the recent row took precedence. No missing pair was imputed.
Data Sources
- DWD daily climate archive: Official daily maximum and minimum observations for Berlin-Tempelhof.