Poland’s September 2024 Rainfall: What the National Average Hid
In September 2024, Jelenia Góra recorded 293.0 mm of rain. Białystok, in northeastern Poland, recorded 15.9 mm. Those two station totals tell very different stories about the same month.
Across Poland as a whole, IMGW reported 67.9 mm, or 118% of the September normal. Here, “normal” means the average September rainfall over 1991–2020. The country was wetter than that reference average, but the national figure cannot tell a reader how much rain fell in their town.
Daily records add the timing. At Jelenia Góra and the nearby mountain station of Śnieżka, which recorded 296.0 mm, roughly two-thirds of the month’s rain accumulated in just five days.
The national average smooths out local differences
The national figure and the station totals answer different questions. The 67.9 mm figure summarizes precipitation across Poland. Each station value describes a measurement at one location.
An area average is useful for comparing one month or year with another at the national scale. But it can soften opposing local departures when very wet and very dry areas are combined. In September 2024, the national result was only 10.5 mm above the 1991–2020 average even though IMGW reported station totals ranging from less than 20 mm in parts of the northeast to more than 290 mm in the southwest.
IMGW’s station comparisons make the contrast clearer: Jelenia Góra received more than four times its September normal, while Białystok received less than one-third of its own. Those percentages use a separate reference average for each station.
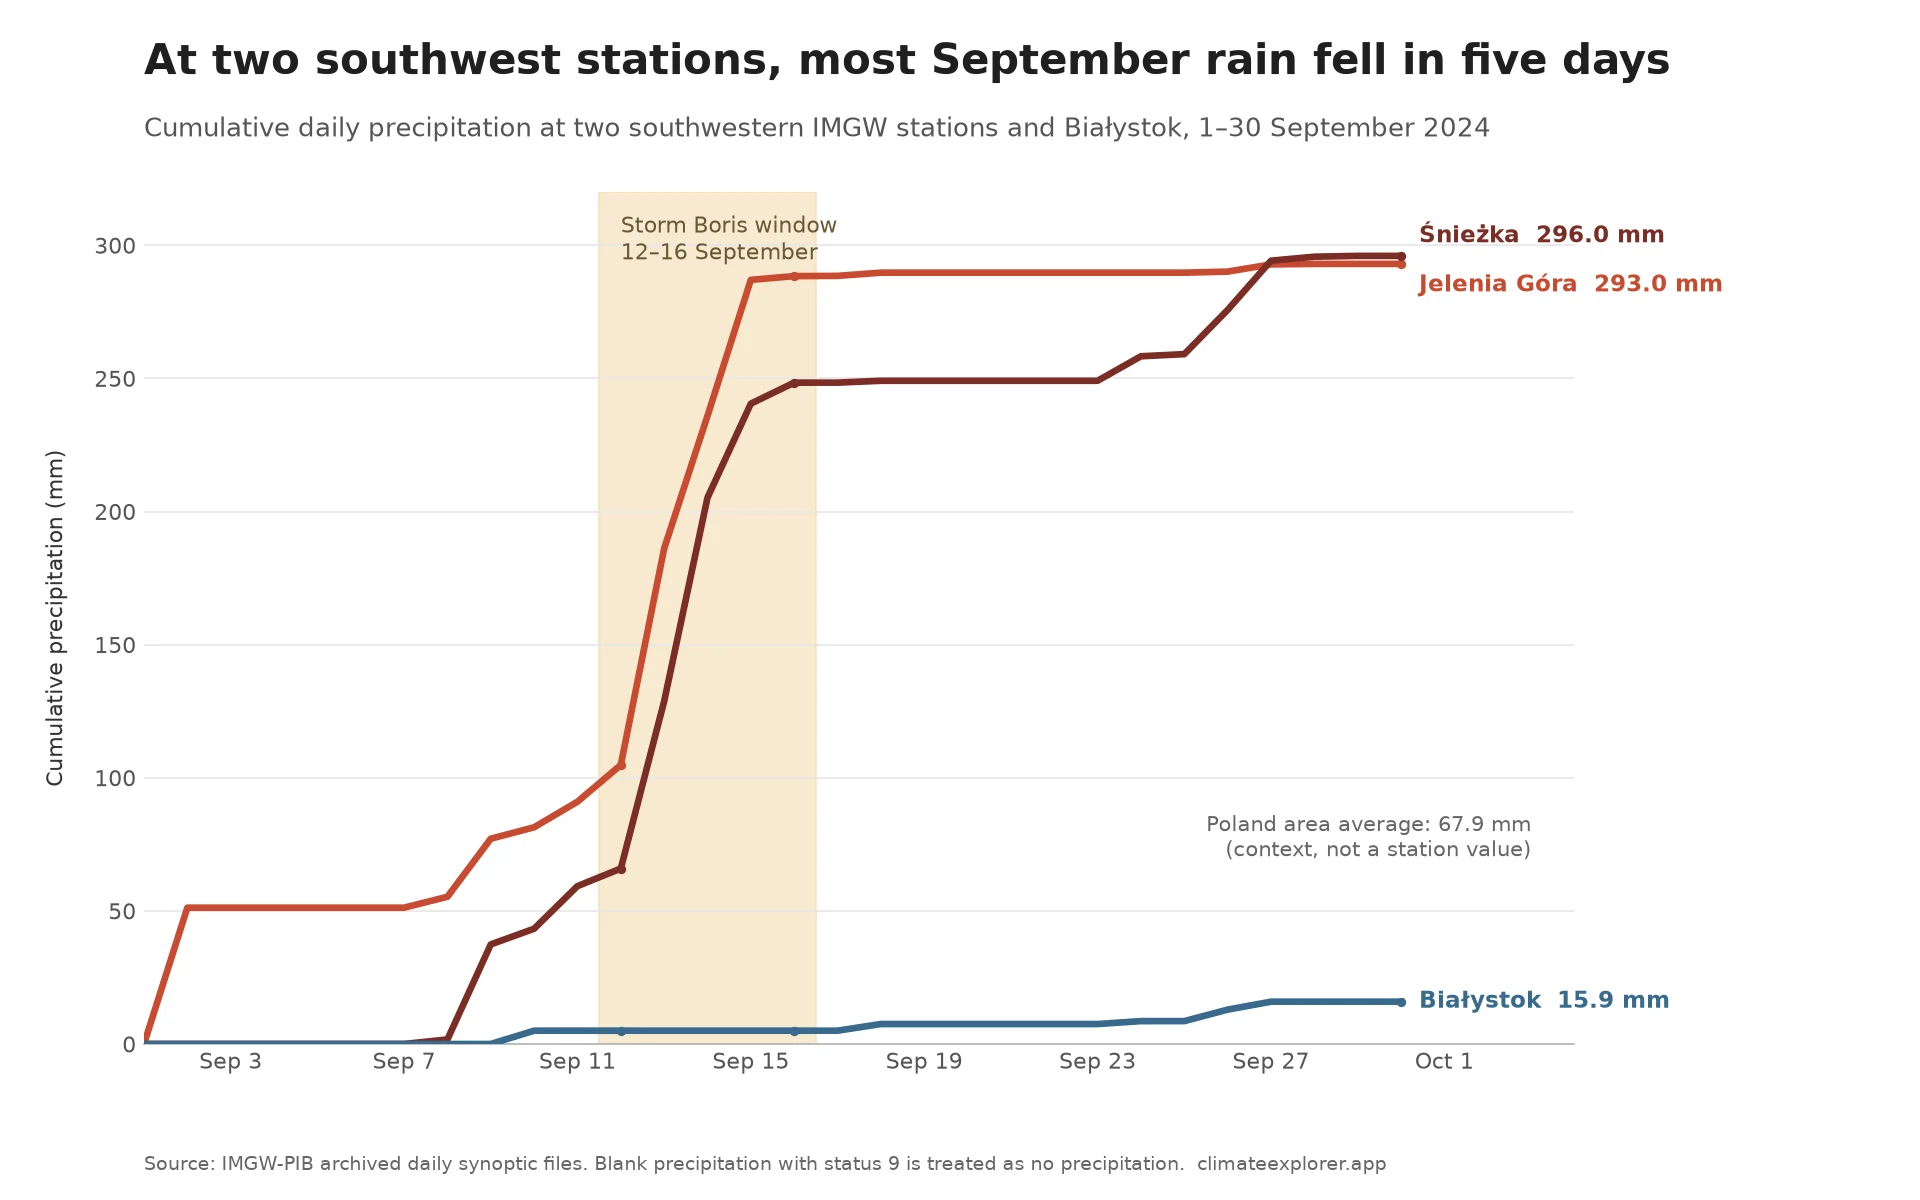
Five days supplied most of the rain at two southwestern stations
The daily observations add another layer that a monthly total cannot show. Copernicus identifies 12–16 September as the core five-day precipitation period associated with Storm Boris across central Europe.
During those five days, Jelenia Góra accumulated 197.4 mm and Śnieżka accumulated 189.1 mm. Those amounts supplied 67.4% and 63.9%, respectively, of the stations’ entire September totals. Białystok recorded 0.0 mm in the same window.
Follow the lines through the shaded window: both southwestern stations rise sharply while Białystok stays flat. The similar southwestern monthly totals also hide different daily sequences. Jelenia Góra’s wettest day was 13 September; Śnieżka’s was 14 September.
These are daily totals. They cannot identify the most intense hour or establish how rapidly rain fell within each day.
River peaks followed the main rainfall period
The timing places these observations within the wider Storm Boris event. A rain gauge measures precipitation at one point, however, while a river collects water from a much larger area. A station’s wettest day need not be the day a downstream river peaks.
Copernicus separates the 12–16 September precipitation period from later river-flow peaks. Its European assessment reports that flooding in the lower Oder peaked on 20 September, several days after the main five-day rainfall window.
The station data can therefore establish how much precipitation was recorded and when it accumulated. They cannot, by themselves, assign responsibility for particular flood impacts or show the rainfall received across an entire river basin.
Explore or verify the result: Open the IMGW Climate Explorer, choose Daily resolution, select Jelenia Góra, Śnieżka or Białystok, set the period to 1–30 September 2024, and inspect Daily Precipitation. IMGW-PIB owns and publishes the observations; Climate Explorer is an independent interface and is not affiliated with or endorsed by IMGW-PIB.
Data Sources and Verification
The analysis uses IMGW’s archived 2024 daily synoptic files for stations 500, 510 and 295. In those files, SMDB is the daily precipitation total in millimetres. IMGW’s format documentation defines status 9 as “no phenomenon,” so a blank precipitation field paired with that status was treated as zero. All three station series contain a resolvable value or no-phenomenon status for each of the 30 September dates.
Monthly totals were calculated by summing the 30 daily values. Event totals use the inclusive period from 12 through 16 September; event shares divide that five-day total by the station’s September total. Values are rounded to one decimal place for display.
The calculation keeps IMGW’s daily date labels. The cited file-format document does not specify their exact clock boundary, so this article does not equate them with midnight-to-midnight UTC days. The national ranking and station-normal comparisons come from IMGW’s published assessment; they were not recalculated from these three stations.
The live Climate Explorer was checked on 18 August 2026 using Daily resolution and the 1–30 September 2024 window. It returned the same monthly totals and daily peaks: 293.0 mm and 81.3 mm at Jelenia Góra, 296.0 mm and 76.5 mm at Śnieżka, and 15.9 mm and 5.0 mm at Białystok.
Station names and traditional WMO identifiers were cross-checked against NOAA/NCEI’s station-history table. The WIGOS identifiers in the annex use the corresponding 0-20000-0- form described in WMO guidance.
Conclusion
The national average answers how wet September was across Poland. The station records answer where the selected gauges differed and when their rain accumulated. Read together, they show a month with close to 300 mm at two southwestern stations, very little at Białystok, and much of the southwestern rain concentrated in 12–16 September. None of those three gauges stands for an entire region.
Editor’s note: This analysis uses historical IMGW files retrieved on 18 August 2026. On 11 September 2026, we rechecked the archived calculations and official context, clarified the daily-date convention and shortened the explanation. The reported totals are unchanged. Upstream files may be revised.
Data Annex
Station Metadata
| Station | IMGW identifier | WIGOS identifier | Latitude | Longitude | Elevation | Role in comparison |
|---|---|---|---|---|---|---|
| Jelenia Góra | 350150500 |
0-20000-0-12500 |
50.900° N | 15.800° E | 344 m | Southwestern foothill station |
| Śnieżka | 350150510 |
0-20000-0-12510 |
50.733° N | 15.733° E | 1,613 m | Southwestern mountain station |
| Białystok | 353230295 |
0-20000-0-12295 |
53.100° N | 23.167° E | 151 m | Northeastern comparison station |
Key Calculated Values
| Station | September total | 12–16 September | Share of monthly total | Wettest day |
|---|---|---|---|---|
| Jelenia Góra | 293.0 mm | 197.4 mm | 67.4% | 81.3 mm on 13 September |
| Śnieżka | 296.0 mm | 189.1 mm | 63.9% | 76.5 mm on 14 September |
| Białystok | 15.9 mm | 0.0 mm | 0.0% | 5.0 mm on 10 September |
Data Sources
- IMGW-PIB assessment of September 2024 climate conditions
- IMGW-PIB archived daily synoptic observations for 2024
- Exact station archives: Jelenia Góra, 500, Śnieżka, 510, and Białystok, 295. These contain the daily synoptic files used for the calculation.
- IMGW-PIB daily synoptic file format
- Copernicus European State of the Climate 2024 flooding assessment
- NOAA/NCEI Integrated Surface Database station history
- WMO guidance on WIGOS Station Identifiers