Nepal’s August 2026 Flash Flood: What Hourly Station Data Can—and Cannot—Show
Source assessment checked September 13, 2026; USGS closed its preliminary response page after August 28. Station availability below records the original August check.
On 26 August 2026, a fast-moving debris avalanche and flood travelled through the Lende Khola and into the Bhote Koshi–Trishuli river system in Nepal. The event is clear; its precise trigger is not.
The U.S. Geological Survey (USGS) reported that a rapid slope failure involving a glacier likely initiated the debris flow and flood. The agency estimated that the flow travelled nearly 100 kilometres and said the failure generated energy equivalent to a magnitude 5.2 earthquake. USGS also cautioned that it was still unclear whether the initial failure was a landslide that incorporated part of a glacier or a glacial collapse.
Hourly weather observations can add regional context, but they cannot resolve that uncertainty. The closest usable station found in the Nepal selection of NOAA’s Global Historical Climatology Network–Hourly (GHCNh) was Tribhuvan International Airport, approximately 66 kilometres from the USGS seismic-event location and far below the glacierized headwaters. Its record should not be treated as a rain gauge at the flood source.
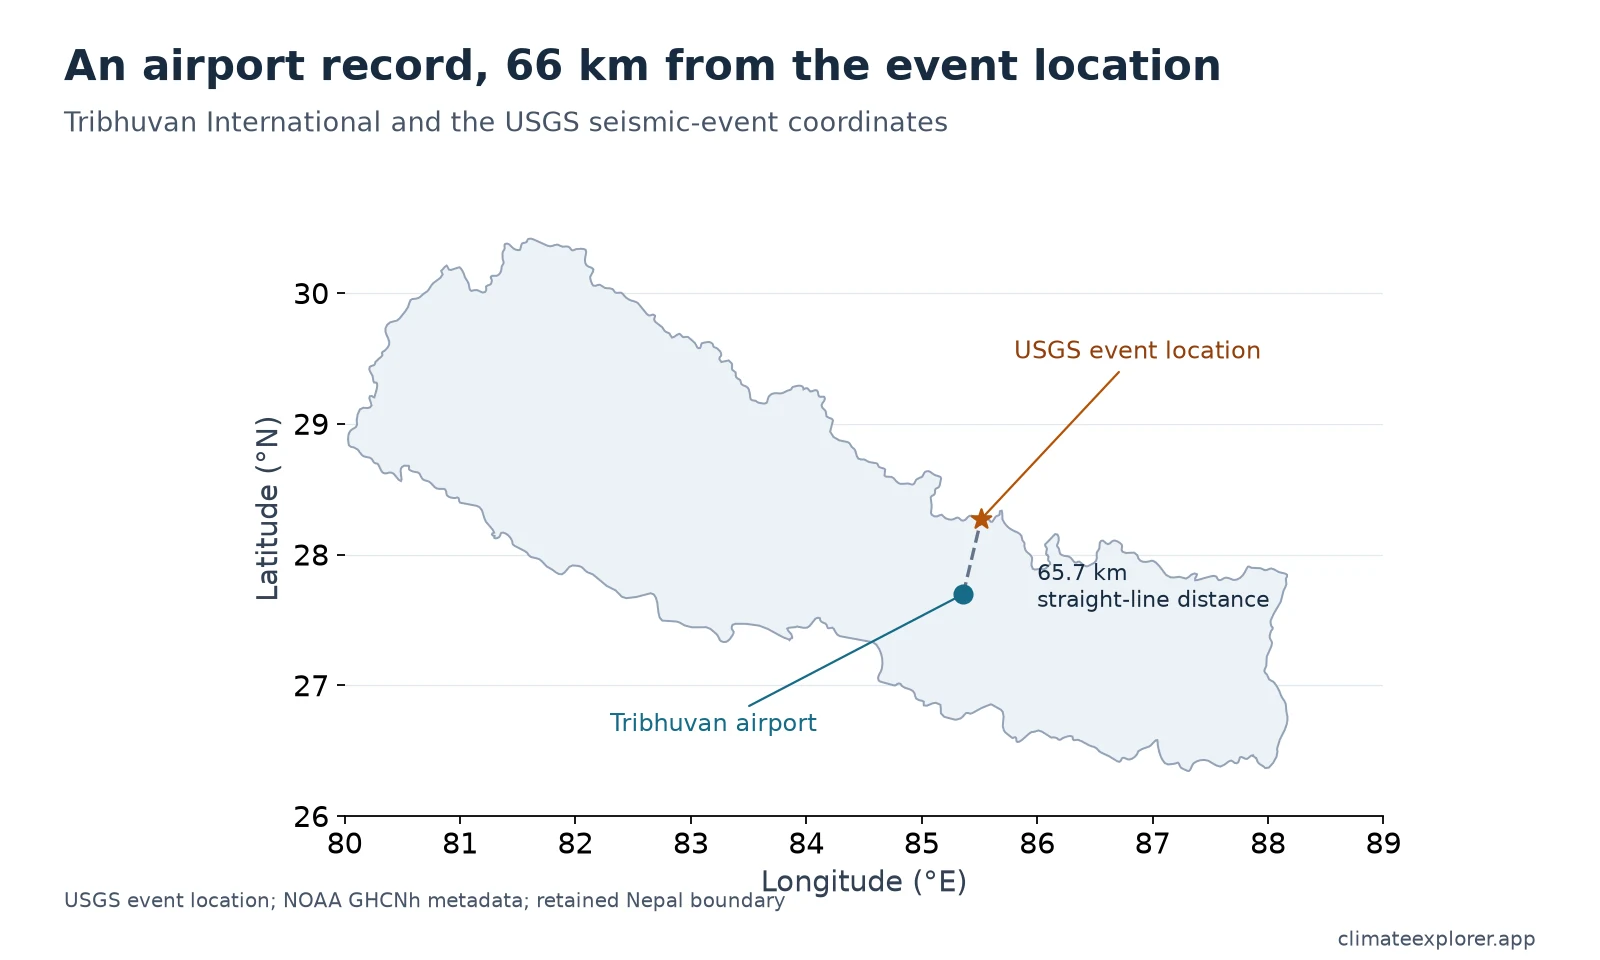
Tribhuvan was the closest usable station in the Nepal selection checked, and lies outside the high-mountain source area. The connecting line shows straight-line distance, not the flood path. Sources: USGS event coordinates and NOAA/NCEI GHCNh station metadata; current as of 29 August 2026.
Source update, September 13, 2026: USGS states that its response page was last updated on August 28 and will no longer be maintained. Its provisional findings are treated here as a dated assessment, not a live account of the investigation. The station-availability statement below remains the separate check made on August 29.
What the official assessments establish
The International Centre for Integrated Mountain Development (ICIMOD) said water levels began rising rapidly at about 09:00 local time on 26 August. Its preliminary assessment pointed to a possible ice-rock avalanche entering the Lende Khola, but it explicitly described the trigger as suspected and unconfirmed.
ICIMOD also reported that the Trishuli River at Galchhi rose by as much as nine metres in 30 minutes. That is useful evidence of the flood wave’s rapid downstream passage. It is not, by itself, a complete hydrograph: the underlying time series, gauge datum and quality-control record were not recovered for this analysis. Consequently, this article does not publish an absolute starting stage, peak stage, discharge estimate or modelled flood curve.
These sources support three conclusions:
- A large, sudden slope failure involving glacier ice occurred.
- The resulting debris flow and flood travelled far downstream through connected river channels.
- The exact failure type, initiating trigger and any temporary blockage remained under investigation in the USGS August 28 assessment, checked again on September 13.
Why the available station data do not prove a rainfall trigger
Early explanations can change quickly after a mountain disaster. In this case, a Public Service Broadcasting/Radio Nepal report, citing discussions between Nepal’s Department of Hydrology and Meteorology (DHM) and the China Meteorological Administration, said that neither side had records of heavy rain in the affected areas. DHM also said further study of the flood’s cause was needed.
That statement does not prove that no rain fell anywhere in the catchment. Sparse gauges, steep terrain and cross-border data gaps can leave important conditions unmeasured. It does mean that a confident claim that heavy rainfall triggered the slope failure was not supported by the source assessments cited here.
The station checked here and its limits
Tribhuvan International is identified in GHCNh as NPI0000VNKT. Its WIGOS identifier—the globally unique station identifier used by the World Meteorological Organization—is 0-20000-0-44454. The station is at 27.6966°N, 85.3592°E and 1,338.1 metres elevation.
Using the USGS seismic-event coordinates of 28.271°N, 85.515°E, the straight-line distance to Tribhuvan is 65.7 kilometres, rounded to approximately 66 kilometres. This makes Tribhuvan the closest usable station found in the active Nepal GHCNh selection, but not a representative measurement site for the high-mountain source area.
The distinction matters because an airport observation describes the atmosphere at one instrument location. It cannot directly measure:
- rainfall in an ungauged headwater catchment;
- the freezing level over a glacier;
- water pressure inside ice or fractured rock;
- the volume or timing of a slope failure; or
- river stage and discharge downstream.
Other GHCNh stations in Nepal are farther from the event, and several lie in different valleys or river basins. Adding them does not turn a sparse station network into a measurement of conditions at the failure site.
August is normally wet in Kathmandu—but that does not identify the trigger
A climate normal describes typical conditions over a long reference period; it is not an observation of one event. The WMO 1991–2020 Climatological Standard Normals identify the same WIGOS station as Kathmandu rather than Tribhuvan International. The shared identifier, 0-20000-0-44454, establishes the station crosswalk between the two datasets.
At this station, the normal August precipitation total is 342.7 millimetres, second only to July’s 383.8 millimetres. August also averages 22.7 days with at least 1 millimetre of precipitation. The original source review recorded 30 contributing years for these submitted values. The September review reproduced the 12 precipitation totals from the retained WMO composite; the provider station CSV returned a temporary service error, so the precipitation-day and contributing-year fields were not freshly rechecked.
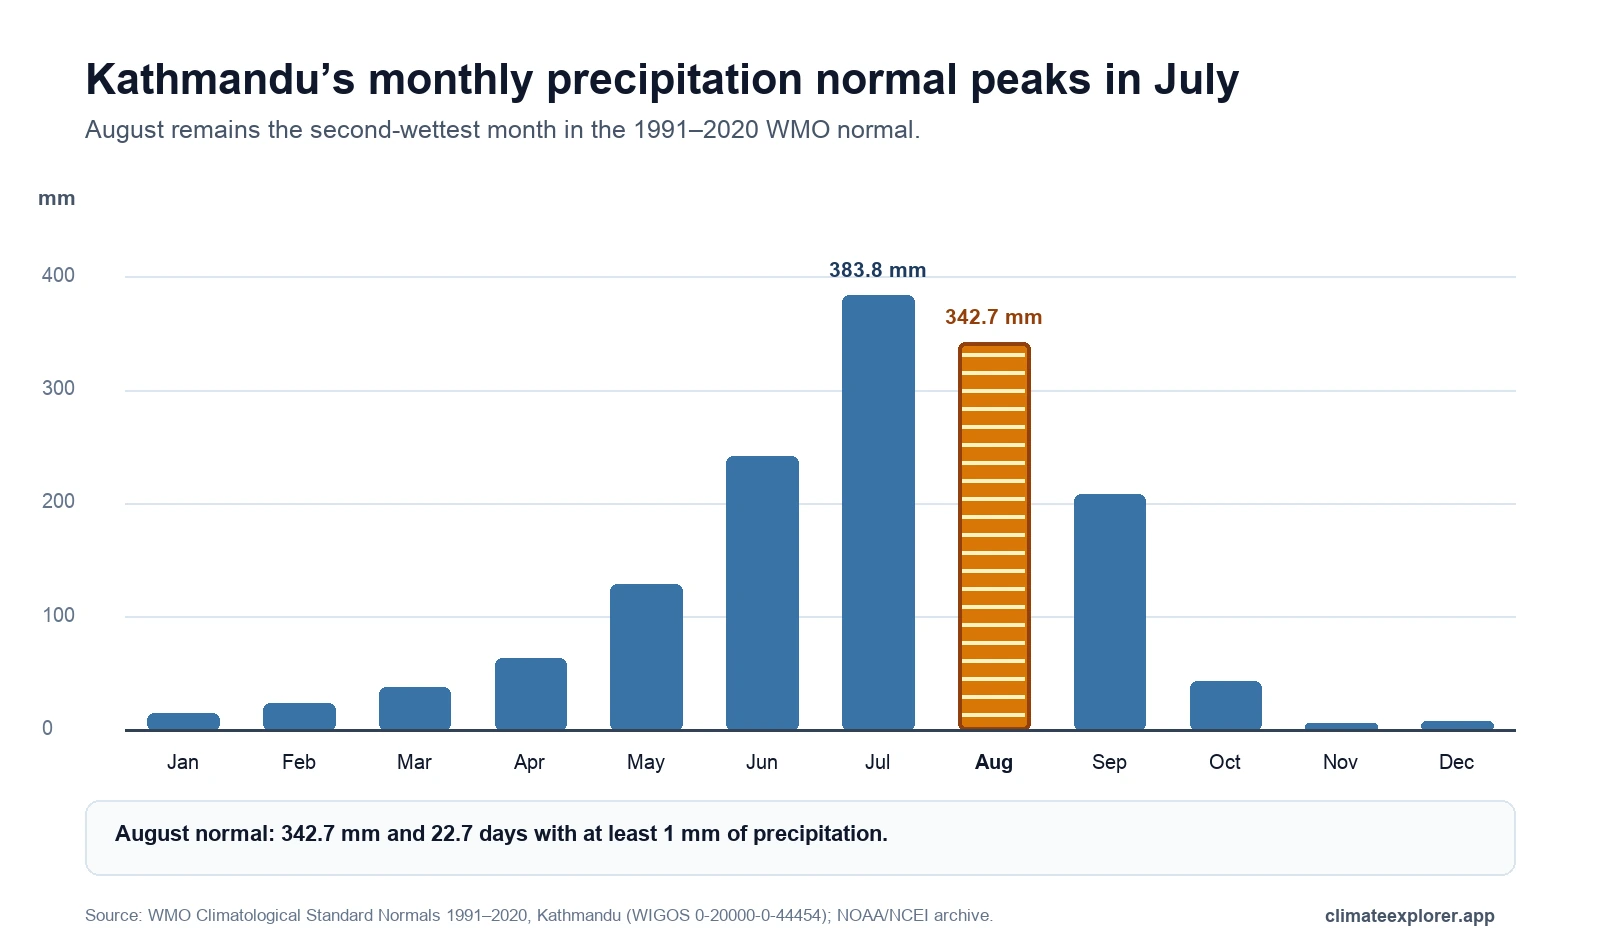
The monthly normal shows the strong summer rainfall season at one Kathmandu airport station. It does not measure precipitation during the 26 August flood or conditions in the high-mountain source catchment. Source: WMO Climatological Standard Normals 1991–2020, archived by NOAA/NCEI.
This context prevents two opposite misreadings. The official report of no heavy rain in the affected area does not mean August is normally dry. Equally, a wet August normal at Kathmandu does not show that rainfall caused this particular flood.
Explore the seasonal context: Open the Kathmandu WMO Normals view, confirm WIGOS
0-20000-0-44454, and select Precipitation to inspect the 1991–2020 monthly totals. WMO Members supplied the normals and NOAA/NCEI archives them; Climate Explorer is an independent interface.
What was available after the event
When checked on 29 August 2026, Climate Explorer displayed Tribhuvan observations through 27 August at 15:30 UTC. The event window was therefore available with roughly a two-day delay in this particular check. That delay should not be treated as a guaranteed update interval: NOAA ingestion, contributing networks, station reporting and Climate Explorer processing can all affect when a record appears.
GHCNh remains useful here for checking the regional sequence of temperature, humidity, wind, pressure, visibility and precipitation fields where the station reports them. It is a continuously updated archive, not a live operational flood-warning service.
Explore or verify the station record: Open the Tribhuvan International GHCNh view, confirm station
NPI0000VNKT, and inspect Plots and Data for 26–27 August 2026. Use Data → Export Hourly Excel for the selected interval. NOAA/NCEI is the upstream data owner; Climate Explorer is an independent interface.
Evidence needed beyond the airport record
A stronger post-event reconstruction would combine several sources that answer different questions:
- high-elevation rain gauges, radar or satellite precipitation estimates for the source catchment;
- atmospheric profiles or reanalysis data for the freezing level, with a documented calculation;
- satellite imagery before and after the failure to map the affected slope and estimate volume;
- raw DHM river-stage records with gauge datum, timing and quality flags; and
- seismic and field analysis to distinguish a glacier collapse from a landslide incorporating glacier ice.
Conclusion
Observational humility is essential when analyzing high-mountain natural hazards. The Tribhuvan International Airport record documents valley-level atmospheric conditions in Kathmandu, and the 1991–2020 WMO normal establishes that August is typically the city’s second-wettest month (averaging 342.7 mm). However, a valley airport gauge located 66 kilometres away cannot measure rainfall, freezing levels or geotechnical stability in a remote alpine headwater. Where official Nepalese and Chinese monitoring reported no heavy rain in the source catchment, asserting a meteorological trigger would be unsupported. A robust reconstruction requires satellite imagery, alpine instrumentation and field geomorphology rather than airport extrapolations.
Editor’s note: Data current as of August 29, 2026. Authoritative USGS event assessments, DHM river monitoring notices and WMO reference baselines were re-verified on September 13, 2026. Ongoing geotechnical investigations may refine understanding of the slope failure mechanism.
Data Annex
Station and event-location crosswalk
| Item | Identifier | Latitude | Longitude | Elevation | Role in this article |
|---|---|---|---|---|---|
| Tribhuvan International (GHCNh); Kathmandu (WMO Normals) | GHCNh NPI0000VNKT; WMO 00044454; WIGOS 0-20000-0-44454 |
27.6966°N GHCNh; 27.704°N WMO | 85.3592°E GHCNh; 85.356°E WMO | 1,338.1 m GHCNh; 1,337 m WMO | One station with dataset-specific names and metadata; regional context only |
| USGS seismic event | us7000tbwb |
28.271°N | 85.515°E | — | Location used for the station-distance calculation |
Calculation and data limitations
The 65.7-kilometre distance was calculated with the haversine great-circle formula and rounded to approximately 66 kilometres for display. It is a straight-line distance, not a road, river or terrain distance. No interpolation between stations was performed.
The article does not calculate event rainfall totals, freezing level, slope-failure volume, river discharge or flood-wave speed. The WMO values are fixed 1991–2020 monthly normals, not observations from August 2026. The reported nine-metre rise at Galchhi is retained as an attributed ICIMOD statement rather than converted into a synthetic hydrograph.
| Check | Result | Interpretation |
|---|---|---|
| Station-to-event distance | 65.7 km; displayed as approximately 66 km | Geographic separation, not a flow-path length |
| Latest Tribhuvan observation visible during review | 27 August 2026 at 15:30 UTC | Availability cutoff observed on 29 August; not a guaranteed latency |
| Kathmandu/Tribhuvan August precipitation normal | 342.7 mm; 22.7 days with at least 1 mm | WMO 1991–2020 station baseline; not event rainfall |
| Source-area rainfall | Not established | Tribhuvan cannot substitute for a headwater gauge |
| Failure trigger | Unconfirmed | Requires source-area, satellite, seismic and hydrological evidence |
The 12 monthly chart values preserve precipitation totals and precipitation-day normals from the submitted WMO station record.
Data Sources
- USGS event assessment: 2026 Nepal Debris Avalanche and Flash Flood; findings dated August 28, 2026, checked September 13; explicitly provisional and no longer updated.
- USGS seismic-event record: Event
us7000tbwb; coordinates used for the distance calculation. - ICIMOD event advisory: Major flash flood sweeps through Nepal’s Rasuwa district; preliminary chronology and reported river-level changes.
- Nepal DHM monitoring: Rasuwagadhi hydrological station; official monitoring interface. The raw Galchhi hydrograph used in early reporting was not recovered for this analysis.
- Nepal DHM/CMA statement: Public Service Broadcasting/Radio Nepal report; attributed statement that heavy rain was not recorded in the affected areas and the cause required further study.
- NOAA/NCEI upstream dataset: Global Historical Climatology Network–Hourly; authoritative archive owner.
- WMO 1991–2020 climate normals: NOAA/NCEI WMO Climate Normals and the official Kathmandu station CSV; monthly precipitation and precipitation-day normals for WIGOS
0-20000-0-44454, with 30 contributing years reported for every month. - Climate Explorer verification interface: Tribhuvan International, 26–27 August 2026; checked 29 August 2026. Climate Explorer retrieves and presents NOAA/NCEI data and may lag the upstream archive.
- Climate Explorer normals interface: Kathmandu precipitation normal; reader-facing view of the WMO 1991–2020 station normal.
- WMO OSCAR/Surface metadata: Station record for WIGOS
0-20000-0-44454; stable identifier cross-check. Nepal DHM WIS2 messages using the same identifier were also inspected on 29 August 2026.