How moisture from Hurricane Polo helped flood Iowa and Illinois
Polo broke up over Mexico. Its remaining moisture helped feed heavy rain farther inland.
Parts of eastern Iowa and northwestern Illinois received 3–5 inches of rain (76–127 mm) during 29 September–1 October 2026, according to the National Weather Service in Quad Cities. The rain flooded roads and basements in affected communities.
The Weather Service links the rain to moisture left from Hurricane Polo and a slow-moving front—a boundary where warmer and cooler air meet. Polo had already weakened over Mexico, but the moist air associated with it continued toward the Midwest.
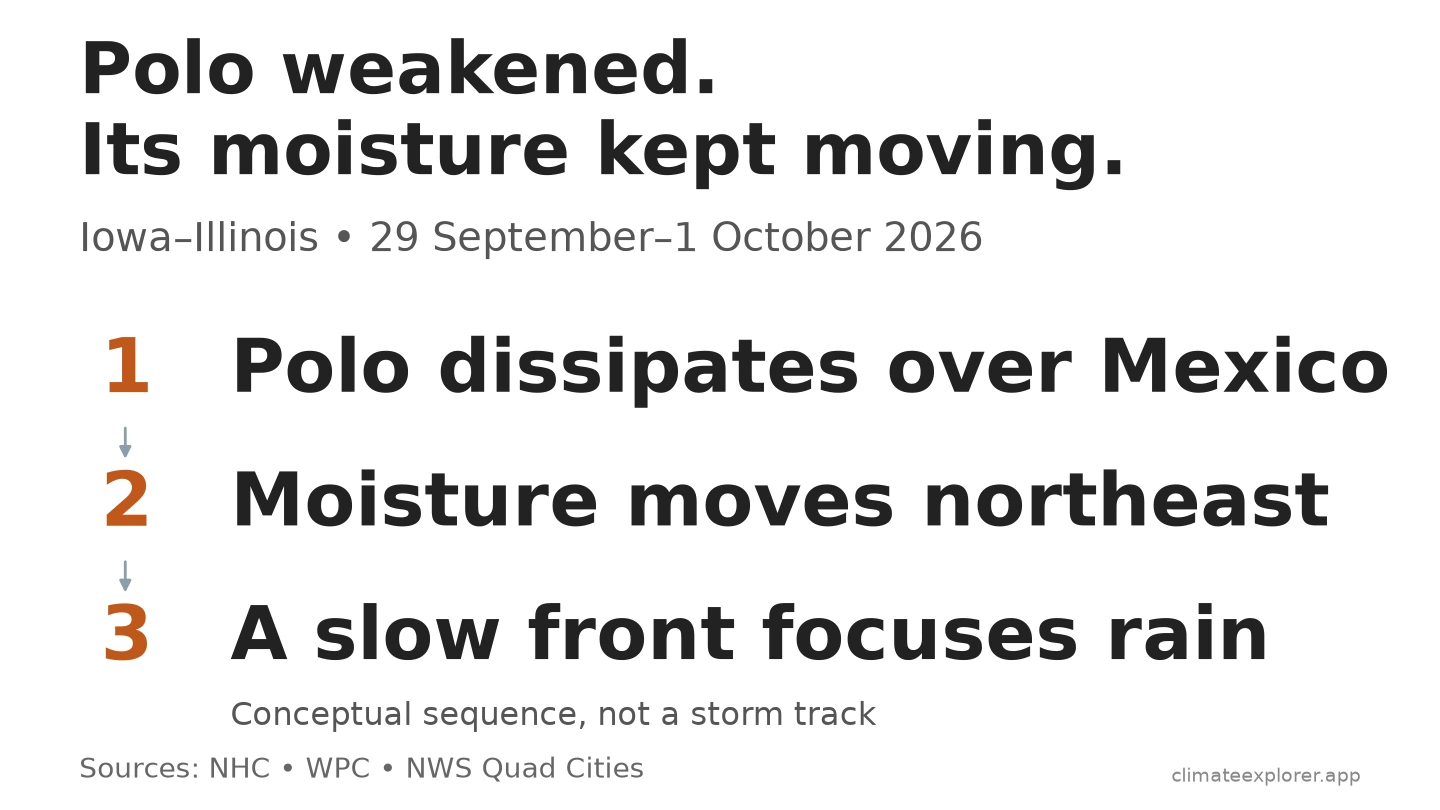
The storm broke up, but moist air kept moving
By the evening of 29 September, central U.S. time, the National Hurricane Center reported that Polo had broken up over the mountains of northwestern Mexico. Satellite images and surface observations supported that assessment.
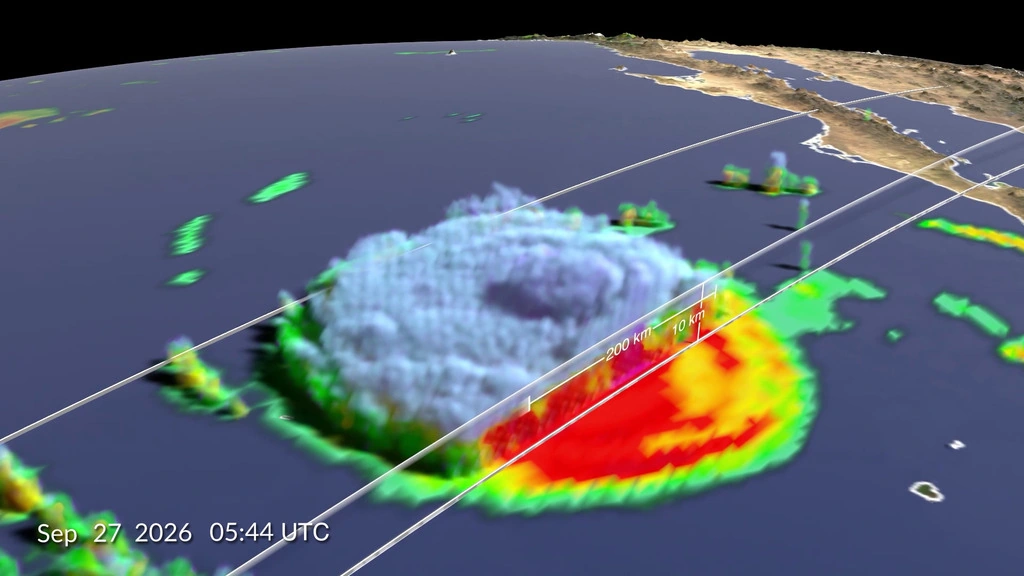
Image credit: NASA’s Scientific Visualization Studio. Data provided by the joint NASA/JAXA GPM mission. Source and full credits.
At midday on 30 September, the Weather Prediction Center described a weather system associated with former Hurricane Polo moving across west-central Kansas. Moist air was moving toward the Midwest. Heavy rain was already falling in parts of Kansas as the system interacted with a front.
The reports show how Polo could still matter after it weakened. They identify it as a source of moisture, but do not measure how much of the later rain came from the hurricane.
A slow-moving front helped the rain persist
As moist air rises and cools, water vapor can turn into tiny droplets that grow into rain. The Weather Service’s explanation describes this link between rising air and rainfall. During this episode, the front helped focus the rain over the area.
On the morning of 1 October, the Weather Prediction Center placed a nearly motionless front through southern and eastern Iowa. Radar showed a broad area of rain over eastern Iowa, Wisconsin and northern Illinois.
In the area with heavier totals, rain fell almost without a break during the morning through midday, with thunderstorms mixed in, according to the local Weather Service review.
Rain flooded roads and basements
The Weather Service reported water over parts of Illinois Route 92 and Duck Creek overflowing, as well as flooded roads and basements. These reports describe local flooding in the affected communities.
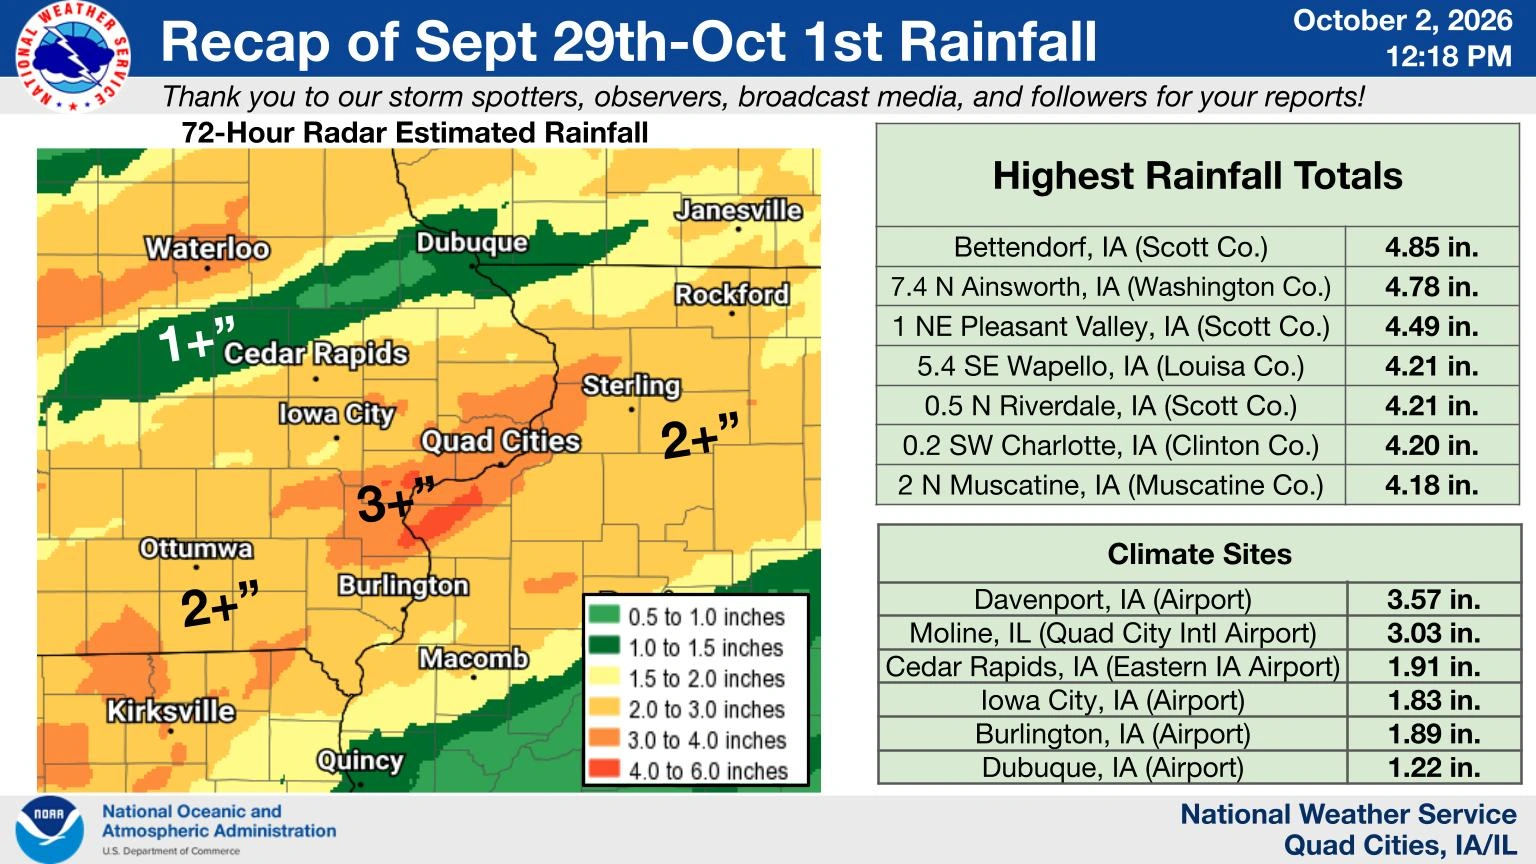
Image credit: NOAA/National Weather Service, Quad Cities. Event summary · View the full-size original.

Airport records help check the rainfall totals
At Moline Quad City airport, Illinois, the original hourly reports add to 3.03 inches (77.0 mm) of measurable precipitation, matching the Weather Service’s reported amount. Very small amounts reported only as a trace, without a numerical amount, are kept separate.
At Cedar Rapids airport, Iowa, the available hourly amounts add to 1.90 inches (48.3 mm). Seven hourly reports are missing, so this remains an incomplete check of the Weather Service’s 1.91-inch (48.5 mm) total. The small difference is unexplained; a missing report does not mean no rain fell.
| Airport | Weather Service report | Our check of hourly reports |
|---|---|---|
| Moline | 3.03 in (77.0 mm) | 3.03 in (77.0 mm); trace reports kept separate |
| Cedar Rapids | 1.91 in (48.5 mm) | 1.90 in (48.3 mm); incomplete |
NOAA’s daily rainfall records for 29 September–1 October also add to 3.03 inches at Moline and 1.91 inches at Cedar Rapids. The daily and hourly archives draw on the same station observations. Details of the reporting times, missing records and rounding are in the optional annex below.
Conclusion
Polo’s role in this episode was to help supply moisture after the storm itself had weakened. The slow-moving front helped focus persistent rain over Iowa and Illinois, where local flooding followed.
Explore the observations and check the sources
Start with the Weather Service’s event summary for the regional rainfall and flood reports. The original airport records and our calculation details are linked in the annex.
Explore daily weather summaries: Open the Moline daily view or Cedar Rapids daily view. Confirm 28 September–3 October 2026, open Dashboard → Data, and read Total Precipitation [mm]. These tested links show the separate daily summaries listed in the annex. They do not show the Weather Service’s totals for the whole event. Climate Explorer provides an independent interface to NOAA’s records.
When checked on 22 October, the hourly Explorer did not load this event at either airport. The original NOAA files linked below contain the reports used here.
Data current as of: 22 October 2026. Archived records may be revised. This article does not claim a historical rainfall record or calculate the effect of climate change on this event.
Data Annex
Optional technical detail: sources, calculations and limits behind the rainfall comparison.
| Source | What it establishes | Time basis |
|---|---|---|
| NWS Quad Cities event review | Local rain episode and documented impacts | 29 September–1 October, local dates |
| NHC final Polo discussion, no. 38 | Cyclone status | 03:00 UTC 30 September = 10 p.m. CDT 29 September |
| WPC discussion 1407 | Plains moisture and frontal environment | Issued 17:03 UTC 30 September |
| WPC storm summary 5 | Front and radar rain area | Analysis at 14:00 UTC 1 October; issued 15:00 UTC |
| NOAA GHCNh and original METAR messages in LCDv2 | Scheduled airport observations and original precipitation precision | UTC report matching; LCD timestamps require local-standard-time conversion |
| NOAA GHCN-Daily | Reported daily precipitation used for a product cross-check | Moline observation time 2400 local standard time; Cedar Rapids variable |
| NOAA SSODv2 | Separate published station precipitation amounts and reporting codes | UTC summary labels; individual contributing intervals not reconstructed |
| Reported geography | Rainfall during the episode |
|---|---|
| Much of the NWS Quad Cities area | 1–3 inches (25–76 mm) |
| Washington–Wapello–Aledo through the Quad Cities corridor | 3–5 inches (76–127 mm) |
| Station | NOAA GHCN identifier | Latitude | Longitude | Elevation |
|---|---|---|---|---|
| Moline Quad City International Airport, Illinois | USW00014923 | 41.4481° N | 90.5236° W | 175.6 m |
| Cedar Rapids airport, Iowa | USW00014990 | 41.8831° N | 91.7247° W | 256.0 m |
Original records and calculation checks
For the hourly comparison, use NOAA’s full-history files for Moline and Cedar Rapids, alongside the original aviation messages in the Moline LCD file and Cedar Rapids LCD file. The reporting-cycle and precision checks are documented below.
The bounded daily CSVs for Moline and Cedar Rapids preserve the amounts and observation-time attributes used for the daily cross-check.
The Weather Prediction Center’s 30 September discussion and 1 October summary describe conditions already being observed. Their forecasts are not used here as measured rainfall. The 1 October summary’s preliminary rainfall table covers an earlier period and is not the source of the regional totals. The local Weather Service report table combines sources and reporting times; we do not use it to rank all stations.
Hourly reconstruction and reporting intervals
The nominal analysis window runs from 29 September 05:52 UTC to 2 October 05:52 UTC, with the starting endpoint excluded and the ending endpoint included when selecting reports. These scheduled cycles correspond to the 29 September–1 October local-standard reporting dates, with nominal boundaries eight minutes before midnight local standard time. The NWS table prints a 72-hour heading and a report time, but does not fully specify each gauge’s start and end; the chosen cycle window is not asserted to be its exact physical interval.
Moline has all 72 scheduled endpoints: 37 with measurable amounts, nine trace reports and 26 original messages without either a precipitation group or a precipitation-unavailable flag. Cedar Rapids has 65 of 72; the seven absent endpoints run from 1 October 23:52 UTC through 2 October 05:52 UTC. A missing report receives no invented rainfall amount. A trace is retained as an unquantified small amount. Blank quality-code fields do not establish an independent quality approval.
The usual scheduled minute at these stations during this event was :52. At Moline on 30 September, the 17:52 UTC report contains 0.16 inch, while later 17:57 and 17:59 reports each contain a new running 0.01 inch. Taking the last row in the clock hour would discard the completed cycle; adding all three would overlap amounts. The ASOS reporting definition and GHCNh documentation, section IX explain the accumulation convention. This event-specific selection is not a universal minute rule for all stations.
Original messages express the amount in hundredths of an inch. Their matching GHCNh cells are rounded to 0.1 mm. At Moline those metric cells add to 77.2 mm (3.04 inches), compared with 76.962 mm from converting the original 3.03-inch sum once. At Cedar Rapids the available metric cells add to 49.0 mm, compared with 48.260 mm from the available 1.90-inch original-message sum. These conversion differences are accounted for by per-report precision; Cedar Rapids’ separate 0.01-inch shortfall against NWS remains unresolved.
Shifting the selected window five hours earlier reduces Moline’s original-message sum to 3.02 inches by excluding a late measurable report. That sensitivity is why matching a rounded number alone cannot validate an arbitrary accumulation window. The daily cross-check retains Moline’s trace flag and Cedar Rapids’ variable observation-time attribute.
Separate SSOD summaries visible in the Explorer
SSOD is NOAA’s Synoptic Summary of the Day, a daily summary made from hourly and other scheduled reports. It is derived from GHCNh, so these archives share source observations. The station identifiers for the linked views are USW00014923 (Moline) and USW00014990 (Cedar Rapids).
| Airport / SSOD date (2026, UTC) | Reported precipitation | Hourly totals included |
|---|---|---|
| Moline / 30 September | 1.28 in (32.4 mm) | 19 |
| Moline / 1 October | 1.17 in (29.6 mm) | 24 |
| Cedar Rapids / 30 September | 0.76 in (19.4 mm) | 20 |
| Cedar Rapids / 1 October | 0.75 in (19.1 mm) | 21 |
These are the published SSOD rows, retained with their hourly-total counts. Counts describe contributing totals, not quality grades or proof of complete coverage. They are not added into an event total. The original Moline SSOD CSV and Cedar Rapids SSOD CSV retain the codes; the Explorer displays the amounts. NOAA warns that SSOD precipitation can be underreported. A blank value is not proof of a dry day.
SSOD groups reports in UTC. During this event, midnight UTC was 7 p.m. CDT on the previous date. A summary label does not establish every contributing report’s exact accumulation interval. Source amounts retain 0.1 mm precision; displayed inches use 25.4 mm per inch, rounded to 0.01 inch. The SSOD guide explains how to inspect these summaries.
Data Sources
- NWS Quad Cities: September–October 2026 heavy rain and flooding summary.
- NHC: final discussion for the remnants of Polo, advisory 38.
- WPC: mesoscale precipitation discussion 1407, 30 September 2026.
- WPC: Southwest into Central U.S. heavy rainfall, storm summary 5.
- NWS Louisville: humidity, precipitation and precipitable water.
- NASA Scientific Visualization Studio: Polo precipitation visualization and image credits.
- NOAA/NCEI SSODv2 product and documentation, including precipitation field and measurement-code definitions.
- NOAA GHCNh station list and NWS Quad Cities station-identity table.
- NOAA GHCNh documentation: hourly precipitation and overlapping reports.
- NWS ASOS User’s Guide: precipitation reporting cycles, trace and unavailable observations.
- NOAA LCDv2 documentation: original message fields, local-standard timestamps and units.
- NOAA GHCN-Daily documentation: precipitation attributes and observation times.
- National Weather Service glossary: fronts and stationary fronts.