What a GHCNm Station Trend Can—and Cannot—Show
At London Heathrow, a straight line fitted through January temperatures from 1961 to 2025 rises by about 1.7°C (3.1°F) across the period. That is the change along the fitted line, not the difference between the first and last January, and not a warming estimate for the whole United Kingdom.
The example uses 65 January monthly means from NOAA’s adjusted GHCN-Monthly temperature product, station UKM00003772. It shows why a trend needs more explanation than an upward-sloping line: the month, years, adjustment product and uncertainty all affect what a reader can conclude.
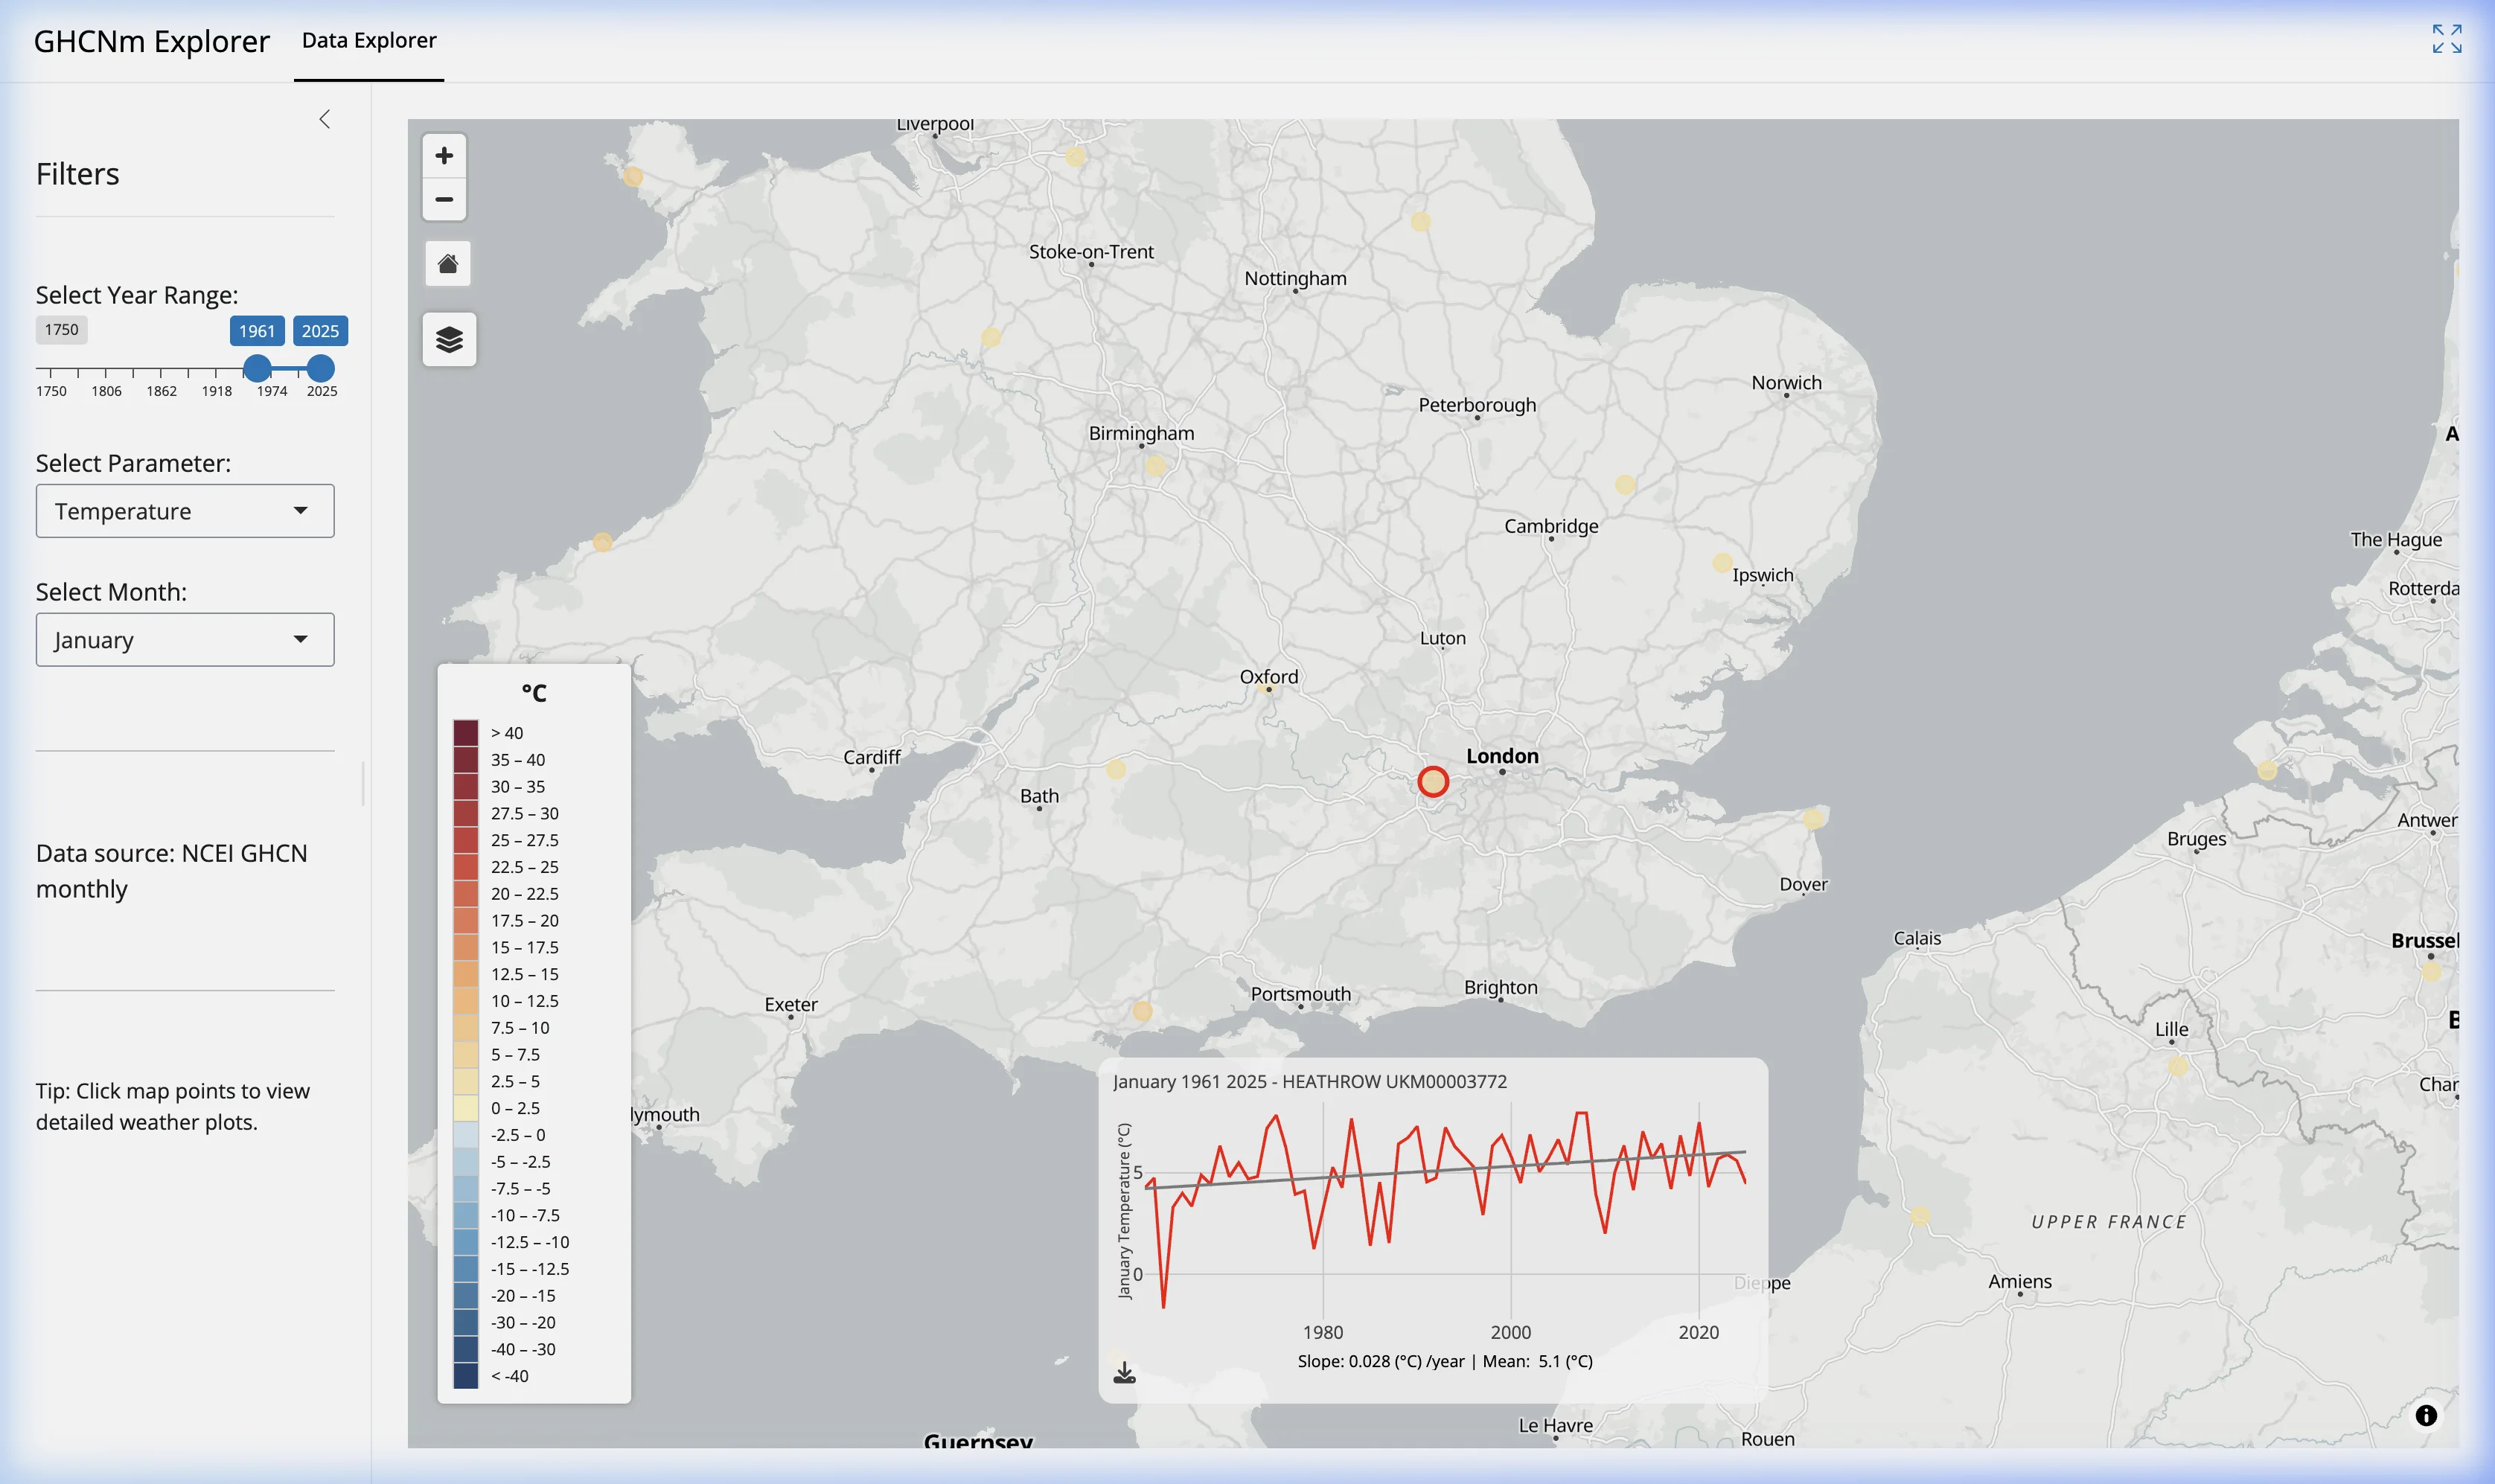
The line summarizes January at one station
The fitted slope is 0.027°C per year, or about 0.27°C (0.49°F) per decade. The mean of the selected January values is 5.2°C (41.4°F). These answer different questions: the mean describes the level of the series, while the slope describes its fitted rate of change.
The calculation is ordinary least squares: it chooses the straight line with the smallest sum of squared vertical differences from the observations. There are 65 annual observations but 64 elapsed years between 1961 and 2025. Multiplying the unrounded slope by those 64 years gives the fitted rise of about 1.7°C.
A line can summarize a noisy series without describing every part of it well. An unusually cold January remains cold even when the long-term fitted line rises. Choosing July, shortening the period or using a different station would pose a different question and require a new calculation.
Adjusted and unadjusted are different temperature products
NOAA publishes both quality-controlled unadjusted temperature (qcu) and quality-controlled adjusted temperature (qcf). “Unadjusted” does not mean that the values have had no quality checks. It means that the homogenization adjustments discussed here have not been applied. The GHCNm readme defines the products, flags and missing-value code.
A station’s record can change when its instruments, location or observing practices change. NOAA’s Pairwise Homogenization Algorithm compares a station’s temperature history with nearby station histories to identify abrupt differences and estimate adjustments. It is a statistical method for making parts of a record more comparable; it does not establish the physical cause of every change. NOAA’s methodology overview
For the same Heathrow selection, the unadjusted slope is 0.033°C per year, compared with 0.027°C per year after adjustment. The contrast is a sensitivity check for this station and period. It does not show that adjustments always reduce warming, or that either product is free from every non-climatic influence.
This article concerns the version 4 monthly mean temperature product. The Explorer also offers precipitation, but the temperature adjustment method and this calculation should not be transferred to that series.
Uncertainty needs more than a trend line
The conventional ordinary-least-squares standard error of the adjusted slope is approximately 0.011°C per year. That describes uncertainty under the fitted model’s assumptions. It does not include every possible source of uncertainty in the station observations, homogenization or spatial coverage.
In particular, year-to-year residuals may be related rather than independent. A formal inference should examine that dependence and the fit, test the effect of the chosen endpoints, and account for the dataset’s own uncertainties. The chart alone supplies neither a complete significance test nor an attribution study.
Heathrow is also one observing location. Establishing a regional change requires additional stations and a method that represents the region; explaining a cause requires evidence beyond this fitted line.
Reproduce the selection and keep the release
Open the GHCNm station explorer, select HEATHROW (UKM00003772), choose Temperature, set 1961–2025, and inspect January. The GHCNm guide explains the controls and CSV checks. The documented Explorer temperature series is adjusted; it has no adjusted-versus-unadjusted selector.
The fixed example was recalculated from a retained copy of NOAA’s 3 June 2026 release. Its former download URL returned 404 when checked on 12 September 2026. To reproduce the fitted lines, download the exact adjusted January series and unadjusted January series extracted for this article, then fit january_tavg_c against year. These small files preserve the provider’s flag columns as well as the values. They are extracts, not the full NOAA archive.
A later provider release or application refresh can change a historical value. Retain the release and the extracted series as well as the station and period.
The useful result is specific: adjusted January temperatures at Heathrow have a rising fitted line over this selection. Keeping the underlying series and method attached to that statement makes it possible to check what the line means.
Data Annex
The calculation uses NOAA’s archived 3 June 2026 release. Both products contain all 65 January values from 1961 through 2025 after excluding the missing code -9999 and values with a nonblank quality flag. No interpolation fills missing years. The displayed temperatures are in Celsius; Fahrenheit equivalents in the narrative distinguish absolute temperatures from temperature changes.
| Metadata field | Value |
|---|---|
| Dataset | NOAA GHCN-Monthly v4 monthly mean temperature (TAVG) |
| Station | Heathrow, United Kingdom |
| Provider identifier | UKM00003772 |
| Archive coordinates | 51.478° N, 0.461° W |
| Archive elevation | 25.3 m |
| Selection | January, 1961–2025; 65 values in each product |
| Release | 3 June 2026 archive; adjusted qcf and unadjusted qcu |
| Statistic | Adjusted (qcf) |
Unadjusted (qcu) |
|---|---|---|
| January mean | 5.2°C | 5.0°C |
| Linear slope | 0.027°C/year | 0.033°C/year |
| Conventional OLS slope standard error | 0.011°C/year | 0.011°C/year |
| Fitted change over 64 elapsed years | 1.7°C | 2.1°C |
Data Sources
- NOAA GHCN Monthly overview: temperature product, quality checks and homogenization method.
- NOAA GHCNm v4 readme: field layout, units, flags,
qcuandqcfdefinitions. - Source release retained for this calculation:
ghcn-m_v4.00.00_temp_s17600102_e20260603_c20260603.tar.gz, dated 3 June 2026. The two downloadable station extracts above were prepared by Climate Explorer from NOAA data; the original download is no longer available at its former URL.