Champi near Taiwan: heavier rain totals, easing island winds
JMA observations through Saturday evening show the rise and fall of local winds, alongside sharply different rain totals at four island stations.
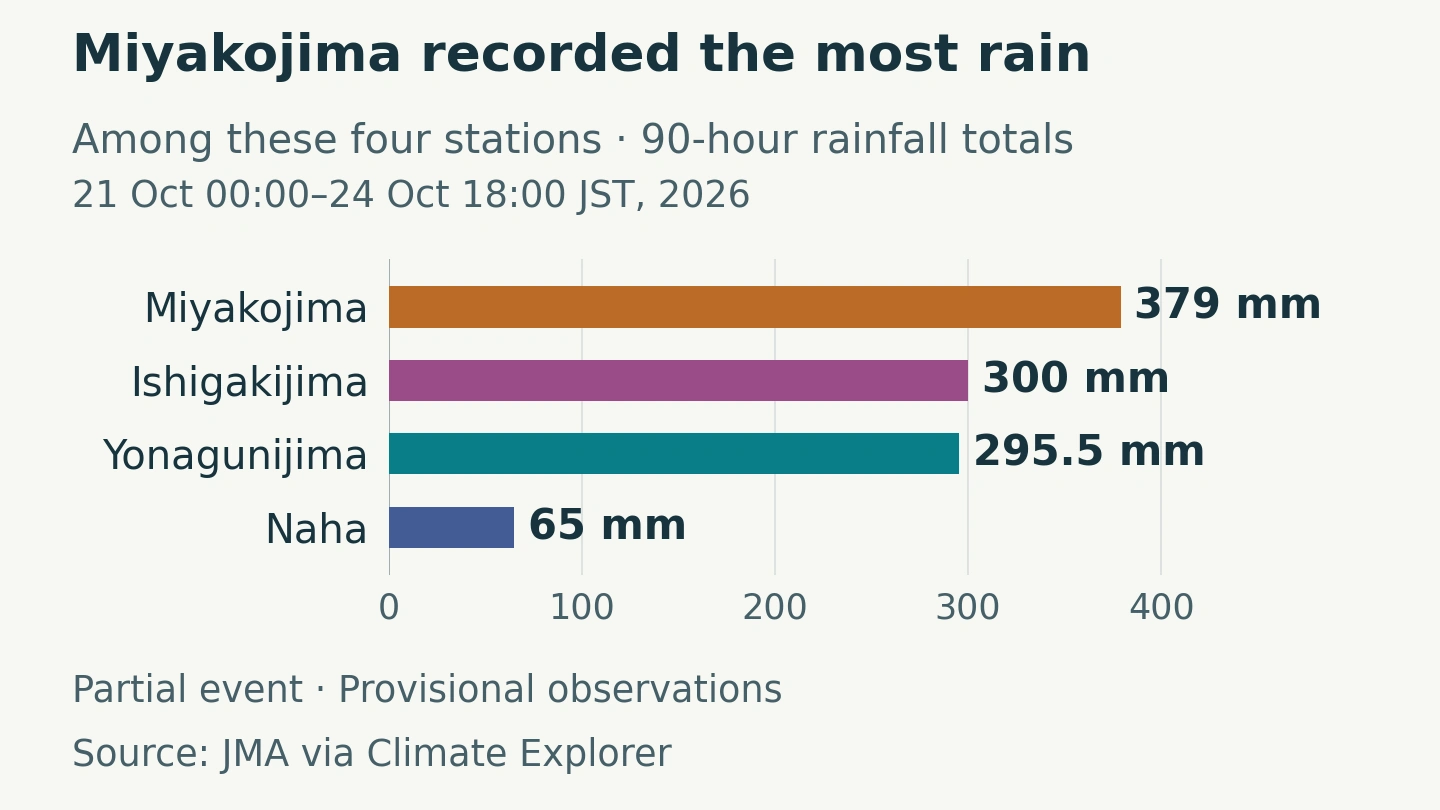
Miyakojima recorded 379 millimetres of rain in the selected 90 hours through 6 p.m. on Saturday, 24 October, Japan time. At Naha, the total was 65 millimetres. Across the four Japanese island stations examined here, winds at Saturday evening’s cutoff were lower than their earlier sampled peaks. These remain provisional observations from a selected event window, rather than final totals for the storm.
The extra observations change the picture available a day earlier. The strongest wind in the selected hourly reports at Ishigakijima came on Friday evening, after the earlier snapshot’s noon cutoff. Yonagunijima also accumulated much more rain during the added 30 hours.
Editor’s note: Data current as of 24 October 2026, 18:00 Japan time (09:00 UTC; 17:00 Taiwan time) for the station observations. The station records, cyclone estimates and forecasts are provisional. The satellite image and rainfall model have earlier, separately stated times. This article is a frozen update, not a live warning service.
The longer record captures stronger winds and their decline
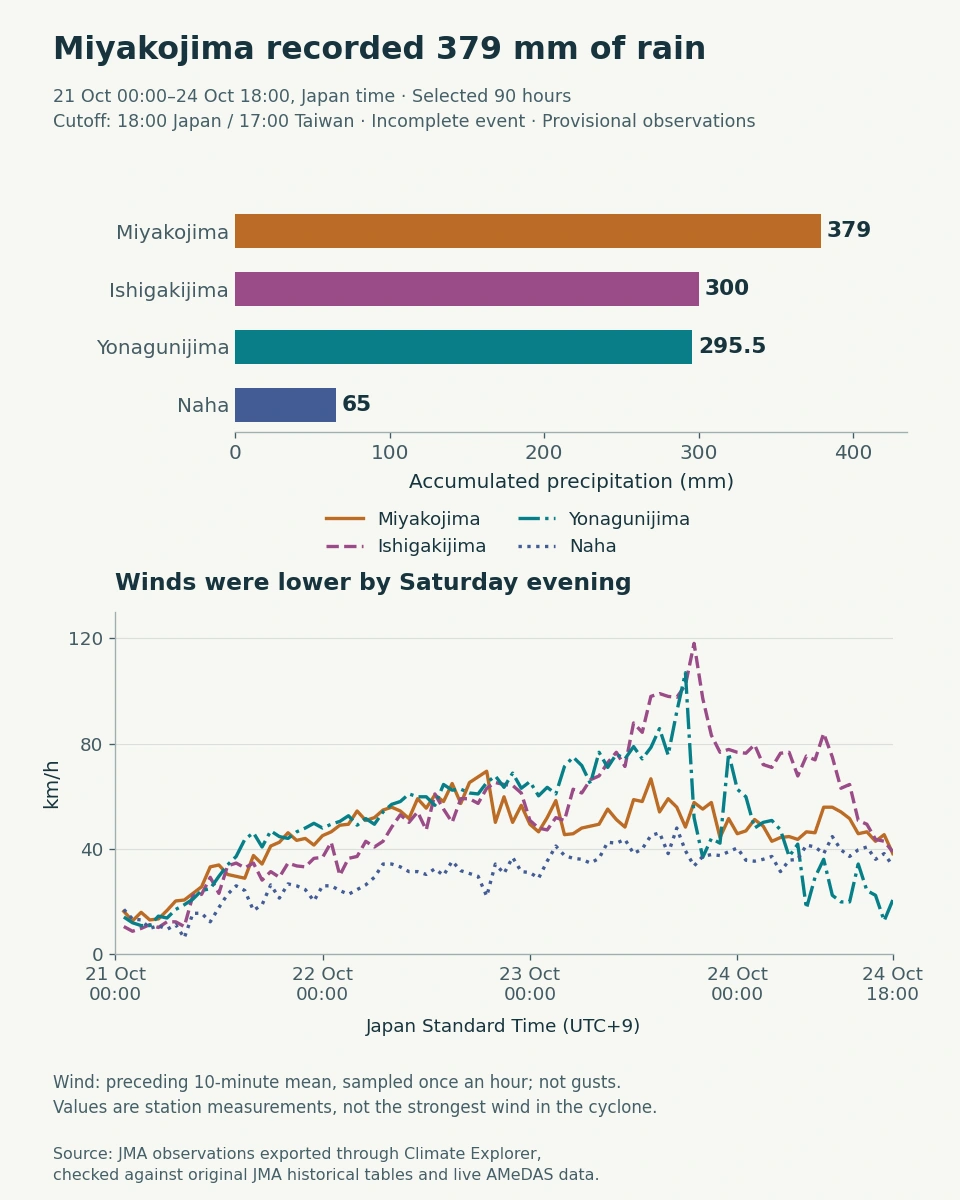
Ishigakijima’s largest sampled wind was 118 km/h, at 7 p.m. Japan time on Friday, 23 October. By the new cutoff on Saturday evening, its reading was 39 km/h. Yonagunijima’s sampled winds were also well below their Friday peak. Lower readings at these stations do not establish that hazardous conditions had ended elsewhere.
The rain comparison has changed too. Yonagunijima’s total rose from 79 mm at the earlier cutoff to 295.5 mm, adding 216.5 mm in 30 hours. Miyakojima remained the wettest of the four selected stations, with 379 mm. These point measurements do not identify the wettest location across an entire island or cyclone.
Explore the observations: Open Miyakojima’s hourly JMA Explorer view, select 21–24 October 2026 and compare the other three stations. Check Precipitation, Wind Speed and Sea-level Pressure in the Data table. This article stops at 18:00 Japan time on 24 October; a later download may contain more rows. The verified CSV preserves the selected observations and their source-quality notes.
The forecast takes a weakening storm toward Japan
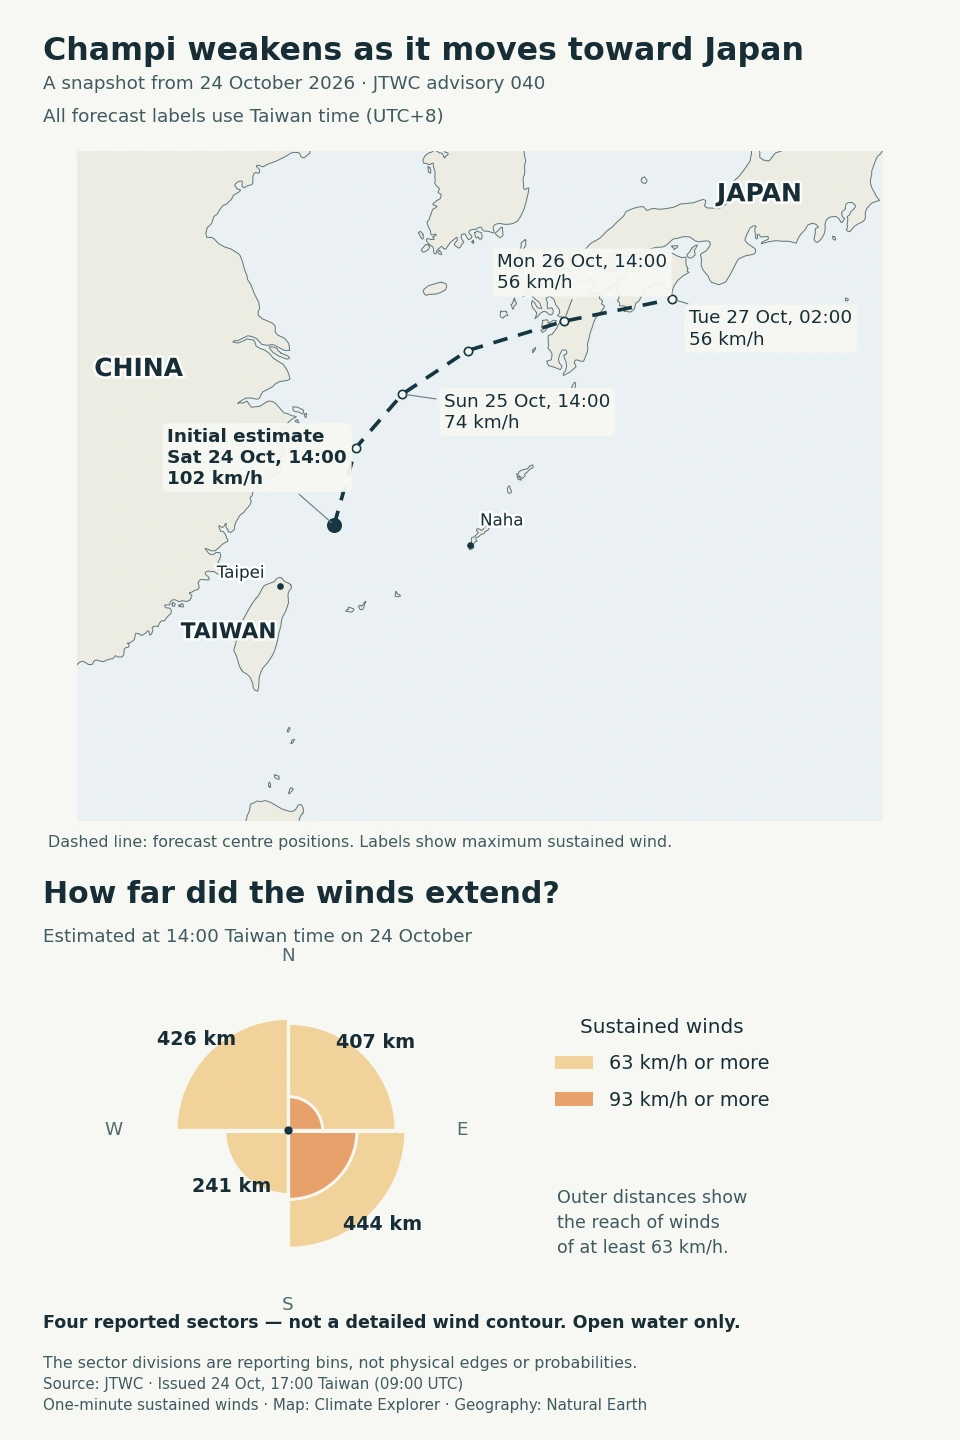
JTWC classified Champi as a tropical storm in this advisory, with maximum sustained winds estimated at 102 km/h at the initial time. It forecast further weakening and a turn northeast toward Japan. That is a cyclone-wide estimate using a one-minute wind average; it differs from the ten-minute readings at individual ground stations.
The compass diagram preserves the way JTWC reports wind extent: one radius for each of four sectors. The sharp divisions are reporting bins, not physical edges in the atmosphere. No current quantitative Champi wind-probability grid was obtained for this update.
A model rain band extends northeast toward Japan
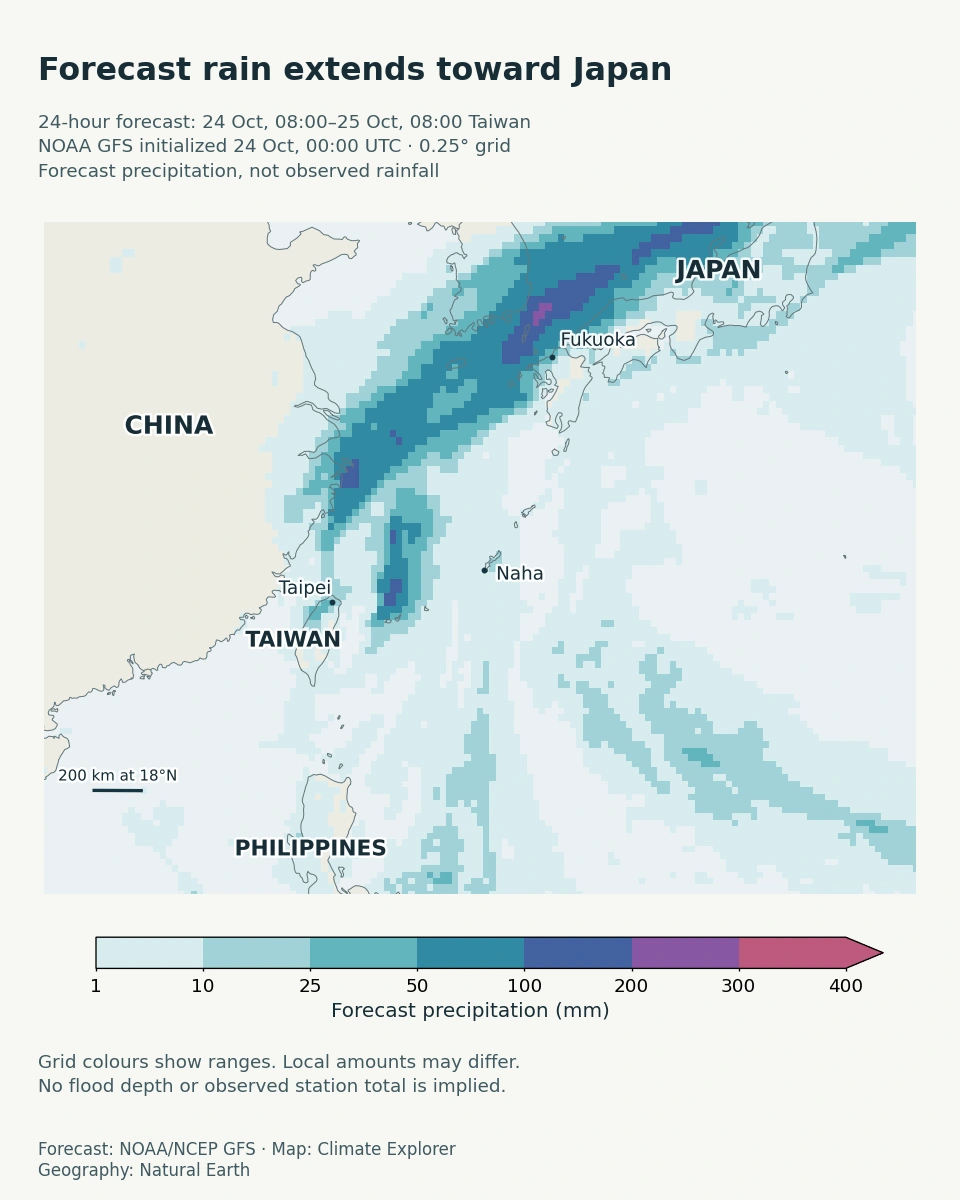
This model run forecasts a band of rain extending northeast toward Japan. Its quarter-degree grid describes a regional pattern; local amounts can differ. The colours are modelled rainfall, not observed totals or flood depths. The forecast window also differs from the 90-hour station window, so the two graphics are not a direct test of forecast accuracy.
The satellite view locates the clouds around the islands
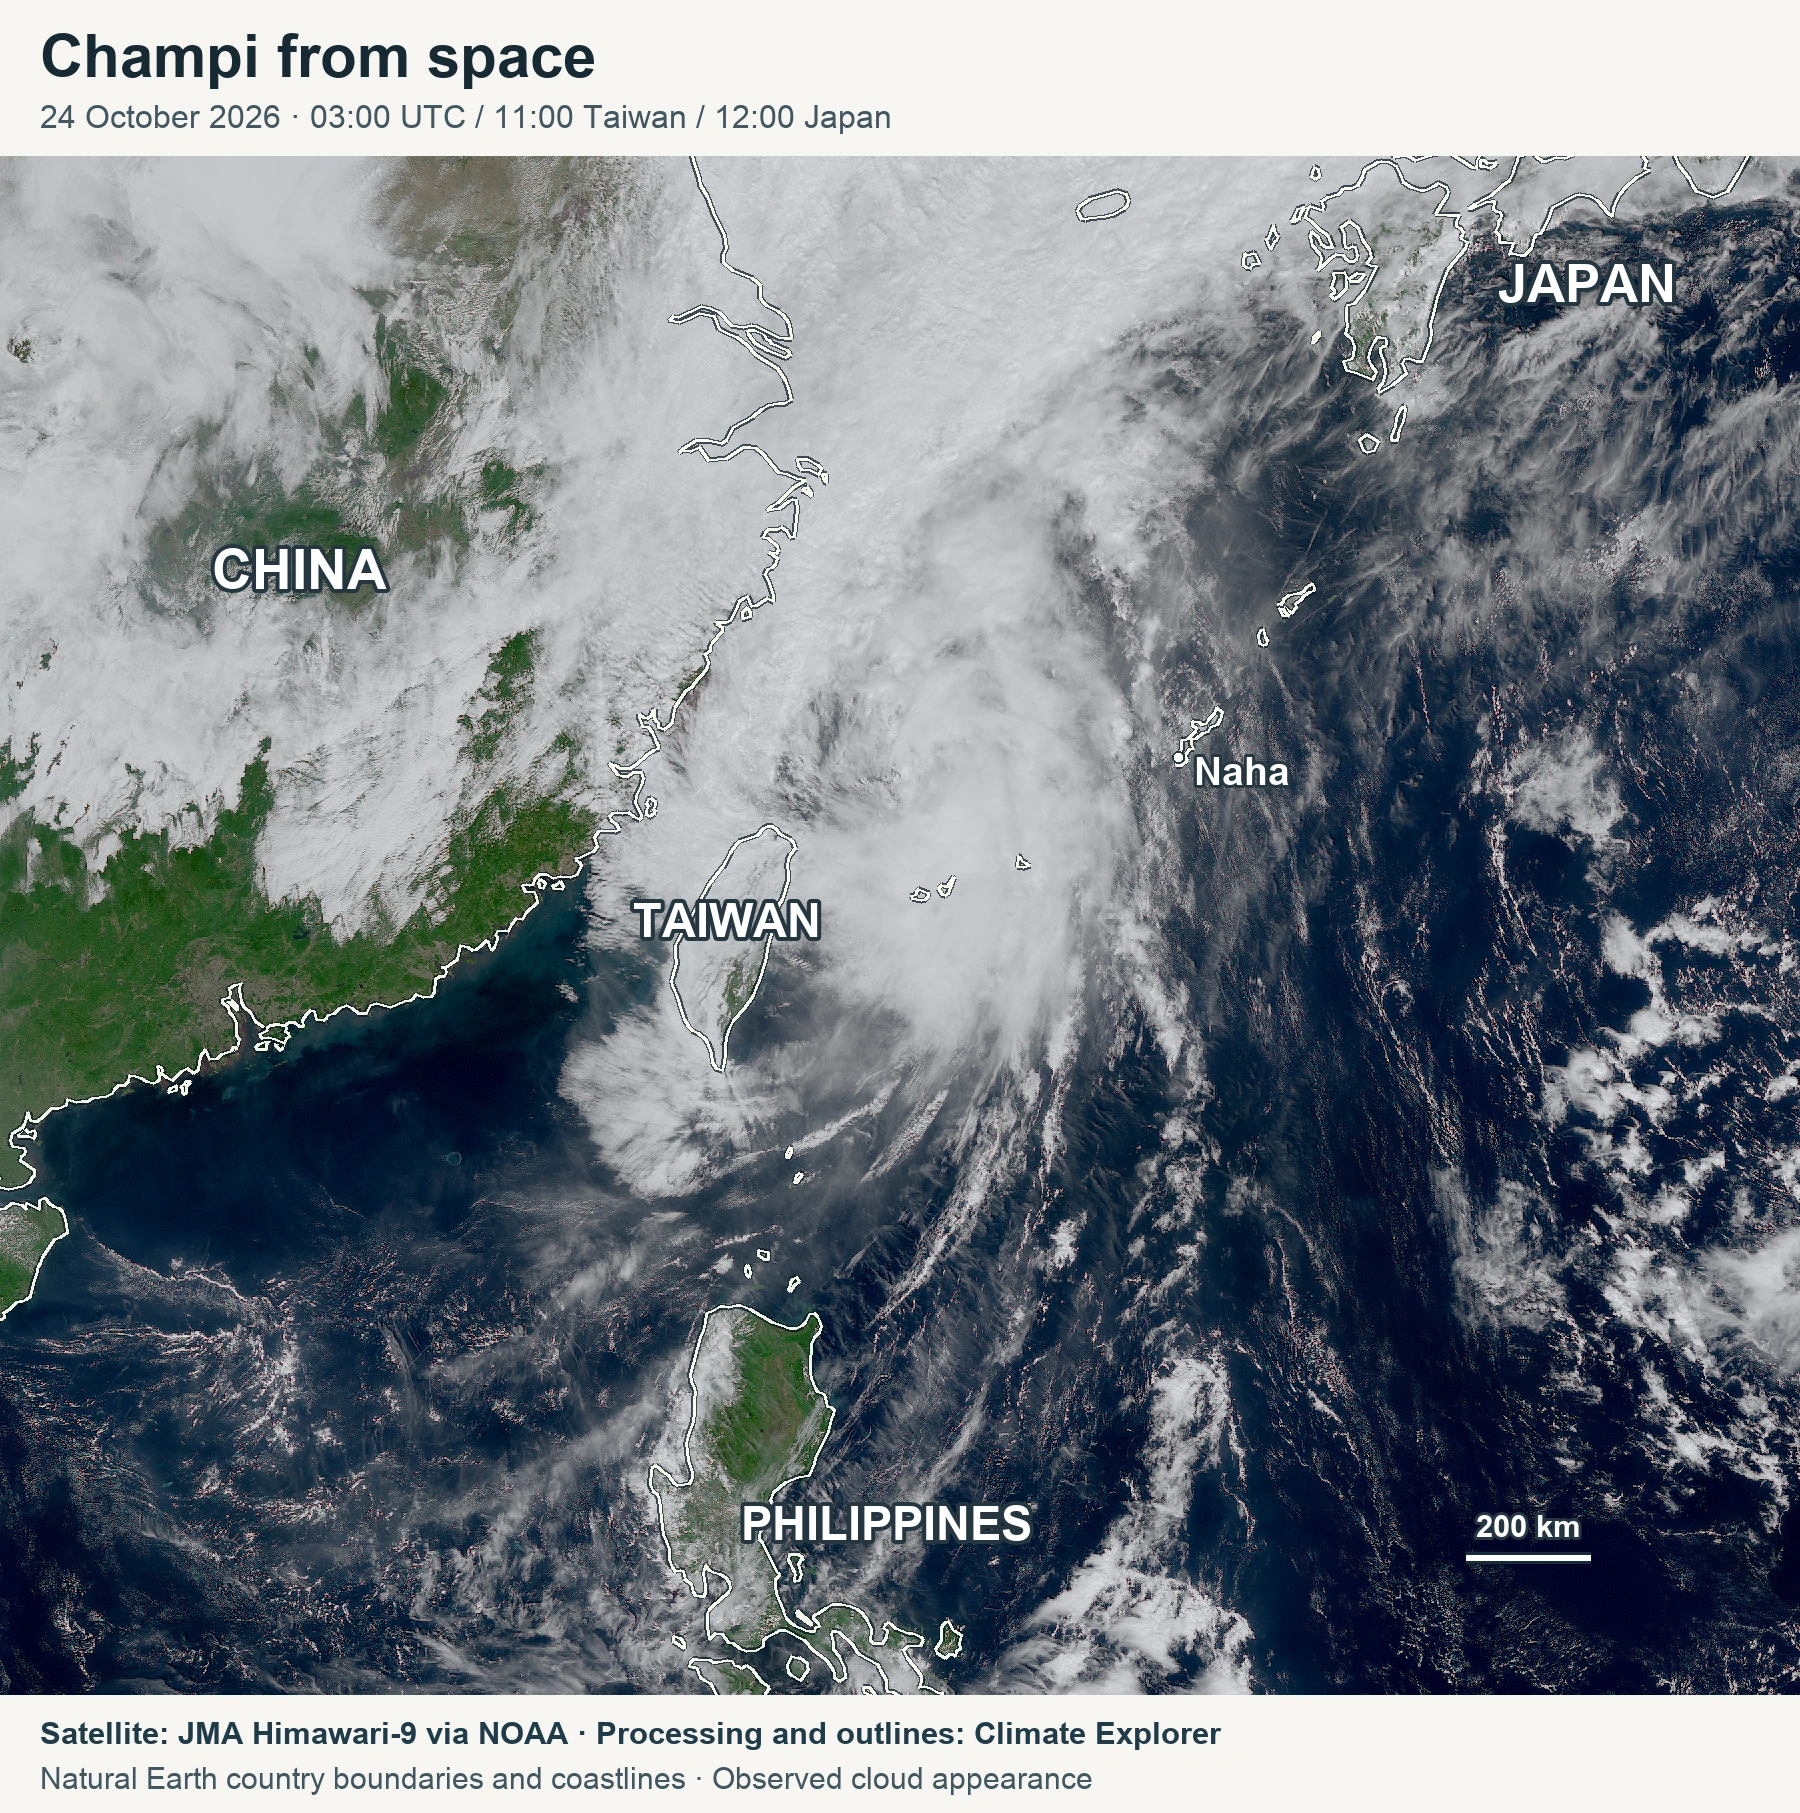
Country outlines locate Taiwan and the surrounding islands beneath and beside the cloud. This independently processed image shows cloud appearance; it does not directly measure surface wind or accumulated rainfall.
Conclusion
The additional 30 hours capture a fuller local sequence: substantially more rain at Yonagunijima, a stronger sampled wind at Ishigakijima, and lower wind readings at all four stations by Saturday evening. Miyakojima still had the greatest measured rain total among these stations over the selected 90 hours. These remain bounded, provisional observations, while the track and rain maps describe forecasts with their own issue times and valid periods.
For official guidance after this snapshot, consult JMA’s typhoon information and Taiwan’s Central Weather Administration.
Update note: This revision extends the station cutoff from noon JST on 23 October to 18:00 JST on 24 October, adds 30 hours per station, and refreshes all three contextual weather graphics. The earlier snapshot is preserved separately.
Data Annex
Station metadata
Native historical JMA and AMeDAS identifiers reproduce the source queries. WIGOS is a globally unique station identifier; mappings were not verified for this analysis, so none is inferred. Coordinates and whole-metre elevations below use JMA’s official station table; the downloadable crosswalk also retains the Explorer registry’s decimal elevations.
| Station | Historical JMA ID / AMeDAS ID | WIGOS ID | Latitude | Longitude | Elevation | Classification |
|---|---|---|---|---|---|---|
| Miyakojima | 47927 / 93041 | Not verified | 24.7933°N | 125.2783°E | 39 m | JMA observatory, s1 table |
| Ishigakijima | 47918 / 94081 | Not verified | 24.3367°N | 124.1633°E | 6 m | JMA observatory, s1 table |
| Yonagunijima | 47912 / 94017 | Not verified | 24.4667°N | 123.0100°E | 30 m | JMA observatory, s1 table |
| Naha | 47936 / 91197 | Not verified | 26.2067°N | 127.6867°E | 28 m | JMA observatory, s1 table |
Station observations
| Station (historical JMA / AMeDAS ID) | Rain over selected 90 hours (mm) | Largest hourly-sampled ten-minute wind (km/h) | Wind at 24 October 18:00 JST (km/h) |
|---|---|---|---|
| Miyakojima (47927 / 93041) | 379.0 | 69 | 38 |
| Ishigakijima (47918 / 94081) | 300.0 | 118 | 39 |
| Yonagunijima (47912 / 94017) | 295.5 | 107 | 21 |
| Naha (47936 / 91197) | 65.0 | 48 | 33 |
The rain window is 21 October 00:00 to 24 October 18:00 Japan time. There are 90 hourly report points per station, from 01:00 on 21 October. Wind is the preceding ten-minute mean sampled at each hour; these are neither gust maxima nor maxima among all ten-minute reports. Values are converted from m/s × 3.6 and rounded only for display. The selection does not establish final storm totals or whole-island extremes.
Pressure check: Sea-level pressure at all four stations was above its earlier hourly-sampled minimum by the cutoff. Yonagunijima’s 948.0 hPa hourly value at 19:00 JST on 23 October was cross-checked against JMA’s ten-minute table, live JSON and surrounding readings. A ten-minute reading of 947.6 hPa at 18:50 was lower, so 948.0 must not be called the full-resolution minimum. These are sea-level-reduced station pressures, not the cyclone’s central pressure.
Processing and quality
The four new actual Explorer Excel workbooks each contained 90 selected rows, giving 360 reports. All numeric pressure and wind values matched the original JMA records. For rain, 294 numeric cells matched; 66 blank export cells were restored to zero only where the official table explicitly marked --, meaning no phenomenon. Unknown missing values were not filled. A quasi-normal station-pressure value at Yonagunijima on 23 October at 20:00 is retained with its flag; it does not enter the rain or wind chart. These delivery paths share JMA observations and are not independent measurement networks.
Historical JMA hourly tables provide 21–23 October; live AMeDAS JSON provides 24 October. Hour 24 was normalized to the following day’s 00:00 to prevent double counting. Across 240 overlapping reports, all 960 numeric rain, wind and pressure comparisons with the previous snapshot were unchanged. Three zero-rain cells acquired different source notation as live reports entered the historical archive.
Station names and coordinates were checked against JMA’s official station table. Native historical and AMeDAS identifiers are linked in the metadata crosswalk; no WIGOS aliases are inferred. Whole-metre official heights and decimal Explorer heights remain separately documented.
| Reproducible file | Contents |
|---|---|
| Verified JMA Explorer observations | 360 selected reports, source URLs, units and quality notes. |
| JTWC advisory 040 data | Initial estimate, forecast positions and reported quadrant radii. Zero western 50-knot radii are retained; absent 64-knot radii remain missing. |
| GFS precipitation data | The exact 0–24-hour accumulation from the 24 October 00:00 UTC run. The overlapping 18–24-hour field was excluded. |
| Satellite provenance | Raw-file URLs and hashes, scientific processing, geographic overlays, times and credits. |
Product limits: The 24 October JTWC forecast ends at 60 hours, not five days. The newly retrieved Champi probability image was still identical to the 21 October product; a newer Guam feed contained a different storm. Neither was used to create current Champi probabilities. The supplied New York Times notes do not identify its exact rainfall model or run, so the independently obtained GFS map is not presented as the same product.
Data Sources
- JMA Explorer and station-data guide, with the exact station/date links preserved alongside the exported workbooks.
- Original JMA hourly table, Yonagunijima on 23 October, JMA AMeDAS and official station metadata. Exact source URLs for every selected report are retained in the CSV.
- JMA definitions for wind averaging, rain intervals and quality symbols.
- JTWC Champi bulletin and forecast reasoning. Public endpoints change; advisory 040 is frozen in this package.
- NOAA NOMADS GFS data, with the original GRIB, decoded intervals and exact query retained.
- JMA Himawari data distributed by NOAA, JMA reuse terms, Natural Earth geography and NOAA/NWS reuse terms.