Santa Ana winds and the Norte Fire: what the weather data show
Strong gusts and dry air appeared together in airport reports. Their locations and timing help explain the weather around Southern California’s October fire episode.
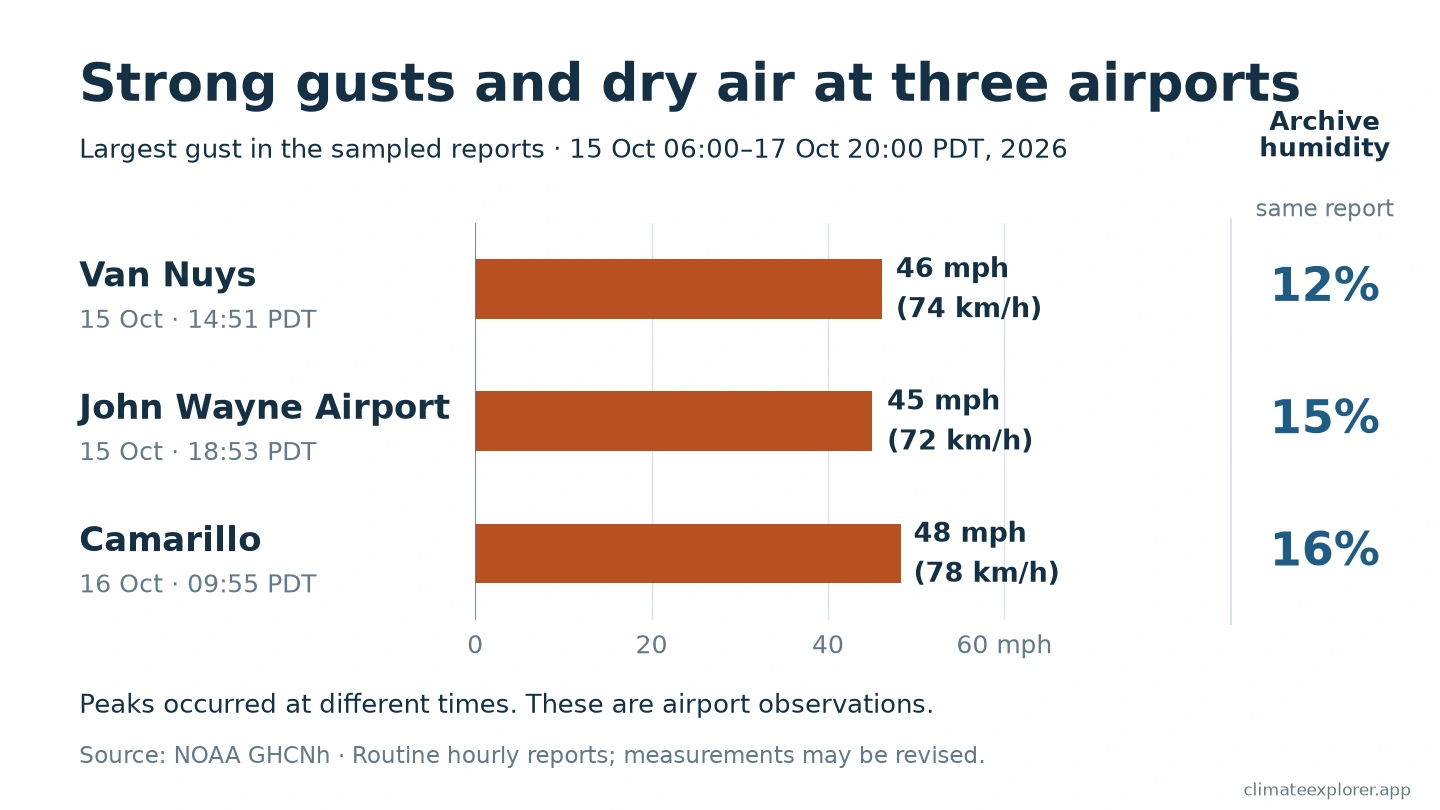
Three Southern California airports reported gusts of about 45–48 mph (72–78 km/h) between the morning of 15 October and the evening of 17 October 2026. Humidity values in the same reports were low, at 12–16%. Strong wind and dry air were present together at these stations.
During this episode, the Norte Fire spread near San Clemente and San Juan Capistrano in Orange County. A later Orange County Fire Authority assessment confirmed seven homes damaged or destroyed. The fire’s cause remained under investigation in the official record checked on 20 October.
The airport reports show part of the weather context. To understand them, we need to keep track of where each station is and when each report was made.
Three airports, three different locations
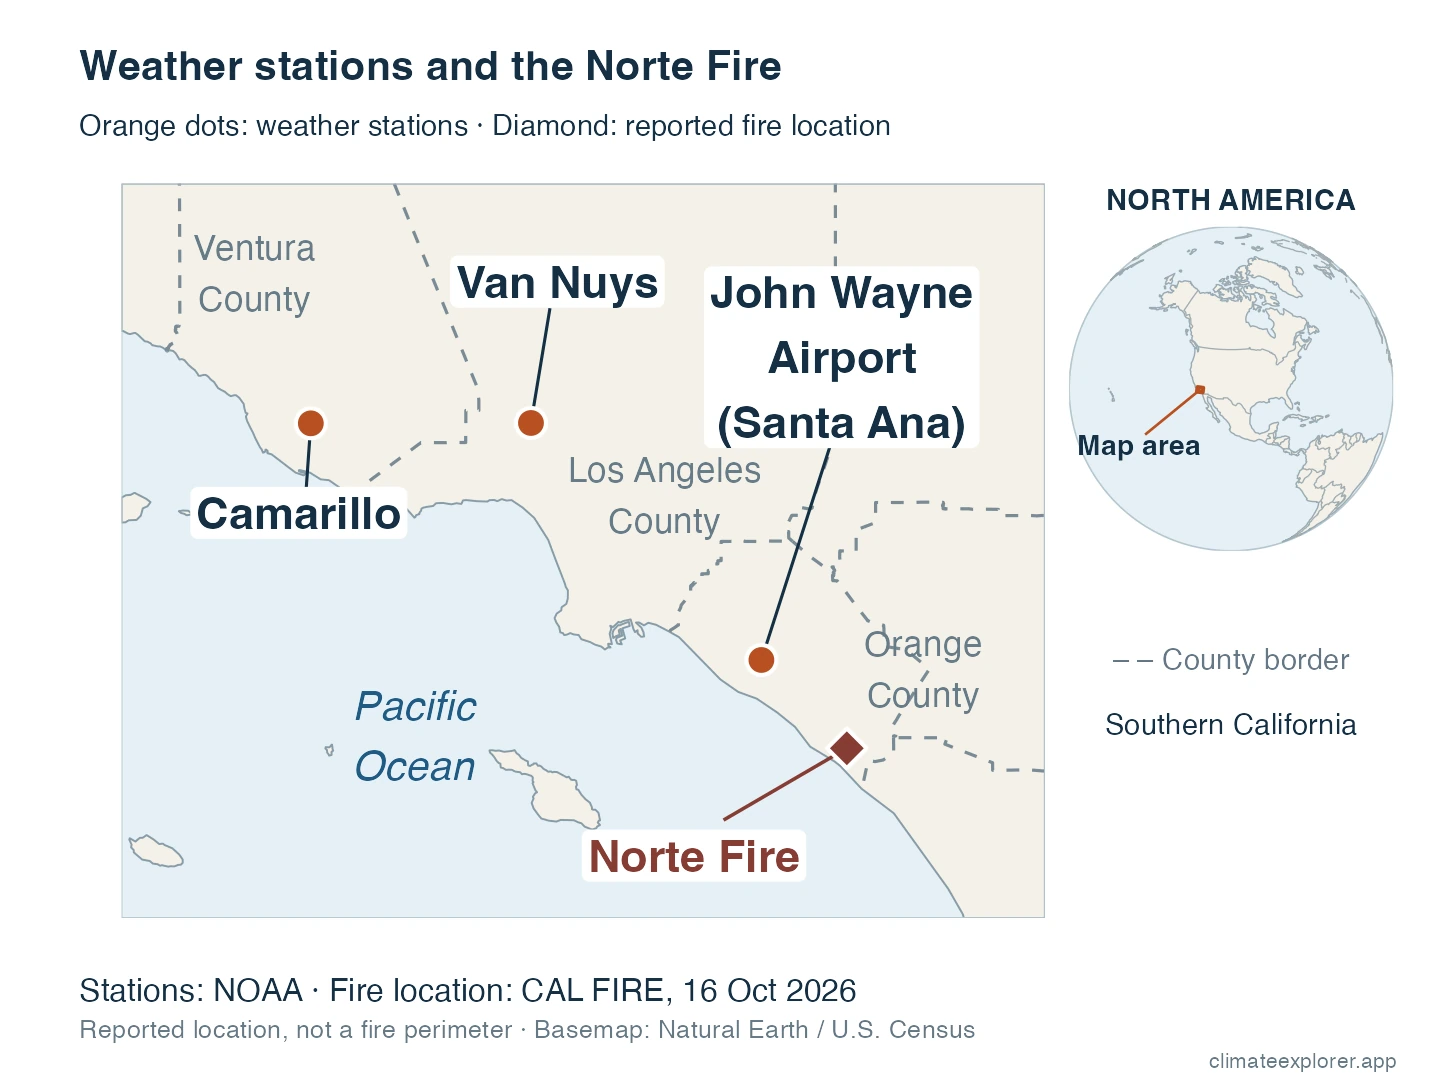
Camarillo Airport is in Ventura County. Van Nuys Airport is in Los Angeles County. John Wayne Airport, at Santa Ana, is in Orange County, the same county as the Norte Fire.
The map shows why the distinction matters. John Wayne Airport is about 19 miles (31 km) from the fire’s published incident location. Its weather reports provide nearby regional context, rather than measurements at the fire itself.
The stations also reached their strongest sampled gusts at different times. Van Nuys reported its largest sampled gust on the afternoon of 15 October. John Wayne’s was that evening. Camarillo’s was the next morning, on 16 October. These values do not describe one simultaneous peak across Southern California.
The strongest sampled reports had winds from the northeast
The reports with the largest sampled gusts showed average winds from the north-northeast at Van Nuys and John Wayne, and from the east-northeast at Camarillo. These directions are consistent with the inland-to-coast flow associated with Santa Ana winds.
Wind direction names tell us where the air comes from. A northeasterly wind comes from the northeast and blows toward the southwest. These airport reports describe local average winds; they do not show the direction of every gust or the Norte Fire’s spread.
Wind and dry air were still present on the fire day
The official incident record lists the Norte Fire’s start at 11:33 a.m. California time on 16 October. At 12:53 p.m., an hourly report from John Wayne Airport contained a gust of 41 mph (67 km/h) and a humidity value of 15%. Its average wind came from the east-northeast. That report was made after the listed fire start.
John Wayne’s largest gust in the hourly reports examined had occurred the previous evening. The timeline below shows that earlier peak and the reports around the fire day.
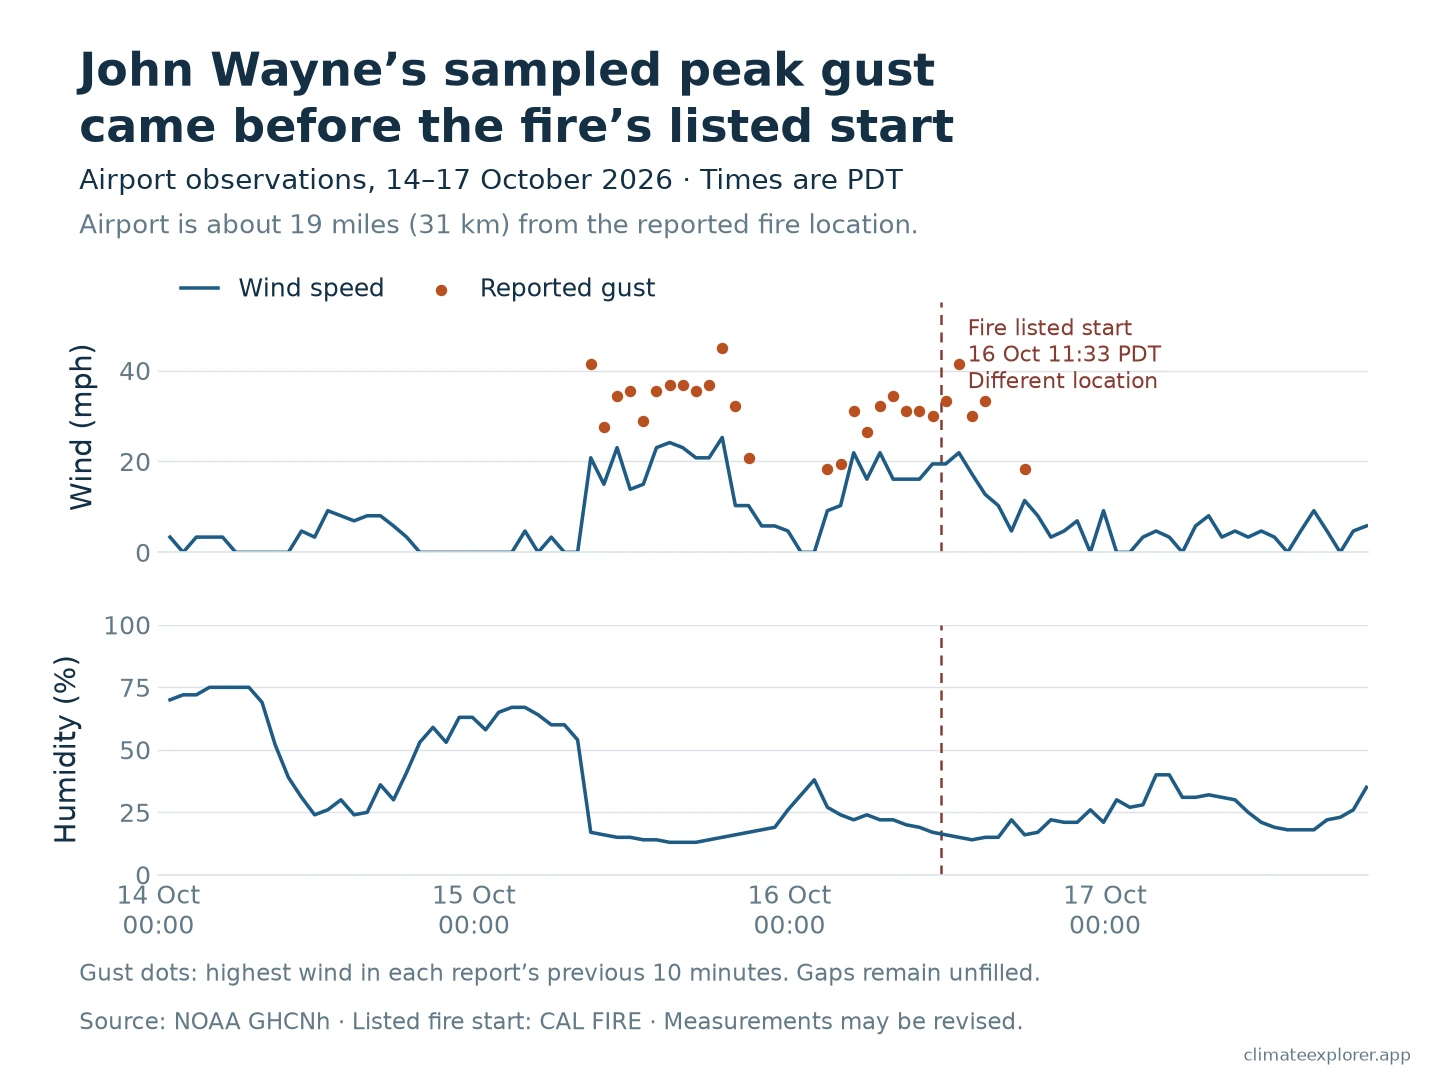
Winds can vary greatly between an airport, a mountain pass and a hillside. The airport reports cannot establish the exact wind or humidity where the fire began.
Why this combination raises fire danger
Santa Ana winds blow from inland areas toward the Southern California coast. In a common pattern, a pressure difference helps drive this flow. Air descending toward the coast is compressed and becomes warmer. Warming can lower its relative humidity, even without removing water vapour.
Relative humidity describes how close air is to saturation at its current temperature. Saturation is the point where water vapour can begin to form liquid drops. A low relative-humidity value means the air is far from that point.
Dry air and strong wind matter because fire also depends on fuel: material such as grass, leaves, shrubs and trees that can burn. Wind can push flames toward vegetation that has not yet burned. It can also carry embers, small burning pieces, ahead of a fire and start new fires downwind.
A humidity reading describes the air, rather than directly measuring the moisture inside vegetation. Weather observations also do not identify what started a particular fire. A fire still needs something to start it.
Before the Norte Fire’s listed start, the National Weather Service in San Diego described elevated to near-critical fire-weather conditions in its forecast area. Its local bulletin included heat and wind alerts. The Red Flag Warnings discussed for parts of Los Angeles and Ventura counties should not be treated as the warning status at the Orange County fire location.
Seven homes damaged or destroyed
An early fire update reported six homes damaged or destroyed. After damage teams surveyed the area, the Orange County Fire Authority updated the combined count to seven in an update posted on 17 October. The verified sources do not give a separate count for damaged homes and destroyed homes.
Evacuation orders were lifted at 6 p.m. on 17 October, although some road and burned-area restrictions continued. The latest incident-page update checked for this article, dated 20 October at 7:05 a.m., listed the fire as 90% contained. These are official response updates, separate from the airport weather measurements.
Conclusion
The airport reports show strong gusts and dry air together during the October wind episode. They also show that the timing differed between places. The Norte Fire brought documented damage to homes, but regional weather reports do not establish its ignition cause or the exact conditions at the fire.
Editor’s note: Observations were downloaded on 20 October 2026. The analysed reports extend to the evening of 17 October California time; the final local day is incomplete. Recent observations and fire-impact figures may be revised. All times in the main story are California daylight time (PDT). Wind-direction context was added on 21 October; the observation and fire-status cutoffs are unchanged.
Check the data
The weather source is NOAA/NCEI’s GHCNh hourly archive. We used routine hourly aviation reports from the three airports, keeping gusts and humidity from the same report. NOAA’s humidity values in these records are derived from temperature and dew point. A reported gust describes a short burst evaluated over the preceding ten minutes; it is not a measurement of every gust during the whole hour. Wind directions are the two-minute averages reported in these aviation messages, measured clockwise from true north. They describe where the wind comes from, rather than the direction of an individual gust. Missing reports were kept as gaps.
The peak comparison covers 15 October at 6 a.m. to 17 October at 8 p.m. PDT. This is our analysis window, not one warning period applying to all three sites. The supporting John Wayne chart begins on 14 October to show the earlier conditions. The values are the largest gusts in the sampled hourly reports, rather than verified peaks for the whole storm or region.
For a direct example, open Camarillo in the GHCNh Explorer and confirm station USW00023136. The report at 16 October 16:55 UTC corresponds to 9:55 a.m. PDT and contains a gust of 21.6 m/s, displayed here as 48 mph (78 km/h). Explorer timestamps use UTC and wind uses metres per second; the article converts both for California readers. Select through 18 October UTC to include the evening of 17 October PDT.
NOAA’s original Camarillo file, Van Nuys file and John Wayne file allow readers to check the reports. The article uses an additional routine-report selection; the Explorer can display other report types.
NOAA’s SSOD daily summaries provide broader daily context. They summarize GHCNh reports, so they are not independent confirmation and cannot show the hour-by-hour overlap used here.
Data Annex
| Airport | NOAA GHCN identifier | ICAO identifier | Latitude | Longitude | Elevation (m) | Site type |
|---|---|---|---|---|---|---|
| Van Nuys | USW00023130 | KVNY | 34.2122 | −118.4914 | 239.3 | Airport |
| John Wayne | USW00093184 | KSNA | 33.6797 | −117.8675 | 13.1 | Airport |
| Camarillo | USW00023136 | KCMA | 34.2114 | −119.0875 | 21.6 | Airport |
The NOAA and ICAO identifiers refer to the same observing site in each row. The map’s separate Norte Fire coordinate is the official incident location, not a surveyed ignition point.
| Airport | Report time, PDT | Largest sampled gust | Humidity at that report | Average wind from |
|---|---|---|---|---|
| Van Nuys | 15 October, 2:51 p.m. | 46 mph (74 km/h) | 12% | North-northeast (30°) |
| John Wayne | 15 October, 6:53 p.m. | 45 mph (72 km/h) | 15% | North-northeast (30°) |
| Camarillo | 16 October, 9:55 a.m. | 48 mph (78 km/h) | 16% | East-northeast (60°) |
These reports occurred at different times. The comparison window ends at 8 p.m. on 17 October; it does not cover that complete local day.
Data Sources
- NOAA/NCEI GHCNh documentation, source-code list, station metadata, and the three original station files linked above.
- NOAA ASOS User’s Guide, for wind-reporting intervals; NWS ASOS wind-direction guidance, for average direction and the true-north convention.
- NWS San Diego weather discussion issued 16 October at 11:09 a.m. PDT and observed-wind summary issued 16 October.
- Orange County Fire Authority and its 17 October damage-assessment update, for seven homes damaged or destroyed.
- Norte Fire incident record, hosted by CAL FIRE for OCFA, for the listed start, location, incident status and investigation status; Orange County Sheriff, for the evacuation history.
- NWS: Santa Ana winds, humidity and wildfire hazards, for the physical explanation.
- Natural Earth and U.S. Census cartographic boundaries, for the location map. The map uses 2025 county boundaries.