Comparing June 2026 Heatwave Peaks to WMO Normals in European Capitals
The extraordinary European heatwave of June 2026 rewrote the record books across the continent. While real-time observations capture the intensity of the moment, understanding the true scale of such an event requires a baseline. By comparing the peak air temperature observations recorded during the event with the 1991–2020 WMO Climatological Normals, we can quantify exactly how far outside the expected climate these extremes fell.
This article uses data from the EuroMeteo Explorer for actual observations and the WMO Normals Explorer for the climatological baseline, focusing specifically on major European capitals.
One methodological caveat is important: the EuroMeteo values used here are hourly or sub-hourly air temperature observations available through the real-time/archive feed. National meteorological services may report official daily maximum temperatures from dedicated maximum-temperature products, higher-frequency automatic station data, or quality-controlled climate records. Small differences of a few tenths of a degree, and occasionally larger differences if the hottest moment occurred between EuroMeteo reporting times, are therefore expected. In this article, EuroMeteo values should be read as observed point-temperature peaks for anomaly comparison, not as definitive official record values.
The Value of the WMO Baseline
As discussed in our guide on The Limits of WMO Normals, a climatological normal provides a 30-year average of weather conditions. For June, the normal maximum temperature represents the expected daytime high based on three decades of data (1991–2020). (Crucially, this is computed as the mean of all the daily maximum temperatures over that 30-year period, not the absolute monthly extremes).
When a persistent “Omega block” settled over Europe in late June 2026, temperatures did not just exceed these normals—they shattered them by margins that are statistically exceptional.
Analyzing the Capitals
By analyzing standardized observations across European capitals, we can track how the heatwave impacted major urban centers as the thermal plume moved from west to east.
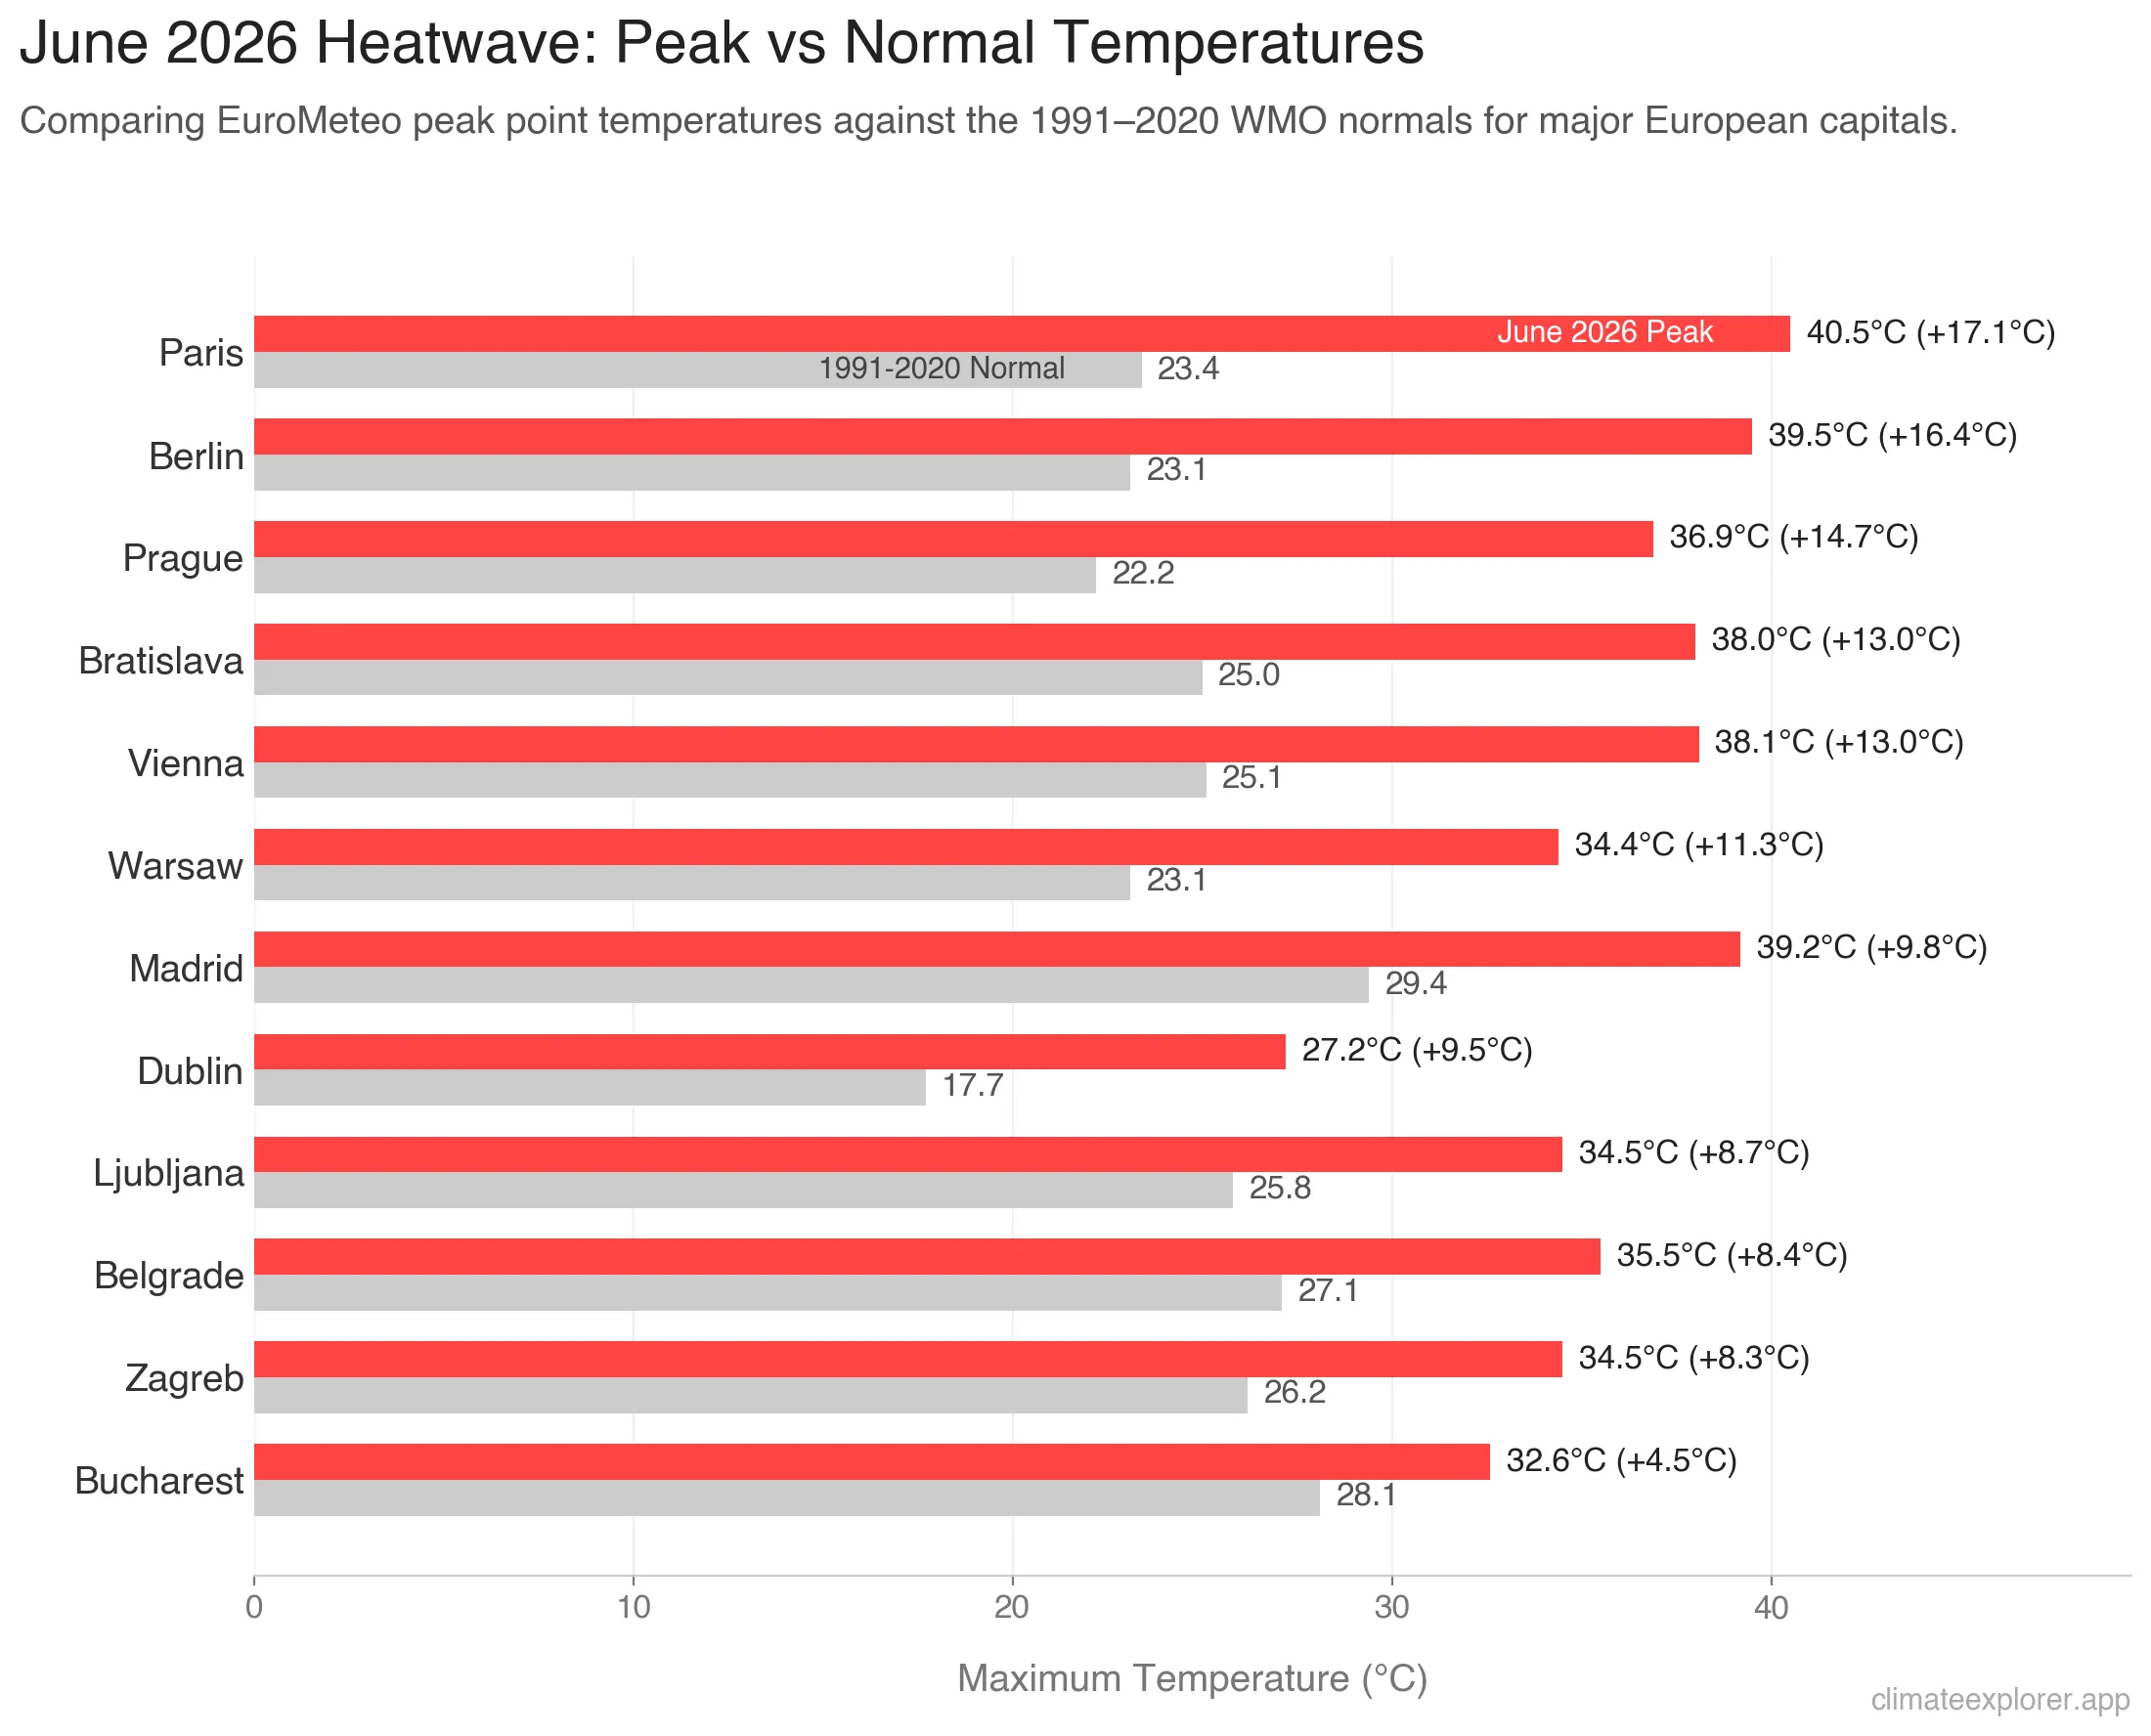
Temperature Anomaly Summary
| City (Station) | June Normal Tmax (1991-2020) | June 2026 Peak Air Temperature (EuroMeteo) | Anomaly |
|---|---|---|---|
| Madrid (Retiro) | 29.4 °C | 39.2 °C | +9.8 °C |
| Berlin (Tempelhof) | 23.1 °C | 39.5 °C | +16.4 °C |
| Dublin (Airport) | 17.7 °C | 27.2 °C | +9.5 °C |
| Warsaw (Okecie) | 23.1 °C | 34.4 °C | +11.3 °C |
| Zagreb (Maksimir) | 26.2 °C | 34.5 °C | +8.3 °C |
| Paris (Montsouris) | 23.4 °C | 40.5 °C | +17.1 °C |
(Note: Normal Tmax represents the average daily maximum expected in June. EuroMeteo peak values are the highest hourly or sub-hourly point air temperature observations available in the feed, so they may differ slightly from official daily Tmax values reported by national services.)
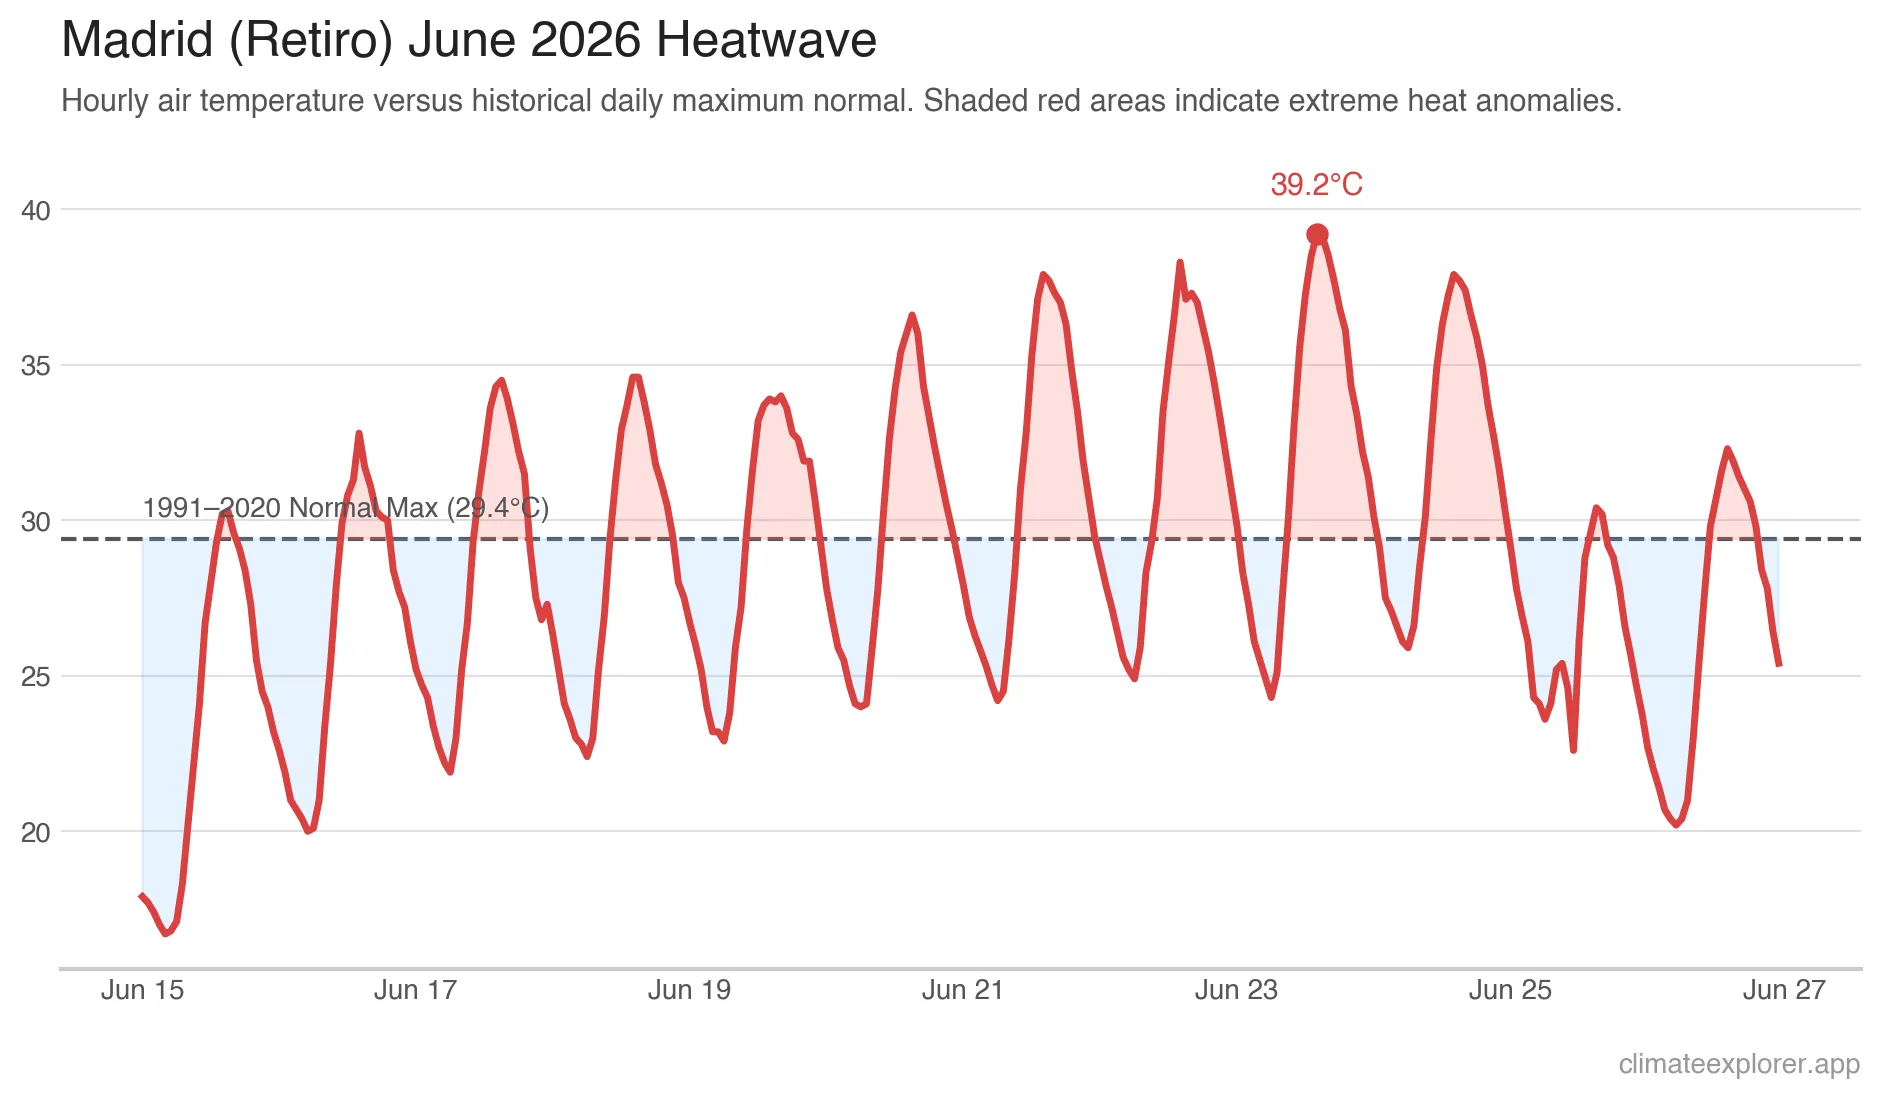
Madrid (Retiro)
Spain was the first to feel the intense heat. The 1991–2020 normal maximum temperature for June in Madrid is typically around 29°C to 30°C. During the peak of the June 2026 event, the EuroMeteo feed recorded afternoon point temperatures approaching 40°C—a staggering anomaly close to +10°C above the baseline. However, despite this extreme heat, the absolute all-time June record for Madrid Retiro (40.7°C, set in 2019) remained unbroken.
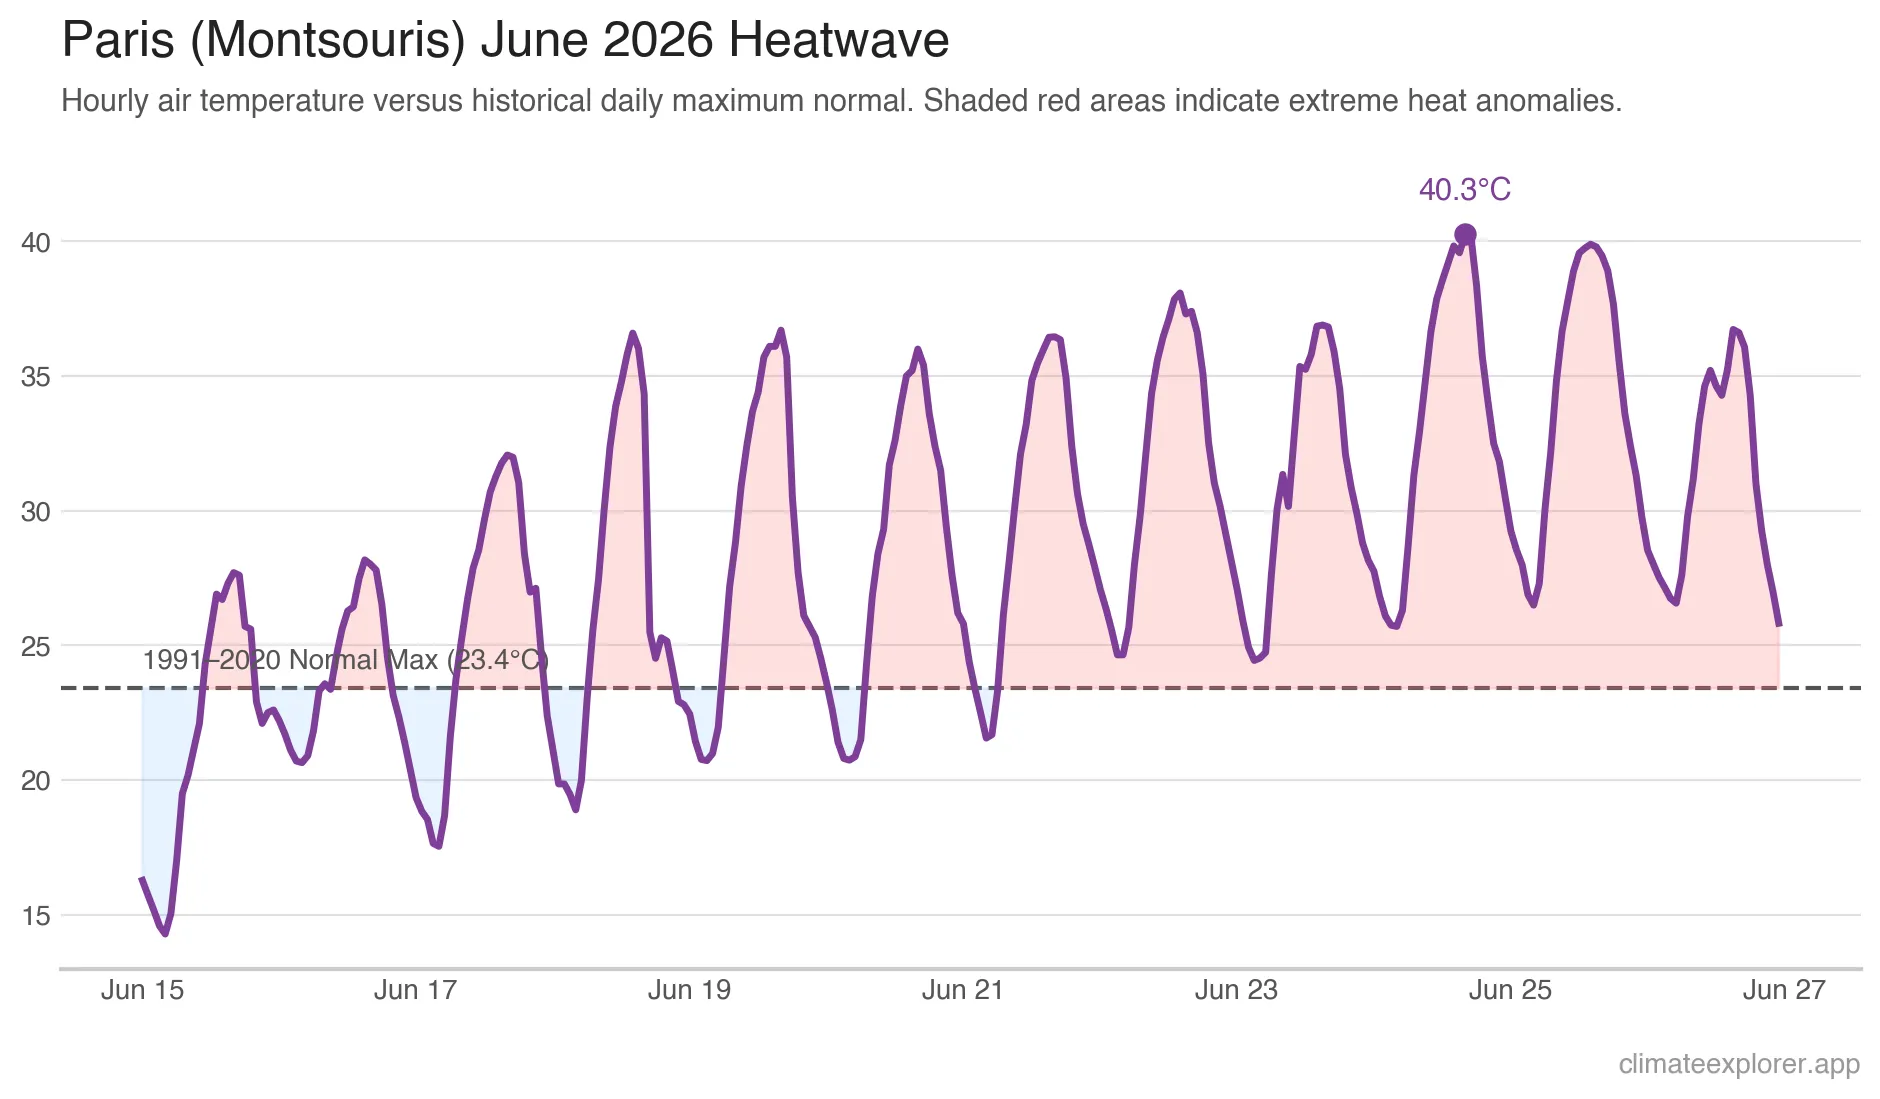
Paris (Montsouris)
As the heat shifted northward, France experienced some of the most extreme anomalies. The WMO normal maximum for Paris Montsouris in June is close to 23°C. On June 24, the EuroMeteo point-temperature series reached a blistering peak more than 17°C above its climatological normal, an anomaly that stresses both human health and urban infrastructure to their breaking points. At 40.5°C, this peak undeniably shattered previous historical June records for the city. Official French maximum-temperature products may quote slightly different values because they are based on the station’s daily Tmax measurement and quality-control workflow rather than the exact EuroMeteo sampling used here.
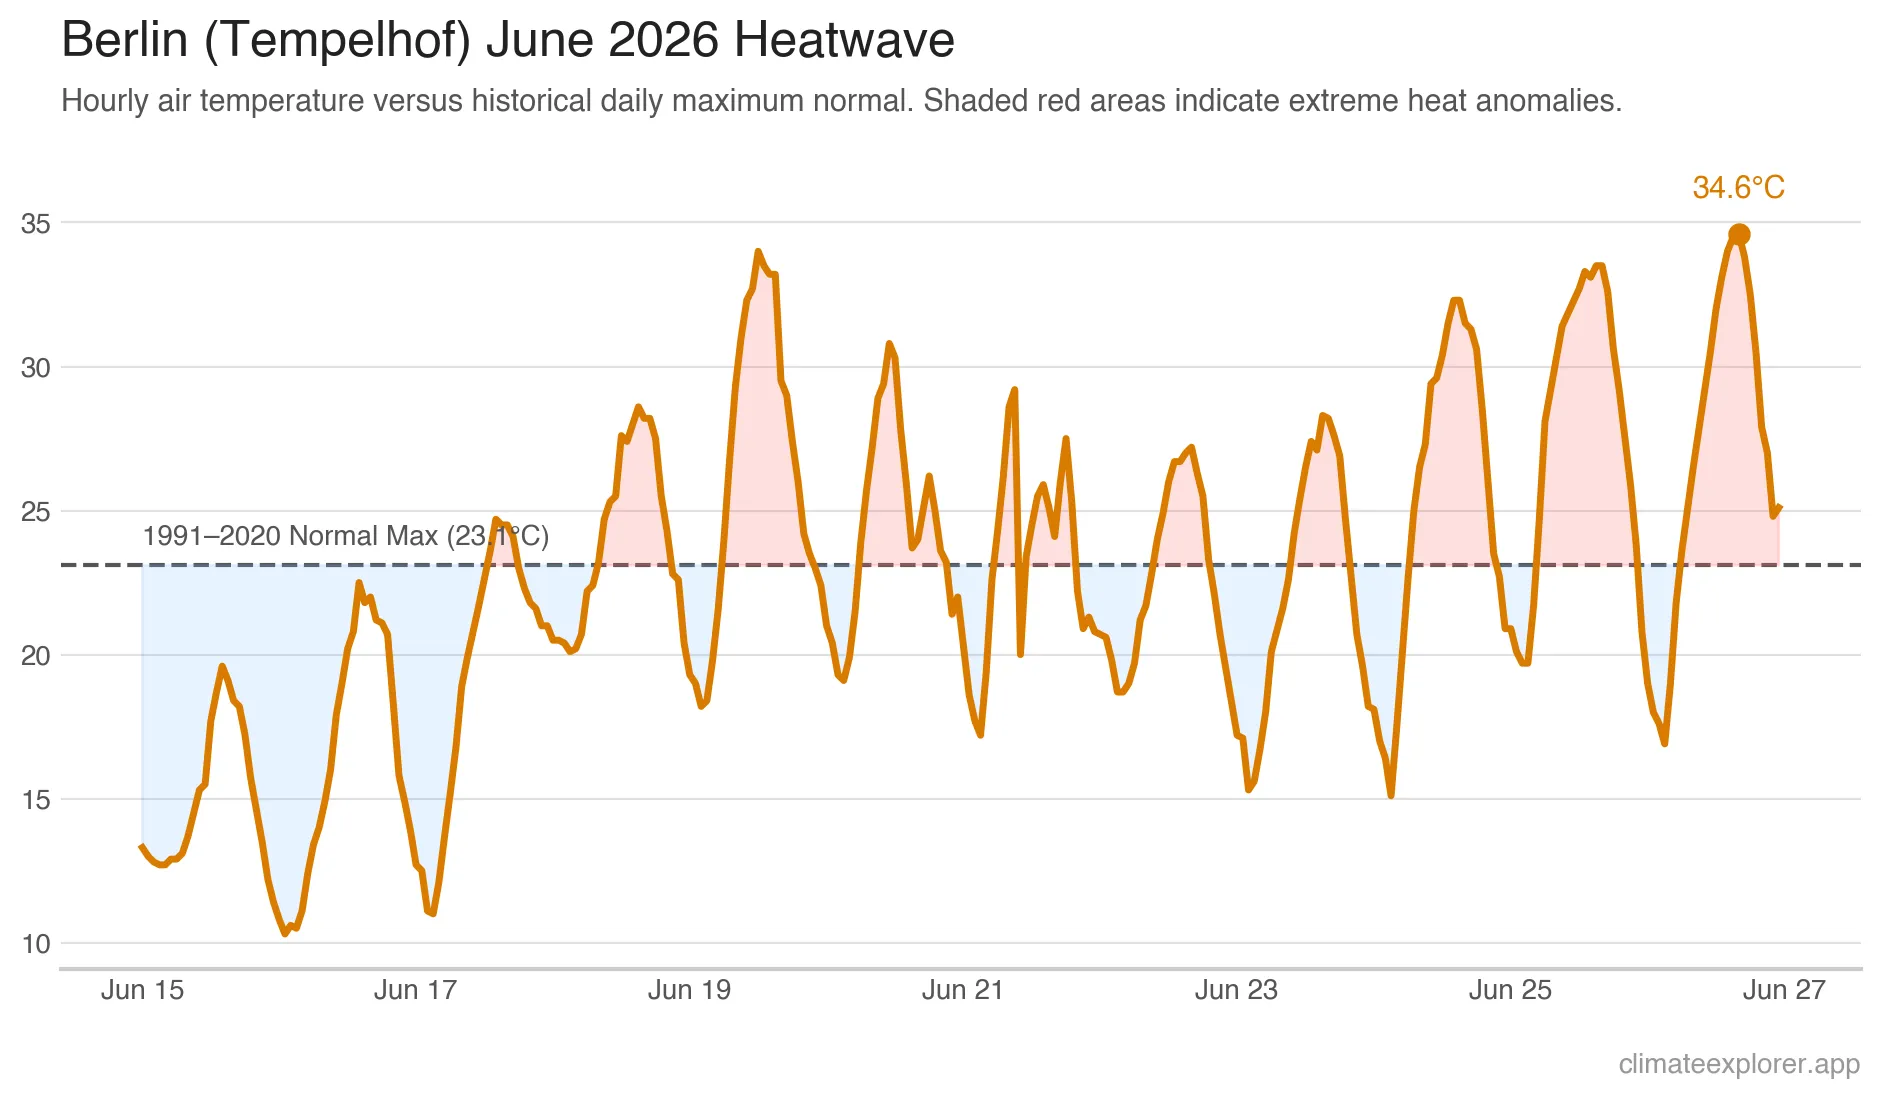
Berlin (Tempelhof)
By June 26-27, the core of the heat had drifted over Germany. The June normal for Berlin Tempelhof is roughly 22°C to 23°C. During the event’s eastern peak, Berlin recorded temperatures in the high 30s, representing an anomaly of well over +15°C and setting new benchmarks for June heat in the German capital. Official DWD reporting may cite a different daily maximum than the EuroMeteo point series, because an official Tmax is not always identical to the highest hourly or sub-hourly value visible in a public observation feed.
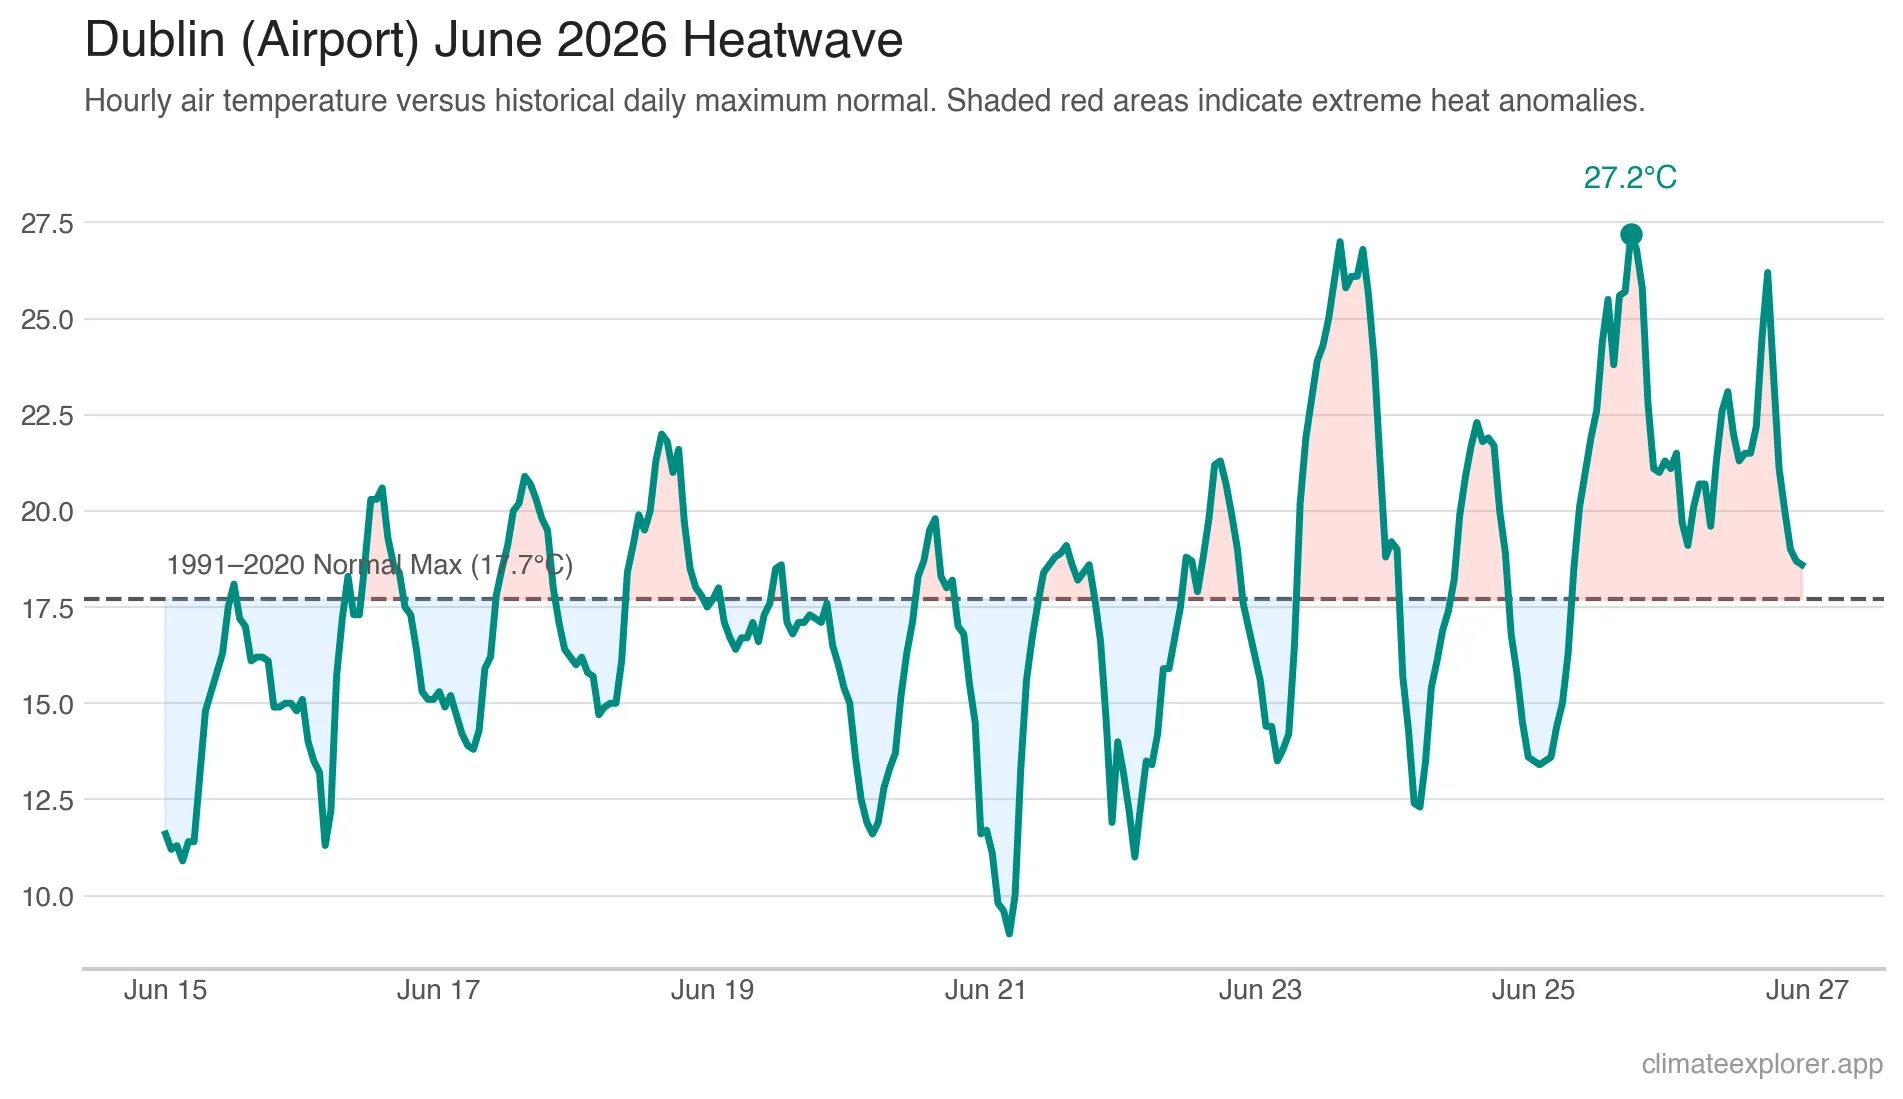
Dublin (Airport)
While the continental core baked, the heat even extended its influence across the Irish Sea. The WMO normal maximum for Dublin Airport in June is a mild 17°C to 18°C. Despite its maritime climate, Dublin saw elevated temperatures driven by the same synoptic setup, highlighting that even peripheral stations experienced notable departures from their long-term normals during the event. While anomalously warm, temperatures peaked well below the station’s all-time absolute June record of 28.9°C, which was established back in 1950.
Warsaw (Okęcie)
As the system weakened and spread further east, Warsaw still felt the impact. The normal June maximum for Warsaw is around 23°C. EuroMeteo observations reached the mid-30s, an anomaly of more than +11°C, demonstrating the immense geographic footprint of the heat dome. While exceptionally hot, Warsaw fell short of its absolute all-time June maximum record of 36.4°C.
The Urban Heat Island Effect
When analyzing European capitals, it is crucial to consider the Urban Heat Island (UHI) effect. Stations like Paris Montsouris and Madrid Retiro are located within dense urban environments.
During the June 2026 heatwave, the UHI effect exacerbated the already extreme temperatures, particularly at night. While the WMO normals for minimum temperatures in these cities are generally in the mid-teens (13°C to 15°C for June), the EuroMeteo data revealed consecutive tropical nights where temperatures never dropped below 20°C, and in some cases stayed above 25°C. The baseline normals remind us that such relentless nighttime heat is fundamentally outside the historical experience of these cities.
Combining Datasets for Better Insights
This analysis demonstrates the power of combining real-time observational data with standardized historical baselines:
- Contextualizing the Extreme: The EuroMeteo Explorer shows you how hot it is right now. The WMO Normals Explorer tells you how unusual that heat is.
- Cross-Border Consistency: By utilizing a standardized network of capital city stations, we can compare the anomaly in Paris with the anomaly in Warsaw using a common observation feed, while still recognizing that official national Tmax products may follow different measurement and quality-control conventions.
- Tracking the Anomaly: Viewing the anomaly (Actual Max Temp minus Normal Max Temp) rather than just the absolute temperature often provides a clearer picture of the meteorological event’s progression across the continent.
Conclusion
The June 2026 heatwave was a continental-scale event that produced EuroMeteo point-temperature peaks more than 10°C above the 1991–2020 WMO climatological normals in several European capitals, with the largest anomalies above +16°C. While the heat dome was expansive, its influence did wane significantly in the continent’s far east and southeast; for instance, Bucharest experienced a much smaller, though still notable, anomaly of +4.5°C. By leveraging the combined datasets available in Climate Explorer, researchers and the public can quantify these extremes in real-time, providing vital context for an increasingly volatile climate.
Broader European Capitals Summary
Below is a broader station summary from the Climate Explorer capital-station subset for which both EuroMeteo observations and 1991–2020 WMO normals are available.
| City (Station) | Country | June Normal Tmax (°C) | June 2026 Peak Air Temperature (°C) | Anomaly (°C) |
|---|---|---|---|---|
| Paris (Montsouris) | France | 23.4 | 40.5 | +17.1 |
| Berlin (Tempelhof) | Germany | 23.1 | 39.5 | +16.4 |
| Berlin (Brandenburg) | Germany | 22.9 | 39.2 | +16.3 |
| Berlin (Dahlem) | Germany | 22.8 | 38.3 | +15.5 |
| Prague (Ruzyně) | Czechia | 22.2 | 36.9 | +14.7 |
| Prague (Kbely) | Czechia | 22.5 | 36.5 | +14.0 |
| Prague (Libuš) | Czechia | 23.5 | 37.3 | +13.8 |
| Vienna (Hohe Warte) | Austria | 25.1 | 38.1 | +13.0 |
| Bratislava (Koliba) | Slovakia | 25.0 | 38.0 | +13.0 |
| Bratislava (Letisko) | Slovakia | 25.6 | 37.0 | +11.4 |
| Warsaw (Okęcie) | Poland | 23.1 | 34.4 | +11.3 |
| Madrid (Retiro) | Spain | 29.4 | 39.2 | +9.8 |
| Dublin (Airport) | Ireland | 17.7 | 27.2 | +9.5 |
| Ljubljana (Bežigrad) | Slovenia | 25.8 | 34.5 | +8.7 |
| Belgrade | Serbia | 27.1 | 35.5 | +8.4 |
| Zagreb (Maksimir) | Croatia | 26.2 | 34.5 | +8.3 |
| Bucharest (Băneasa) | Romania | 28.1 | 32.6 | +4.5 |
Frequently Asked Questions (FAQ)
Why compare EuroMeteo data to WMO Normals?
Comparing real-time observations from EuroMeteo to WMO Normals provides essential context. It allows us to calculate the temperature anomaly—exactly how many degrees above or below the historical 30-year average (1991-2020) a specific weather event is.
Why can EuroMeteo peak values differ from official maximum temperatures?
EuroMeteo usually exposes hourly or sub-hourly point air temperature observations. Official maximum temperatures reported by national meteorological services can come from dedicated daily Tmax products, higher-frequency automatic station records, or post-event quality control. Because the hottest moment may occur between public reporting times, EuroMeteo peaks and official Tmax values can differ by a few tenths of a degree, and sometimes more.
Which European capital had the largest temperature anomaly in June 2026?
Based on the comparison between EuroMeteo peak temperatures and WMO June normals, Paris experienced one of the most extreme anomalies, with point air temperatures reaching more than 17°C above its climatological baseline for June.
Are the WMO normals updated to include recent heatwaves?
The current standard WMO climatological normals cover the period from 1991 to 2020. They do not include data from the years following 2020. This is why comparing current extreme events to the normals often yields such stark anomalies; the baseline is fixed, but the climate continues to warm.
How does the Urban Heat Island effect impact these readings?
Stations located in capitals, such as Paris Montsouris or Madrid Retiro, are influenced by their urban surroundings. Concrete and asphalt absorb and retain heat, making the city hotter than surrounding rural areas, especially at night. This effect compounds the severity of a heatwave, pushing minimum temperatures well above their historical normals.