GHCNm User Guide
Access the Application: Return to Explorer
1. Introduction
The GHCNm Explorer is an interactive dashboard for exploring Global Historical Climatology Network monthly (GHCNm) data. It allows you to visualize long-term, homogenized weather records from thousands of stations worldwide, focusing on monthly temperature averages and precipitation totals. This tool is ideal for analyzing multi-decadal climate trends.
3. Data Explorer (Map View)
The primary interface is the Data Explorer, an interactive map showing available weather stations.
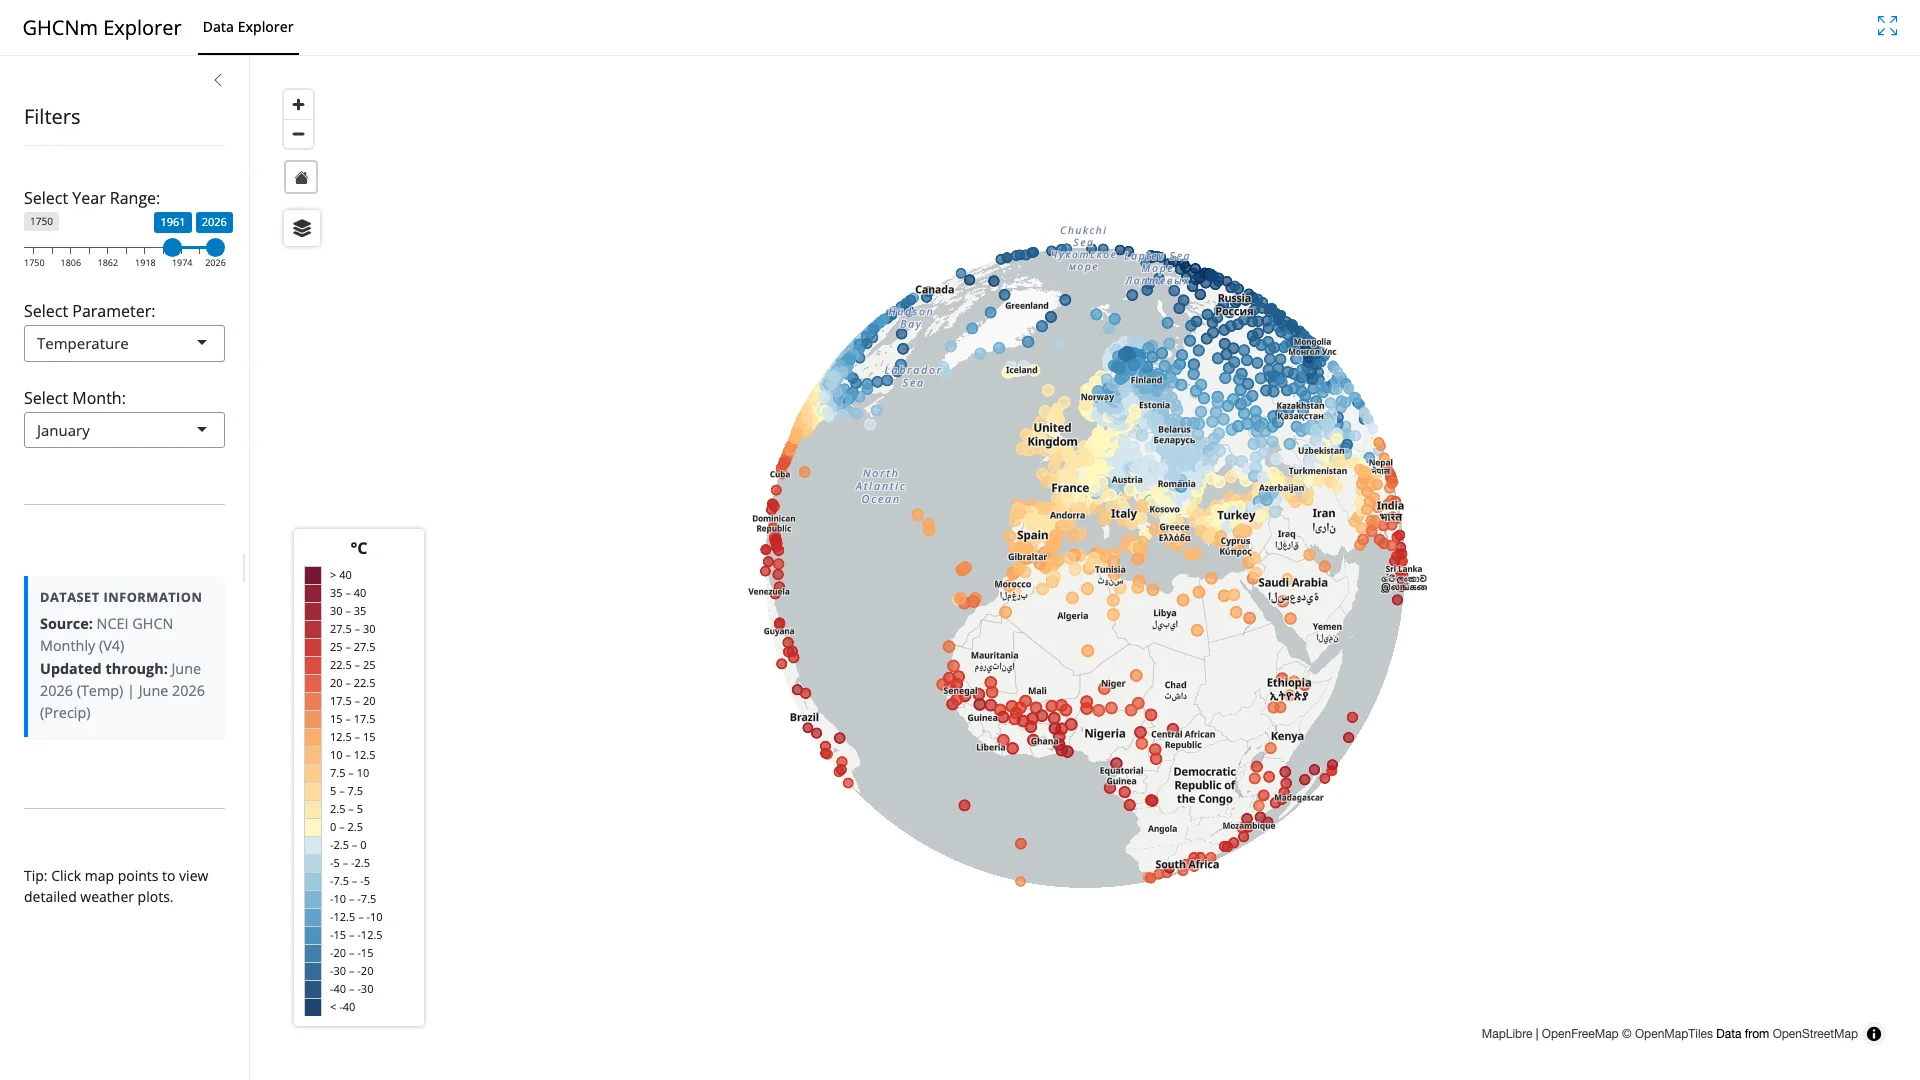
- Blue Dots: Represent stations available within your selected filters.
- Layer Control: Use the layer icon in the top left of the map to switch basemaps (e.g., Satellite, OpenFreeMap) and toggle labels.
- Selection: Click any blue dot to select a station. This will open the detailed plot panel.
4. Station Plot Panel
When you click a station on the map, a detailed data panel appears over the map.
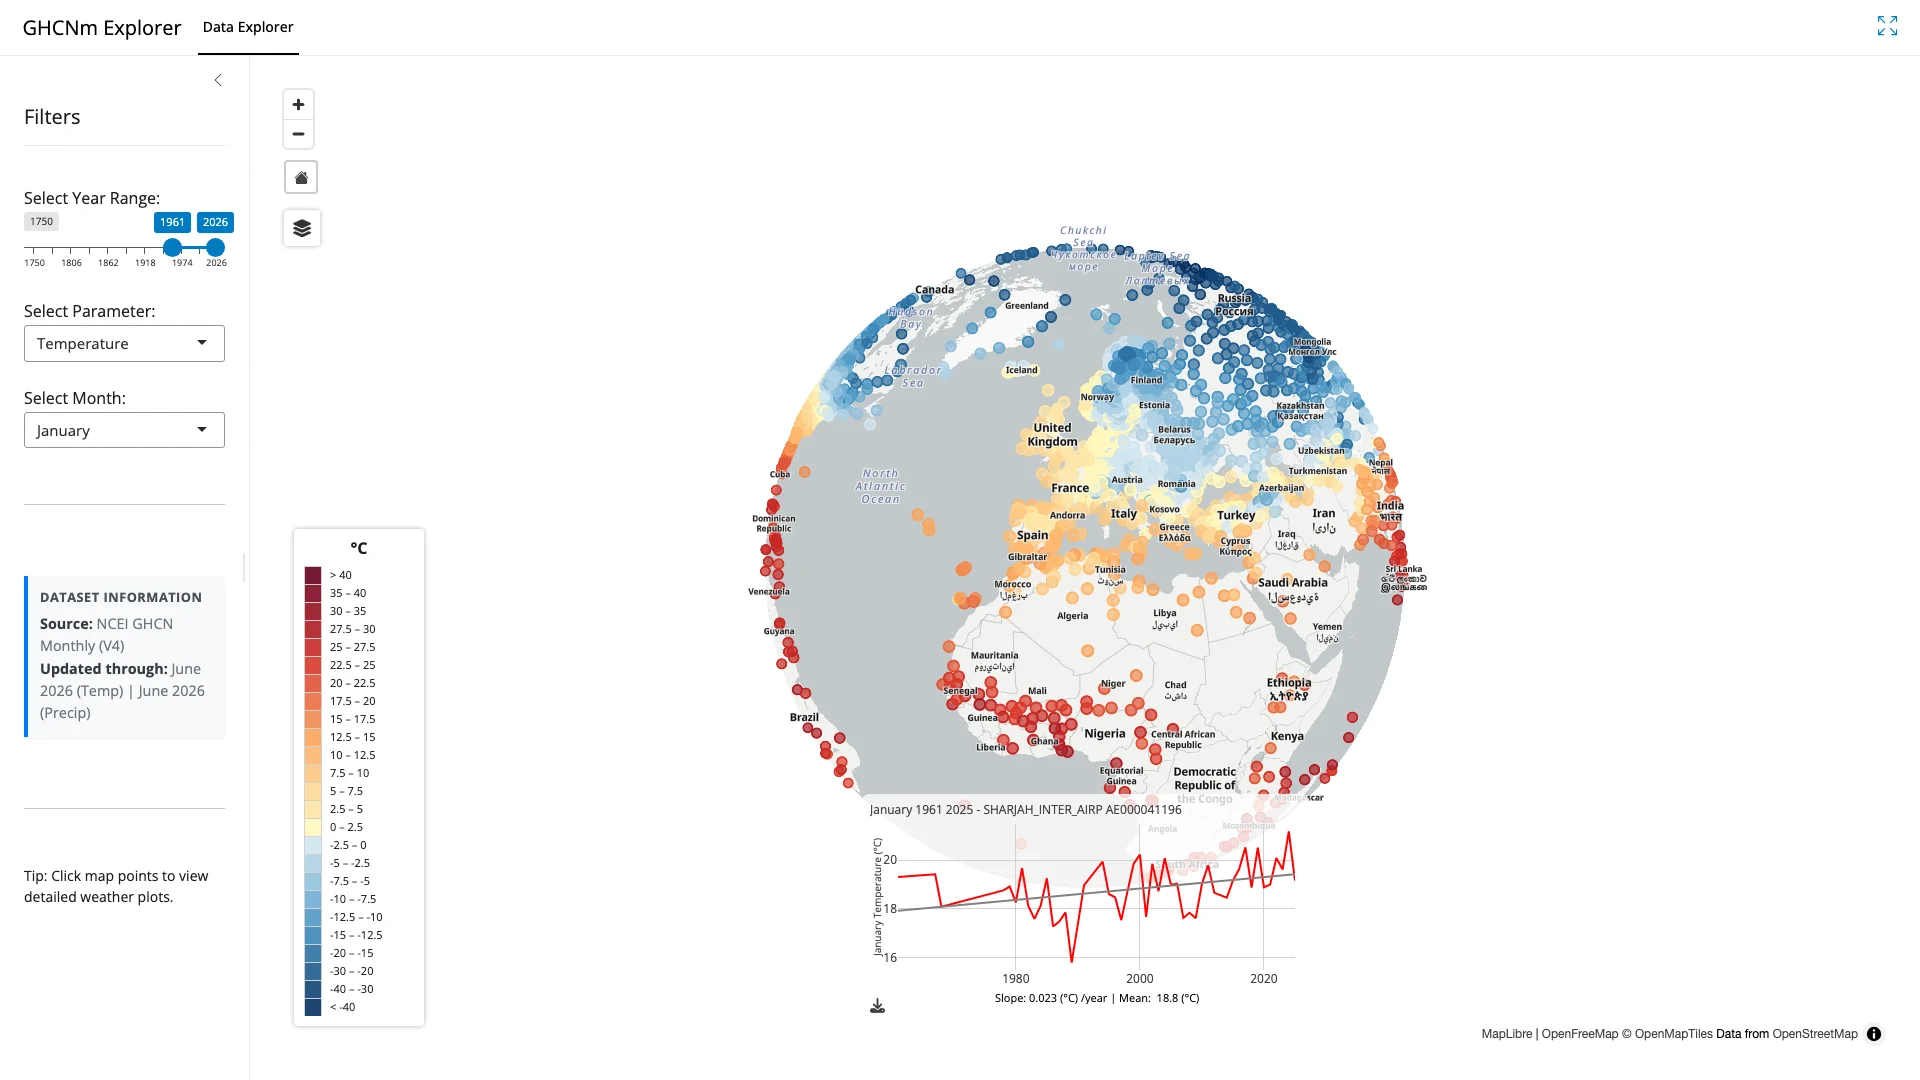
This panel provides specialized visualizations for the selected station based on your active parameter:
- Temperature/Precipitation Charts: Time series plots displaying the monthly values over the station’s history for the selected month.
- Trend Analysis: A linear trend line is overlaid on the charts to highlight long-term warming, cooling, or precipitation shifts. The trend is computed using an Ordinary Least Squares (OLS) linear regression model applied to the active temporal window. The calculated slope (e.g., +0.02 °C/year) and long-term mean are displayed beneath the plot.
- Fullscreen Mode: Use the fullscreen icon in the top right navigation bar to expand the dashboard for easier data analysis.
5. Parameter Reference
The following table lists the primary parameters available in the GHCNm Explorer.
| Parameter | Definition | Unit |
|---|---|---|
Temperature |
Average/Maximum/Minimum Monthly Temperature | °C |
Precipitation |
Total Monthly Precipitation | mm |
6. Direct Data Access
Advanced users can download the full historical raw data directly from the NOAA NCEI repository.
- Base URL (Temperature): https://www.ncei.noaa.gov/data/global-historical-climatology-network-monthly/v4/temperature/archive/
- Base URL (Precipitation): https://www.ncei.noaa.gov/data/ghcnm/v4/precipitation/archive/