The Invisible Dome: How the Urban Heat Island Amplified Paris’ June Extremes
As Europe experiences severe summer heatwaves, attention often focuses on peak daytime temperatures. However, for residents of major metropolises like Paris, a significant risk emerges after the sun goes down. The Urban Heat Island (UHI) effect—a phenomenon where concrete, asphalt, and dense infrastructure absorb and trap heat—reduces nighttime cooling in cities.
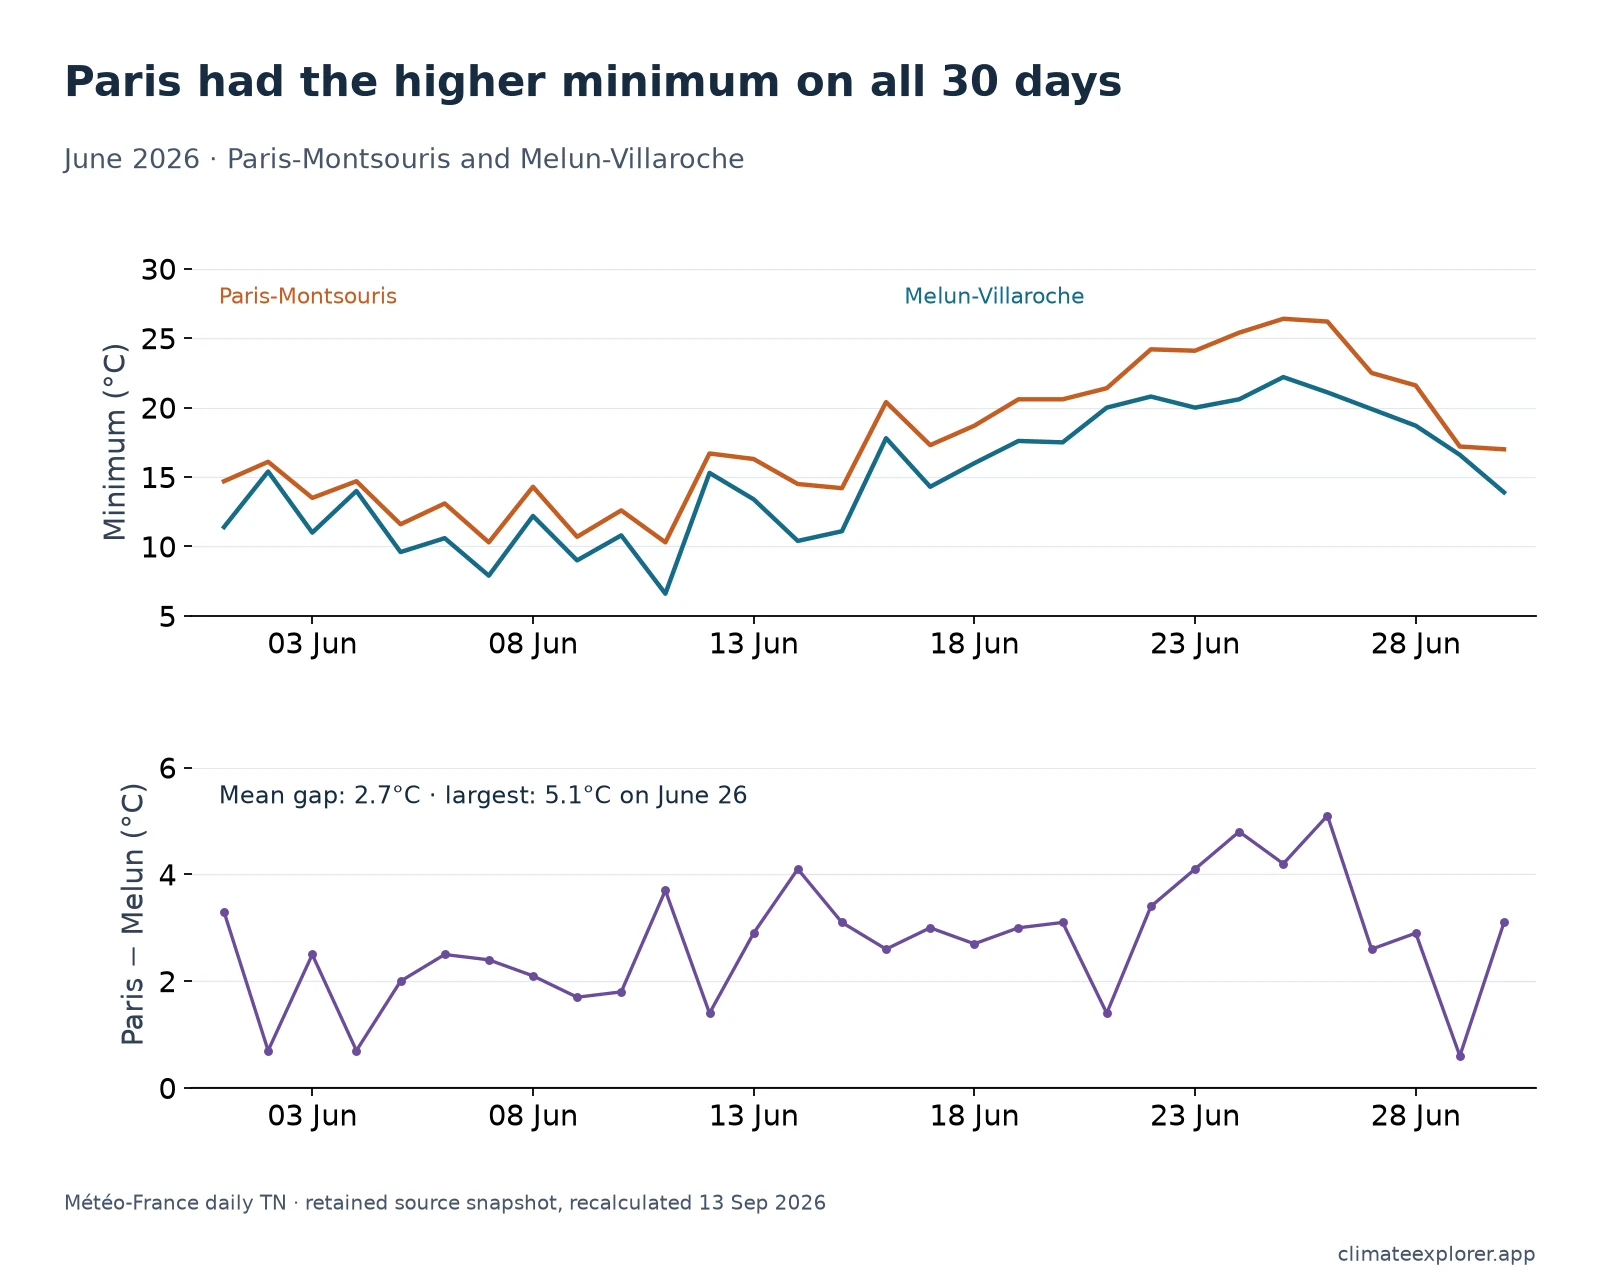
During the June 2026 heatwave, observations from Paris-Montsouris and Melun-Villaroche, about 35 kilometres apart, revealed a clear urban–rural contrast: the Paris station remained consistently warmer at night, indicating reduced nighttime cooling in the city.
The Geography of Heat
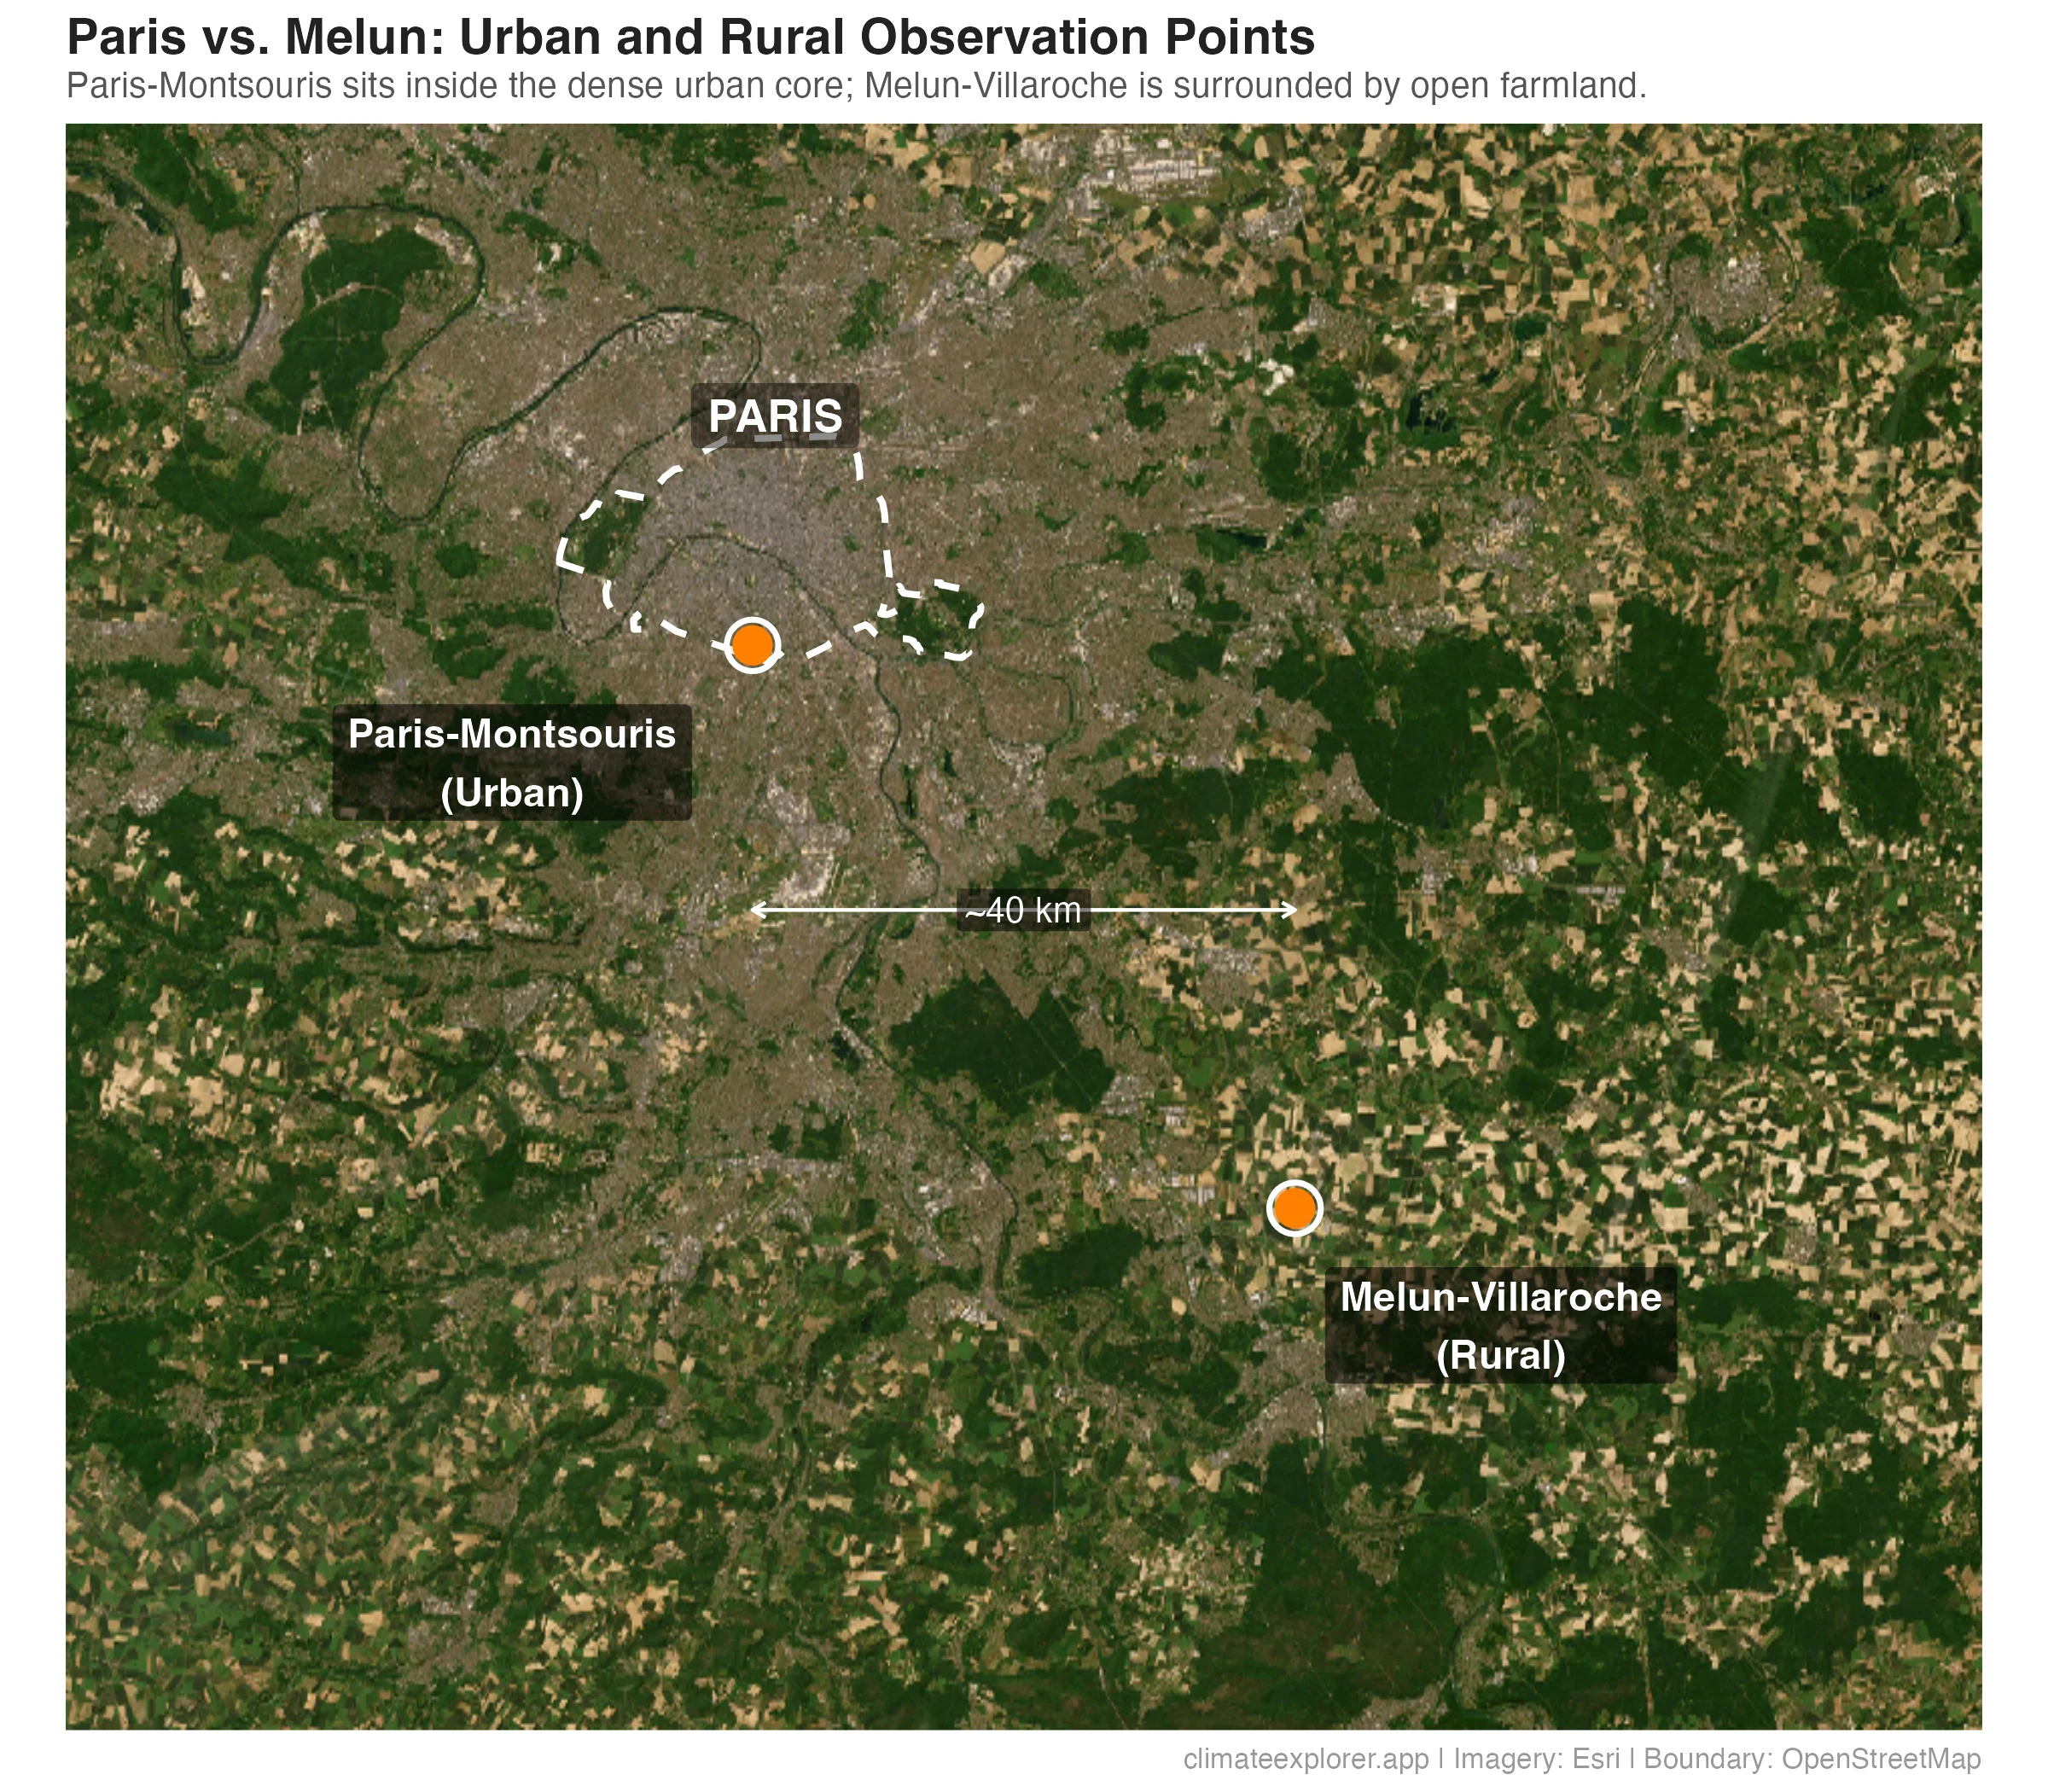
To understand the urban heat island effect in the context of Paris, we must look at the geography of our observation points. Paris-Montsouris (WIGOS ID: 0-20000-0-75114001) is a long-running urban park reference station, operational since 1872 and located within the city limits inside the Parc Montsouris. While it sits within the urban boundary, its instruments are positioned inside a large, tree-covered park—an environment that research has shown to be cooler than the surrounding densely built streets.1 This means the temperature differences measured between Montsouris and outlying stations may actually underestimate conditions in the more densely built-up neighbourhoods of central Paris.
Melun-Villaroche (WIGOS ID: 0-20000-0-77306001), located about 35 kilometres southeast of Paris, serves as a surrounding natural reference. Its open fields and significantly lower thermal mass make it a useful baseline for comparison. This pairing of Montsouris as the urban reference and Melun as the natural reference is an established methodology in French climatological modelling.2 (Note: WIGOS, or the WMO Integrated Global Observing System, provides globally unique identifiers that unequivocally map weather stations across international databases.)
A Month of Disparity
The June 2026 temperature record underscores how the urban environment alters the local microclimate. By examining the daily extremes—the minimum (Tmin) and maximum (Tmax) temperatures—we can clearly see the disparity. While daytime maximum temperatures between the city and the countryside tracked very closely, the nighttime minimums told a completely different story.
Throughout the month, Paris consistently failed to shed its accumulated daytime heat. The concrete infrastructure, acting as a thermal battery, slowly radiated heat back into the city streets overnight, keeping the baseline elevated.
The chart above shows how each station’s temperatures departed from its own 1991-2020 WMO monthly normal for June (e.g., a baseline of 14.2°C for Paris Montsouris). Because each station is compared against a different baseline, the gap between these anomaly curves does not directly represent the UHI magnitude. What the chart does reveal is that on nearly every night in June, the urban station experienced proportionally larger warm departures from its own normal than the rural station. This persistent pattern, combined with already higher absolute urban normals, indicates an additional thermal burden associated with the urban environment—one that deprives the human body of the necessary recovery period following extreme daytime thermal stress.3
Shattering Historical Maxima
The disparity became most pronounced during the peak heatwave event in late June. As a stagnant high-pressure system settled over Western Europe, the mechanisms that typically help ventilate the city were suppressed.
The historical data from the modern digital era (1950–2025) shows that Paris-Montsouris (WIGOS ID: 0-20000-0-75114001) had only ever reached a peak of 36.9°C in June (recorded on June 21, 2017). Melun-Villaroche had a nearly identical historical June record of 36.8°C (set on June 27, 2011).
However, during the peak of the late June 2026 heatwave, both stations surged past these previous marks by a wide margin. On June 24, 2026, Paris-Montsouris recorded a maximum of 40.6°C, exceeding its previous post-1950 June record by nearly 4 degrees. Melun-Villaroche reached 39.8°C on the same day.
This extreme thermal surge was not isolated to Montsouris. Météo-France data reveals that every active weather station across the capital’s intra-muros area surpassed its historical June records. The table below lists all six Department-75 stations with June 2026 temperature data:
| Station | WIGOS ID | June 2026 Tmax (°C) | Previous June Record (°C) | Record Year |
|---|---|---|---|---|
| Luxembourg Gardens | 0-20000-0-75106001 |
42.2 | 37.6 | 2011 |
| Longchamp | 0-20000-0-75116008 |
42.1 | 38.8 | 2017 |
| Lariboisière | 0-20000-0-75110001 |
41.7 | 37.8 | 2022 |
| Paris-Montsouris | 0-20000-0-75114001 |
40.6 | 36.9 | 2017 |
| Paris-Montsouris (Double) | 0-20000-0-75114007 |
40.5 | 36.4 | 2017 |
| Tour Eiffel | 0-20000-0-75107005 |
40.1 | 35.9 | 2002 |
The intensity of this extreme event severely challenged historical thresholds, pushing the entire urban core into unprecedented thermal territory.
While the rural station experienced greater relative nighttime cooling, it is important to note that Melun itself still recorded tropical-night-level minimums (above 20°C) on several peak nights. The shading in the chart above visualises the raw nocturnal temperature difference between the two stations—a direct proxy for the additional thermal burden associated with the urban environment.
Conclusion
As the climate warms, urban heat retention can compound nighttime heat exposure. Urban greening, reflective materials and improved ventilation can help reduce this additional burden.
Frequently Asked Questions
What is the Urban Heat Island (UHI) effect?
The Urban Heat Island effect is a phenomenon where urban areas experience significantly warmer temperatures than their rural surroundings. This occurs because dense infrastructure, such as concrete and asphalt, absorbs and retains solar heat during the day and slowly releases it at night.
Why is the UHI effect dangerous during a heatwave?
The UHI effect reduces nighttime cooling in cities. This lack of nighttime relief is dangerous because it deprives the human body of the necessary recovery period following extreme daytime heat stress, leading to a higher risk of heat exhaustion and heatstroke.
How much warmer was Paris compared to rural areas in June 2026?
During the peak of the June 2026 heatwave, nocturnal temperatures at the Paris-Montsouris urban park station were consistently several degrees Celsius warmer than the nearby natural reference station of Melun-Villaroche. On June 24, the day the absolute maximum temperatures were recorded, Paris retained a minimum nocturnal temperature of 25.4°C, which was 4.8°C warmer than Melun’s minimum of 20.6°C. Because Montsouris is located in a large park, actual conditions in the more densely built-up neighbourhoods were likely warmer still.
Where does the temperature data for this analysis come from?
The historical and peak heatwave data is sourced directly from the official Météo-France daily climate dataset. Baseline comparison averages are derived from the WMO Climate Normals (1991-2020). You can explore this raw data yourself using our interactive Météo-France Data Explorer and WMO Normals Explorer tools.
Data Annex
The raw meteorological data and station metadata utilised for this analysis are provided below for reference and reproducibility.
Stations central to the Paris–Melun analysis
| Station Name | WIGOS ID | Latitude | Longitude | Elevation | Analytical Role |
|---|---|---|---|---|---|
| Paris-Montsouris | 0-20000-0-75114001 |
48.8217° N | 2.3378° E | 75 m | Urban Park Reference |
| Melun-Villaroche | 0-20000-0-77306001 |
48.6017° N | 2.6733° E | 90 m | Natural Reference |
| Luxembourg Gardens | 0-20000-0-75106001 |
48.8450° N | 2.3367° E | 46 m | Intra-muros Station |
| Longchamp | 0-20000-0-75116008 |
48.8650° N | 2.2333° E | 27 m | Intra-muros Station |
| Tour Eiffel | 0-20000-0-75107005 |
48.8583° N | 2.2944° E | 330 m | Elevated Intra-muros |
| Lariboisière | 0-20000-0-75110001 |
48.8828° N | 2.3520° E | 55 m | Intra-muros Station |
| Paris-Montsouris (Double) | 0-20000-0-75114007 |
48.8217° N | 2.3378° E | 75 m | Intra-muros Station |
Note: “Urban Park Reference,” “Natural Reference,” and “Intra-muros Station” are analytical roles assigned for this analysis, not official Météo-France classifications.
Peak Heatwave Temperature Data (June 20–28, 2026)
| Date | Paris Tmin (°C) | Melun Tmin (°C) | Tmin Difference (°C) | Paris Tmax (°C) | Melun Tmax (°C) |
|---|---|---|---|---|---|
| 2026-06-20 | 20.6 | 17.5 | 3.1 | 36.0 | 36.3 |
| 2026-06-21 | 21.4 | 20.0 | 1.4 | 37.0 | 36.7 |
| 2026-06-22 | 24.2 | 20.8 | 3.4 | 38.4 | 37.4 |
| 2026-06-23 | 24.1 | 20.0 | 4.1 | 37.3 | 36.5 |
| 2026-06-24 | 25.4 | 20.6 | 4.8 | 40.6 | 39.8 |
| 2026-06-25 | 26.4 | 22.2 | 4.2 | 40.1 | 39.5 |
| 2026-06-26 | 26.2 | 21.1 | 5.1 | 37.8 | 38.0 |
| 2026-06-27 | 22.5 | 19.9 | 2.6 | 36.8 | 37.4 |
| 2026-06-28 | 21.6 | 18.7 | 2.9 | 30.5 | 32.6 |
Data Sources
Data current as of 11 July 2026. Météo-France states that the daily climate files undergo climatological quality control and that files covering the latest two years are updated daily; subsequent revisions may therefore occur.
- Météo-France Daily Climate Dataset: Quotidian meteorological observations for all French departments.
- Météo-France OpenData Portal: French meteorological observation networks and archives.
- Météo-France June 2026 Climate Assessment: Official national heatwave assessment.
- Nogueira, M. et al. (2022): Assessment of the Paris urban heat island in ERA5 and offline SURFEX-TEB (v8.1) simulations using the METEOSAT land surface temperature product, Geoscientific Model Development, 15, 5949–5965.
- Dahech et al. (2020): Représentativité des températures mesurées dans la station météorologique Paris-Montsouris.
Footnotes
For an assessment of site-specific effects at the Montsouris station, including tree shading and local microclimate influences, see Dahech et al. (2020): Représentativité des températures mesurées dans la station météorologique Paris-Montsouris.↩︎
This pairing is explicitly used in urban climate modelling. See Nogueira, M. et al. (2022): Assessment of the Paris urban heat island in ERA5 and offline SURFEX-TEB (v8.1) simulations using the METEOSAT land surface temperature product, Geoscientific Model Development, 15, 5949–5965.↩︎
The World Health Organization (WHO) heat and health fact sheet explains that sustained high daytime and nighttime temperatures create cumulative physiological stress and increase heat-illness risks such as heat exhaustion and heatstroke. See WHO (2024): Heat and health.↩︎