Météo-France User Guide
Access the Application: Return to Explorer
1. Introduction
The Météo-France Explorer is an interactive dashboard for exploring open data from Météo-France. It allows you to visualize meteorological records from stations across France (including overseas territories such as Guadeloupe, Martinique, Guyane, La Réunion, and Mayotte), including air temperature, precipitation, and wind speed.
If you need Europe-wide near real-time hourly observations, use the EuroMeteo Explorer for cross-country coverage.
3. Direct Data Download
Advanced users can download data directly from the Météo-France datasets on data.gouv.fr without using the application interface. This is useful for automated scripts or bulk downloading.
- 6-Minute Data: Données climatologiques de base - 6 minutes
- Hourly Data: Données climatologiques de base - horaires
- Daily Data: Données climatologiques de base - quotidiennes
- Monthly Data: Données climatologiques de base - mensuelles
The data is organized by French department and time period. Each department has multiple CSV files covering different historical periods.
Example (Lyon-St Exupery)
To download data for a specific station, identify the department from the Stations Info table, then download the corresponding department file from data.gouv.fr.
- Station: Lyon-St Exupery (ID:
69299001) - Department:
69(Rhône) - Dataset: Navigate to the hourly dataset and search for “departement_69” to find files for the Rhône department.
- Description: Each department file contains data for all stations in that department, including Lyon-St Exupery.
4. Main Navigation Tabs
The application features three main tabs at the top:
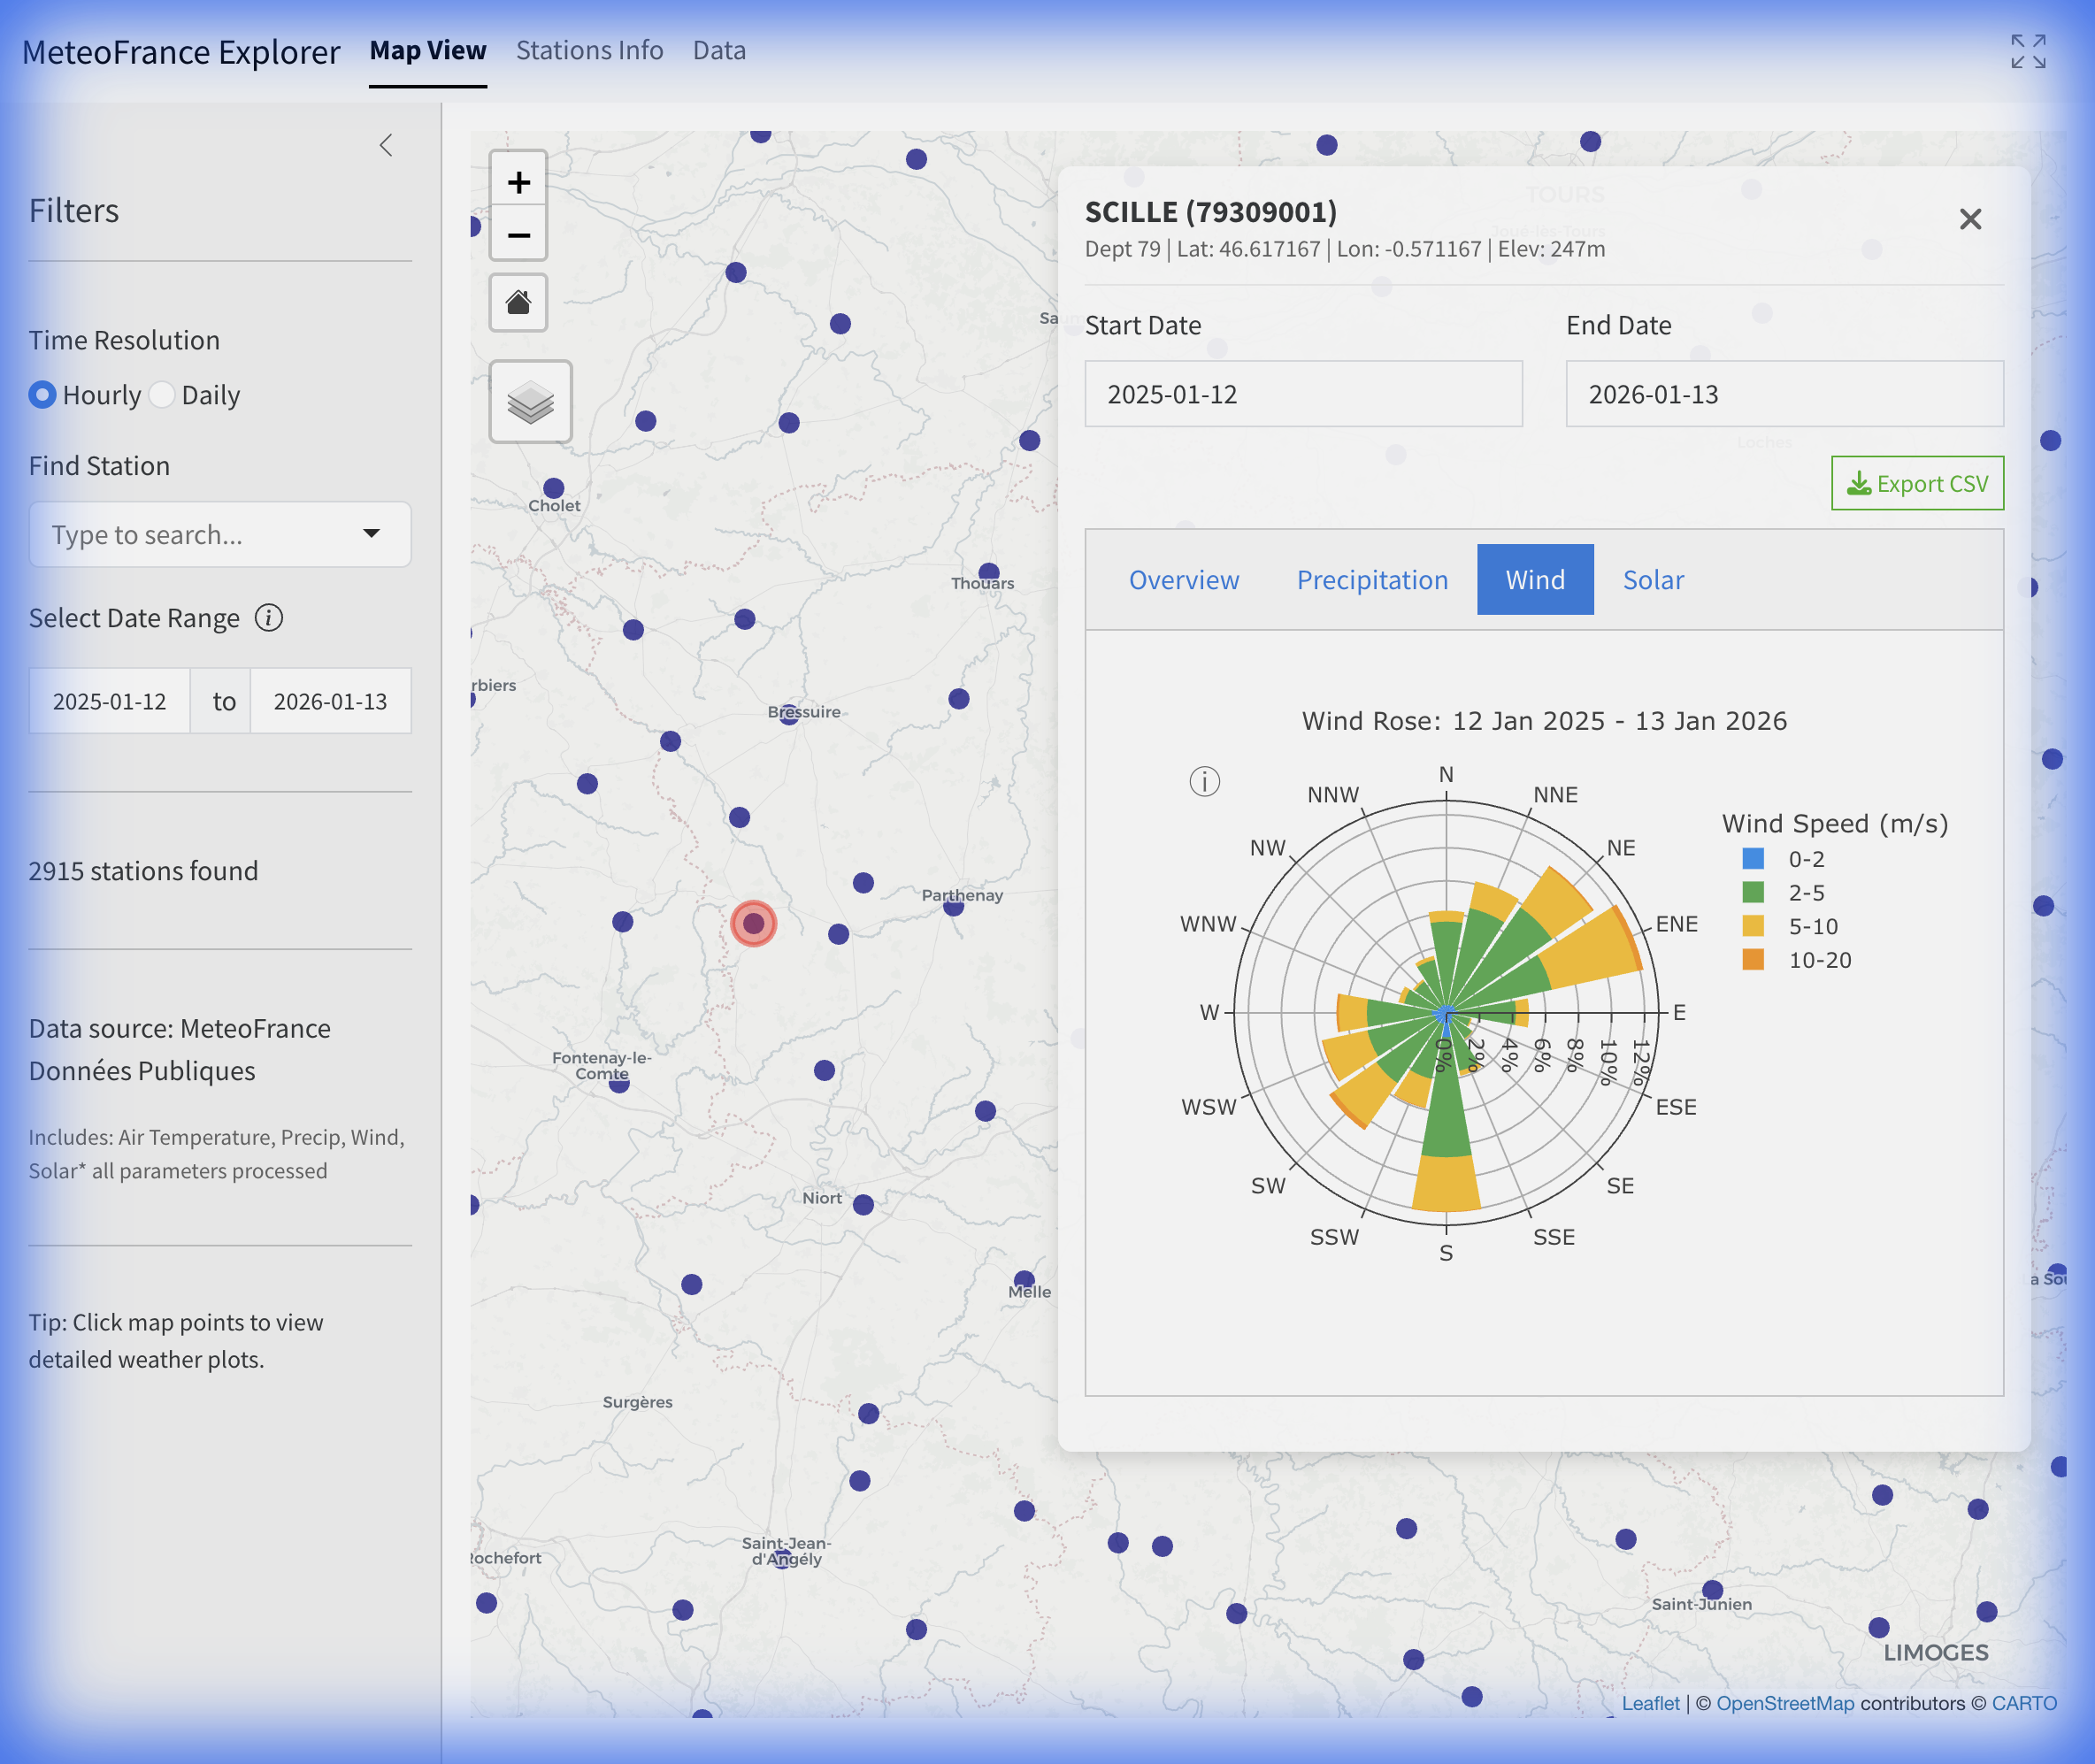
Map View
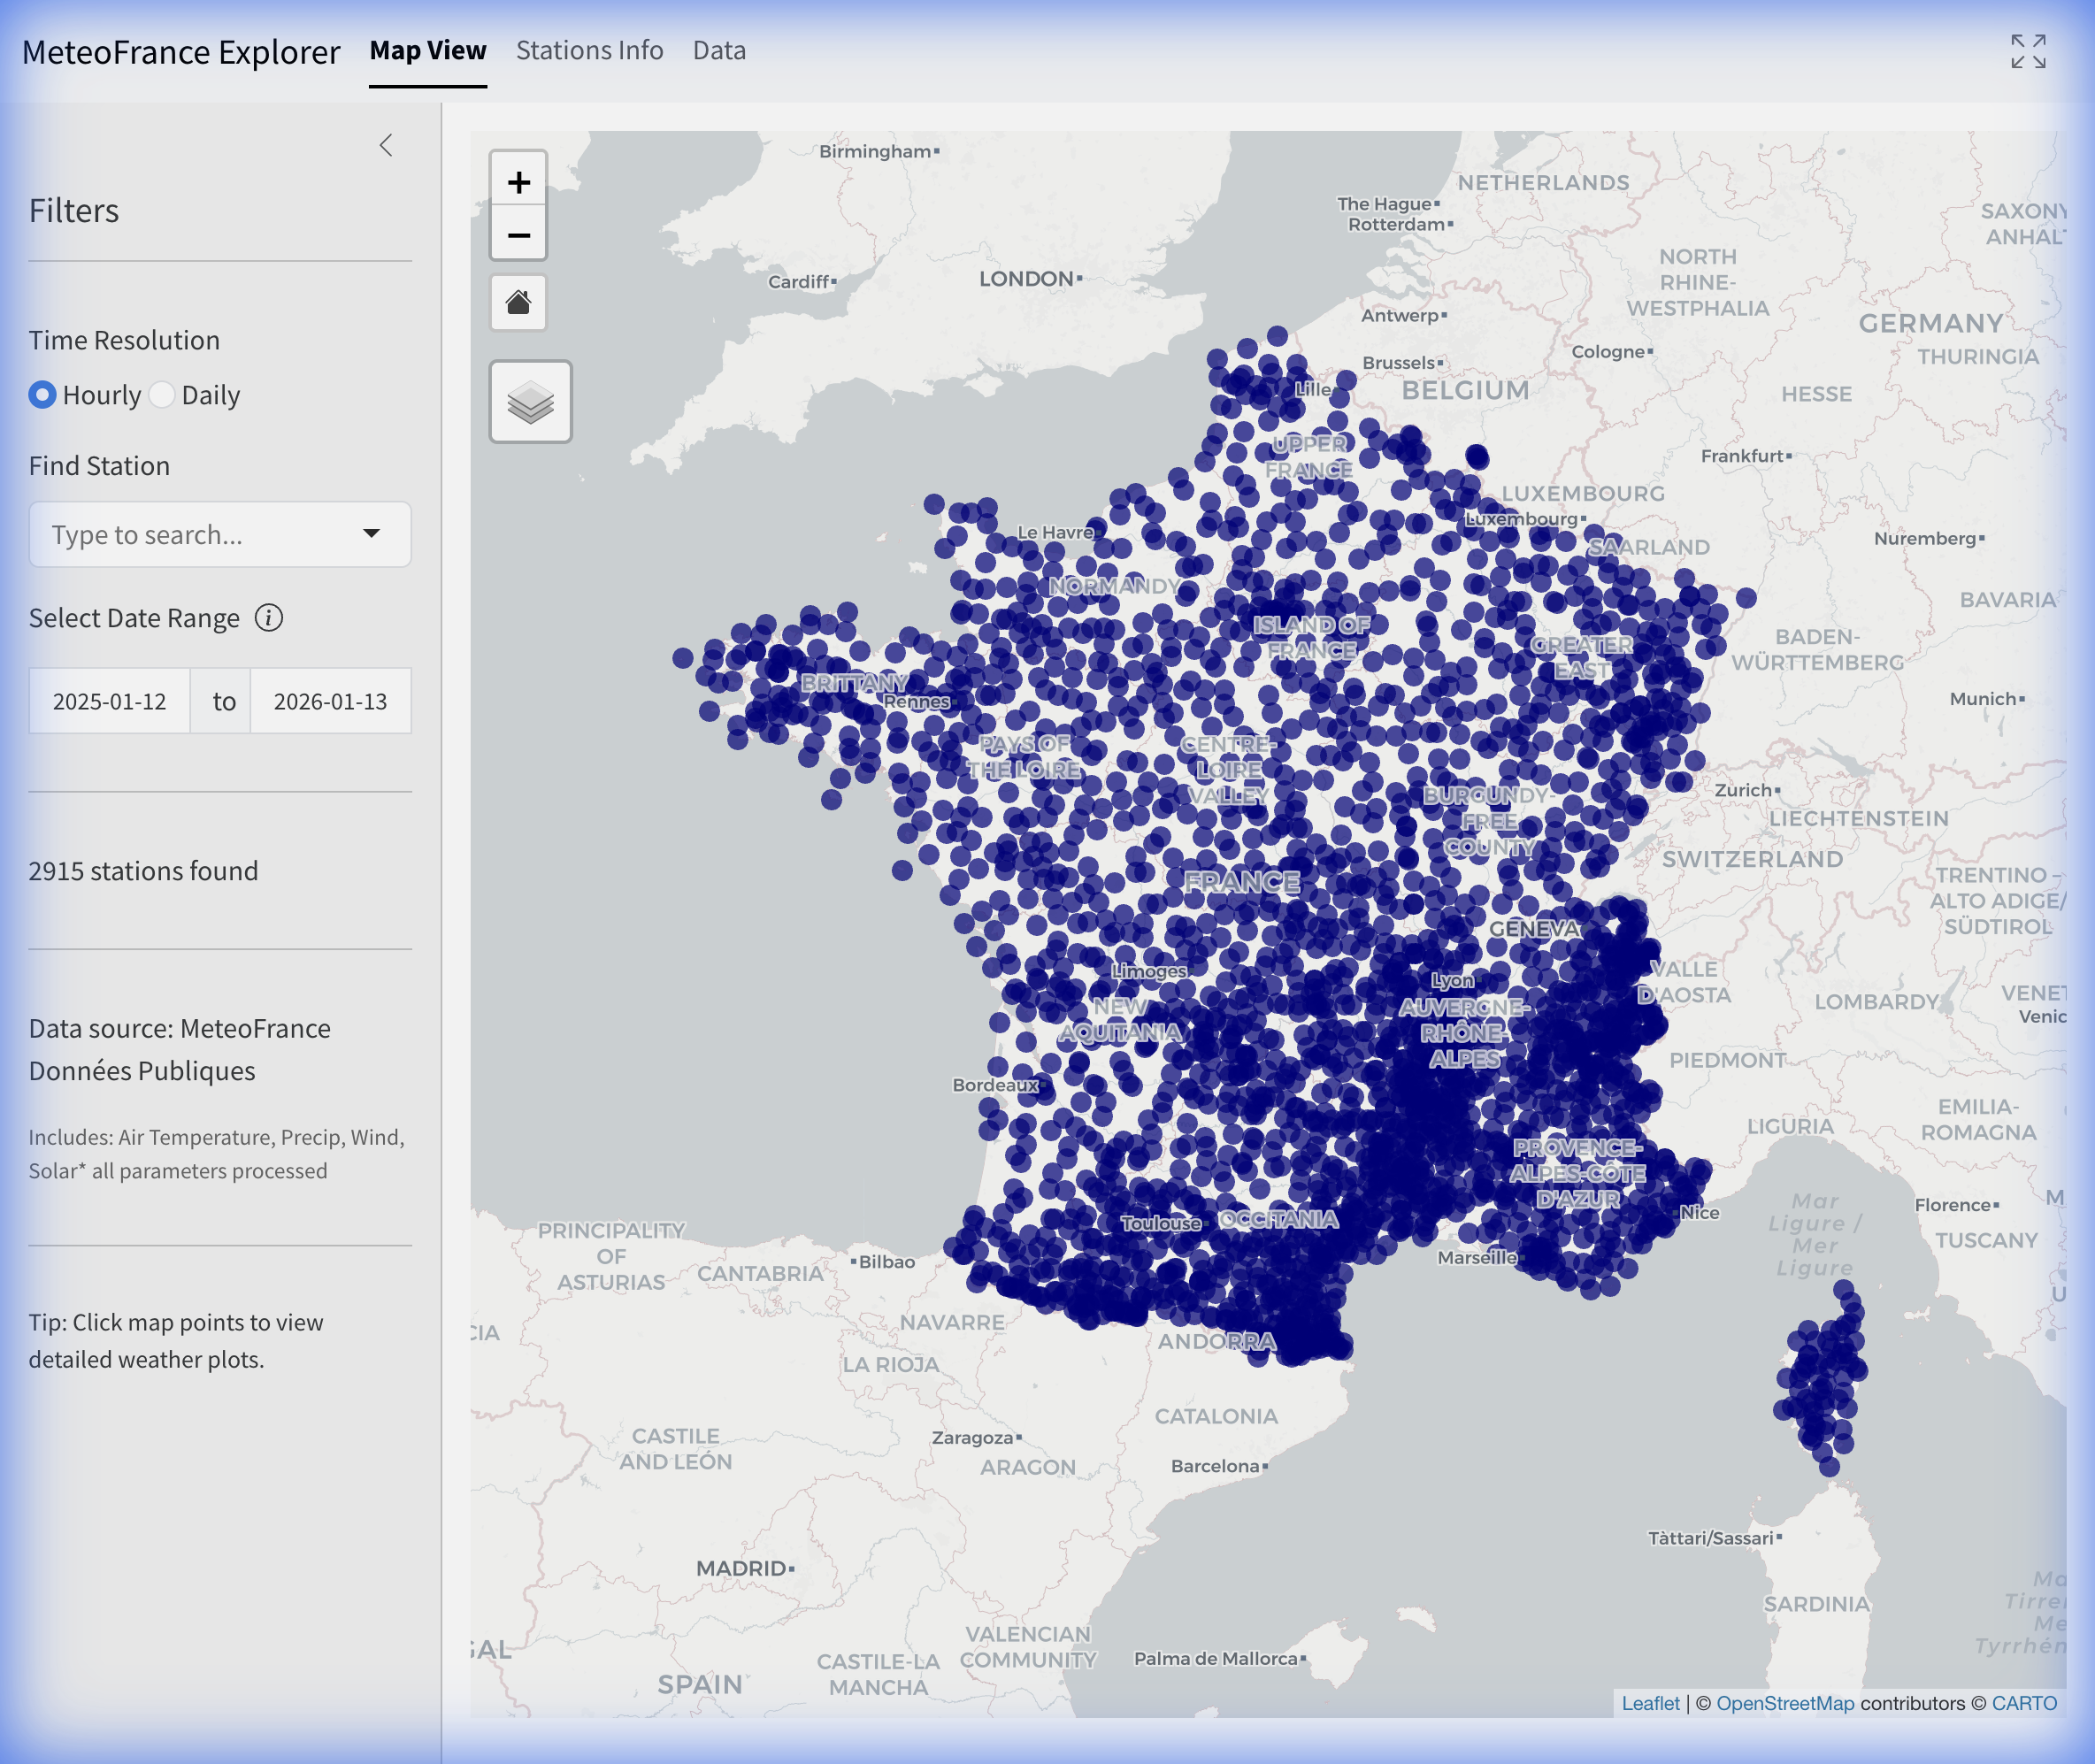
The default view is an interactive map showing available French weather stations.
- Markers: Represent available Météo-France stations.
- Selection: Click any marker to highlight the station and view its information.
- Home Button: A “Home” icon is overlaid on the map to quickly reset the zoom level to show France.
Stations Info
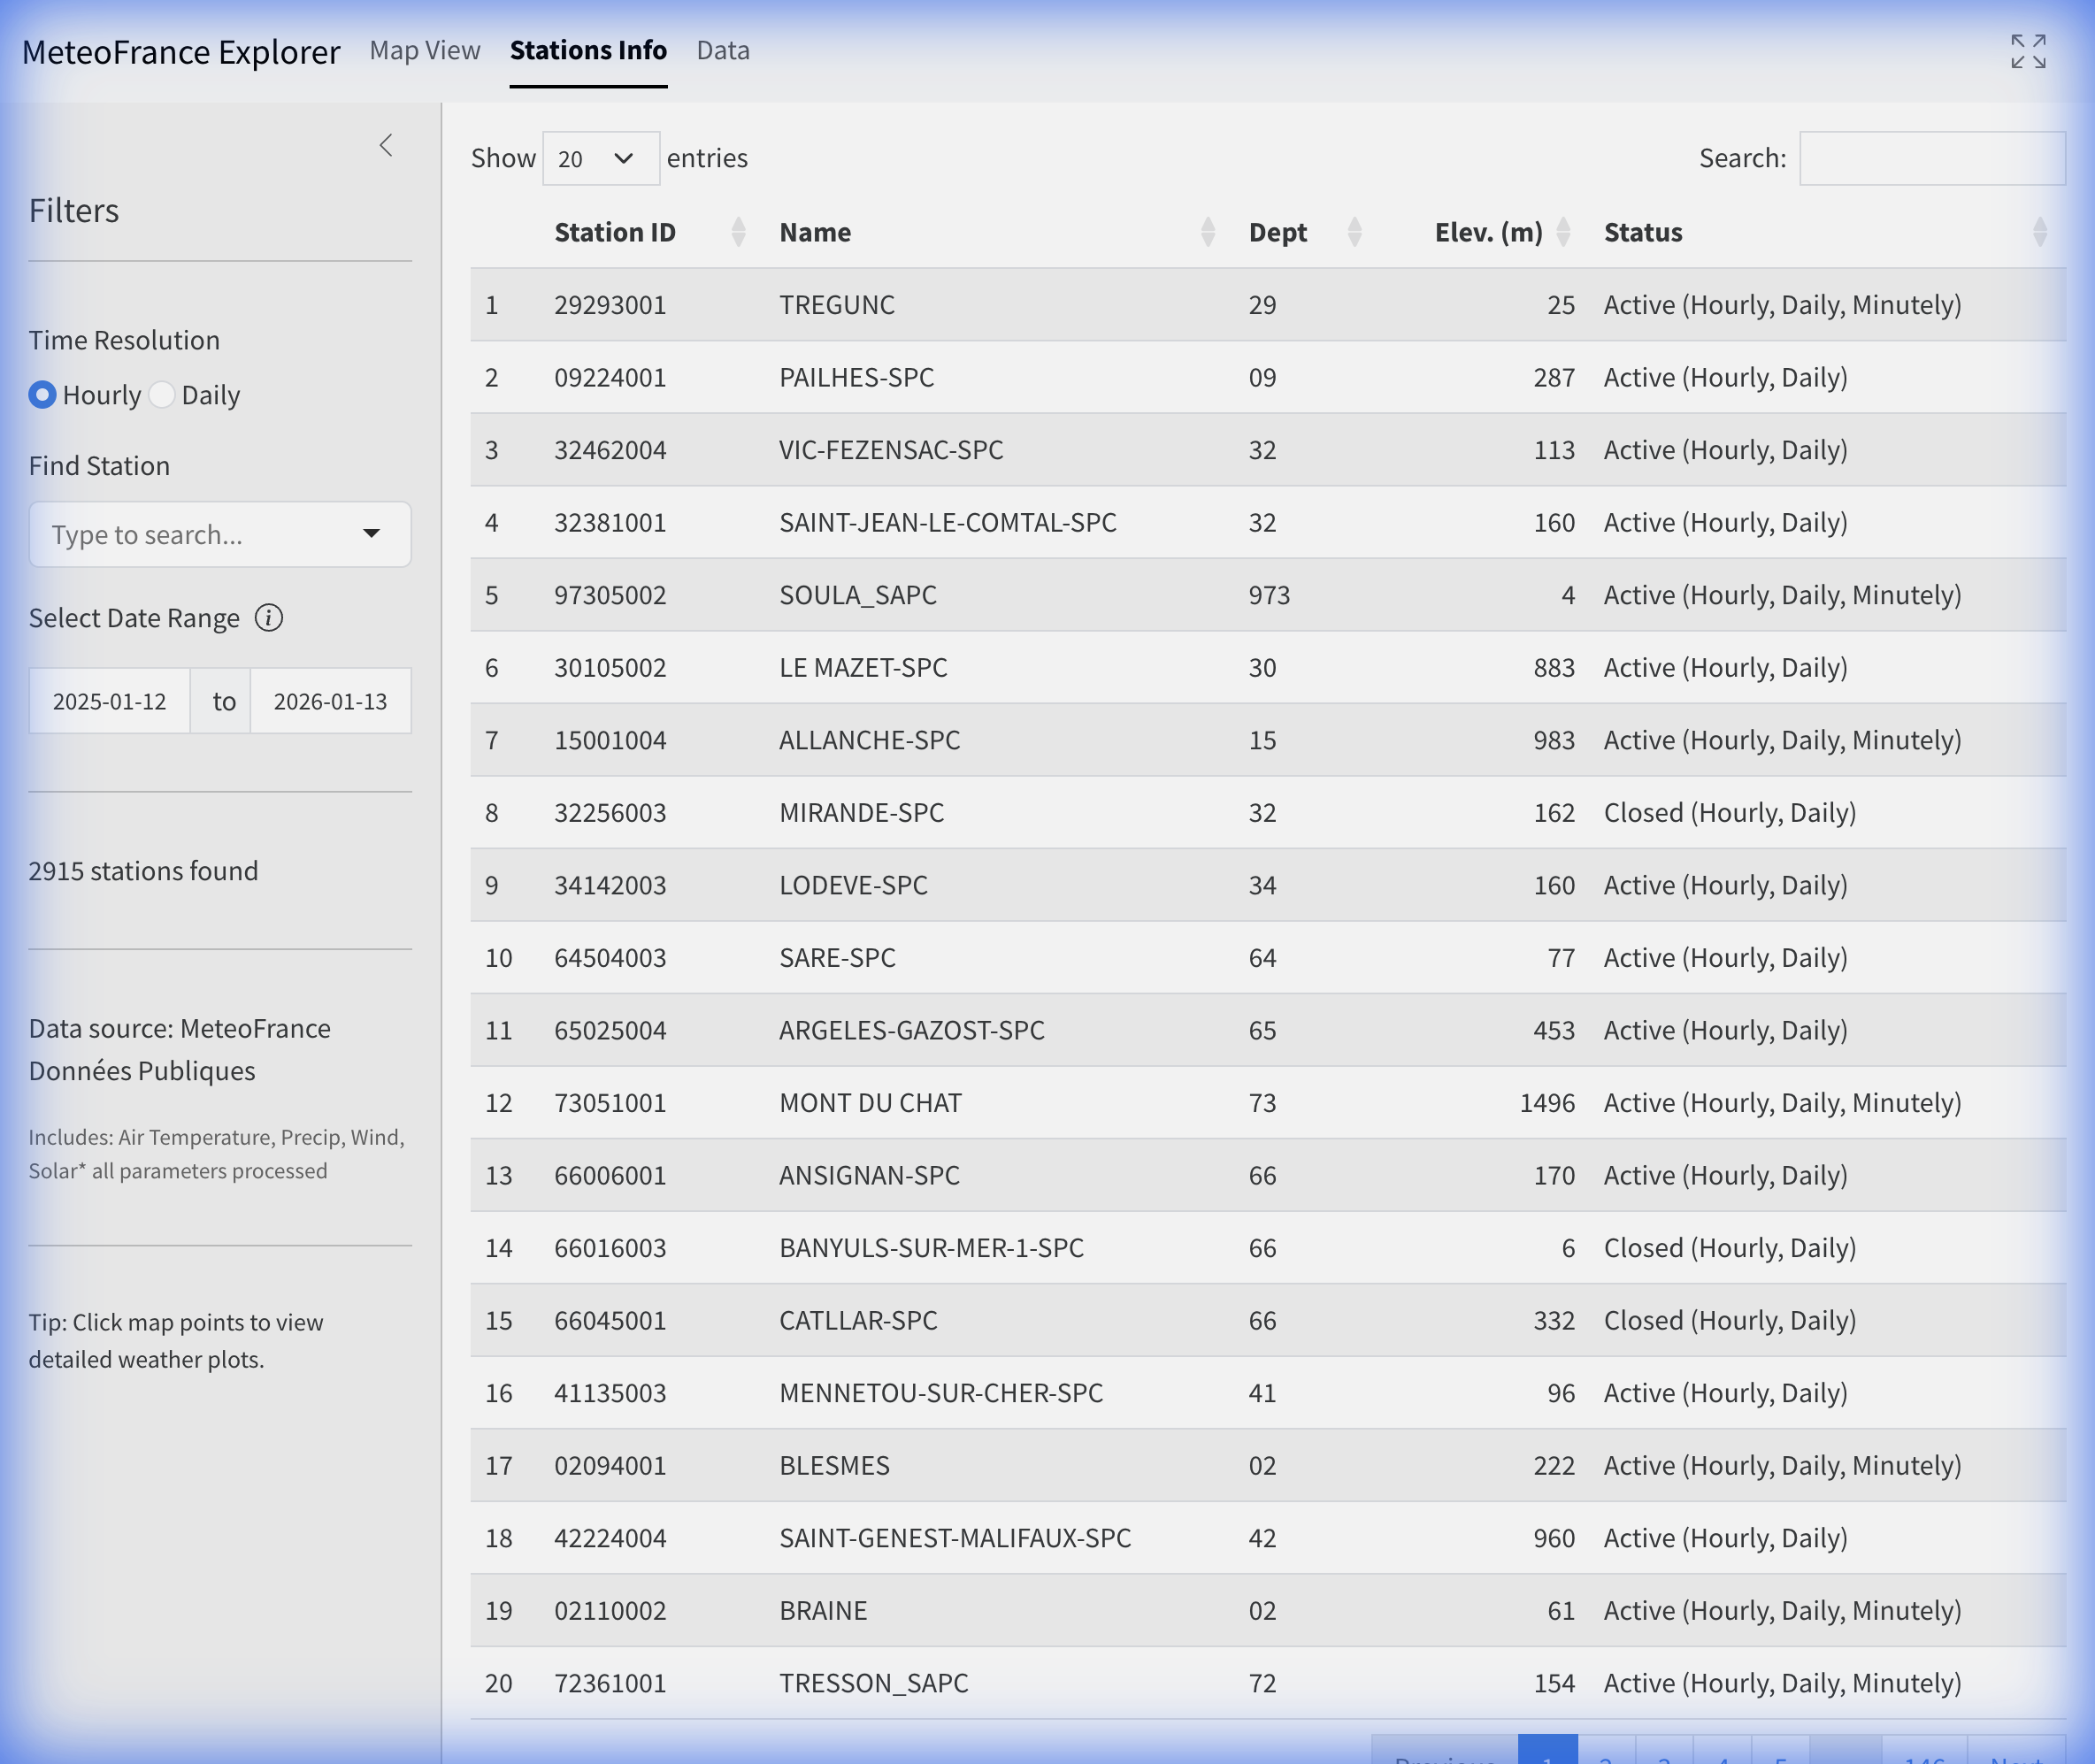
A tabular listing of all available stations. This view is useful for browsing the full station catalog.
- Double-Click: Double-click any row to load that station’s data and navigate directly to the Dashboard.
Dashboard
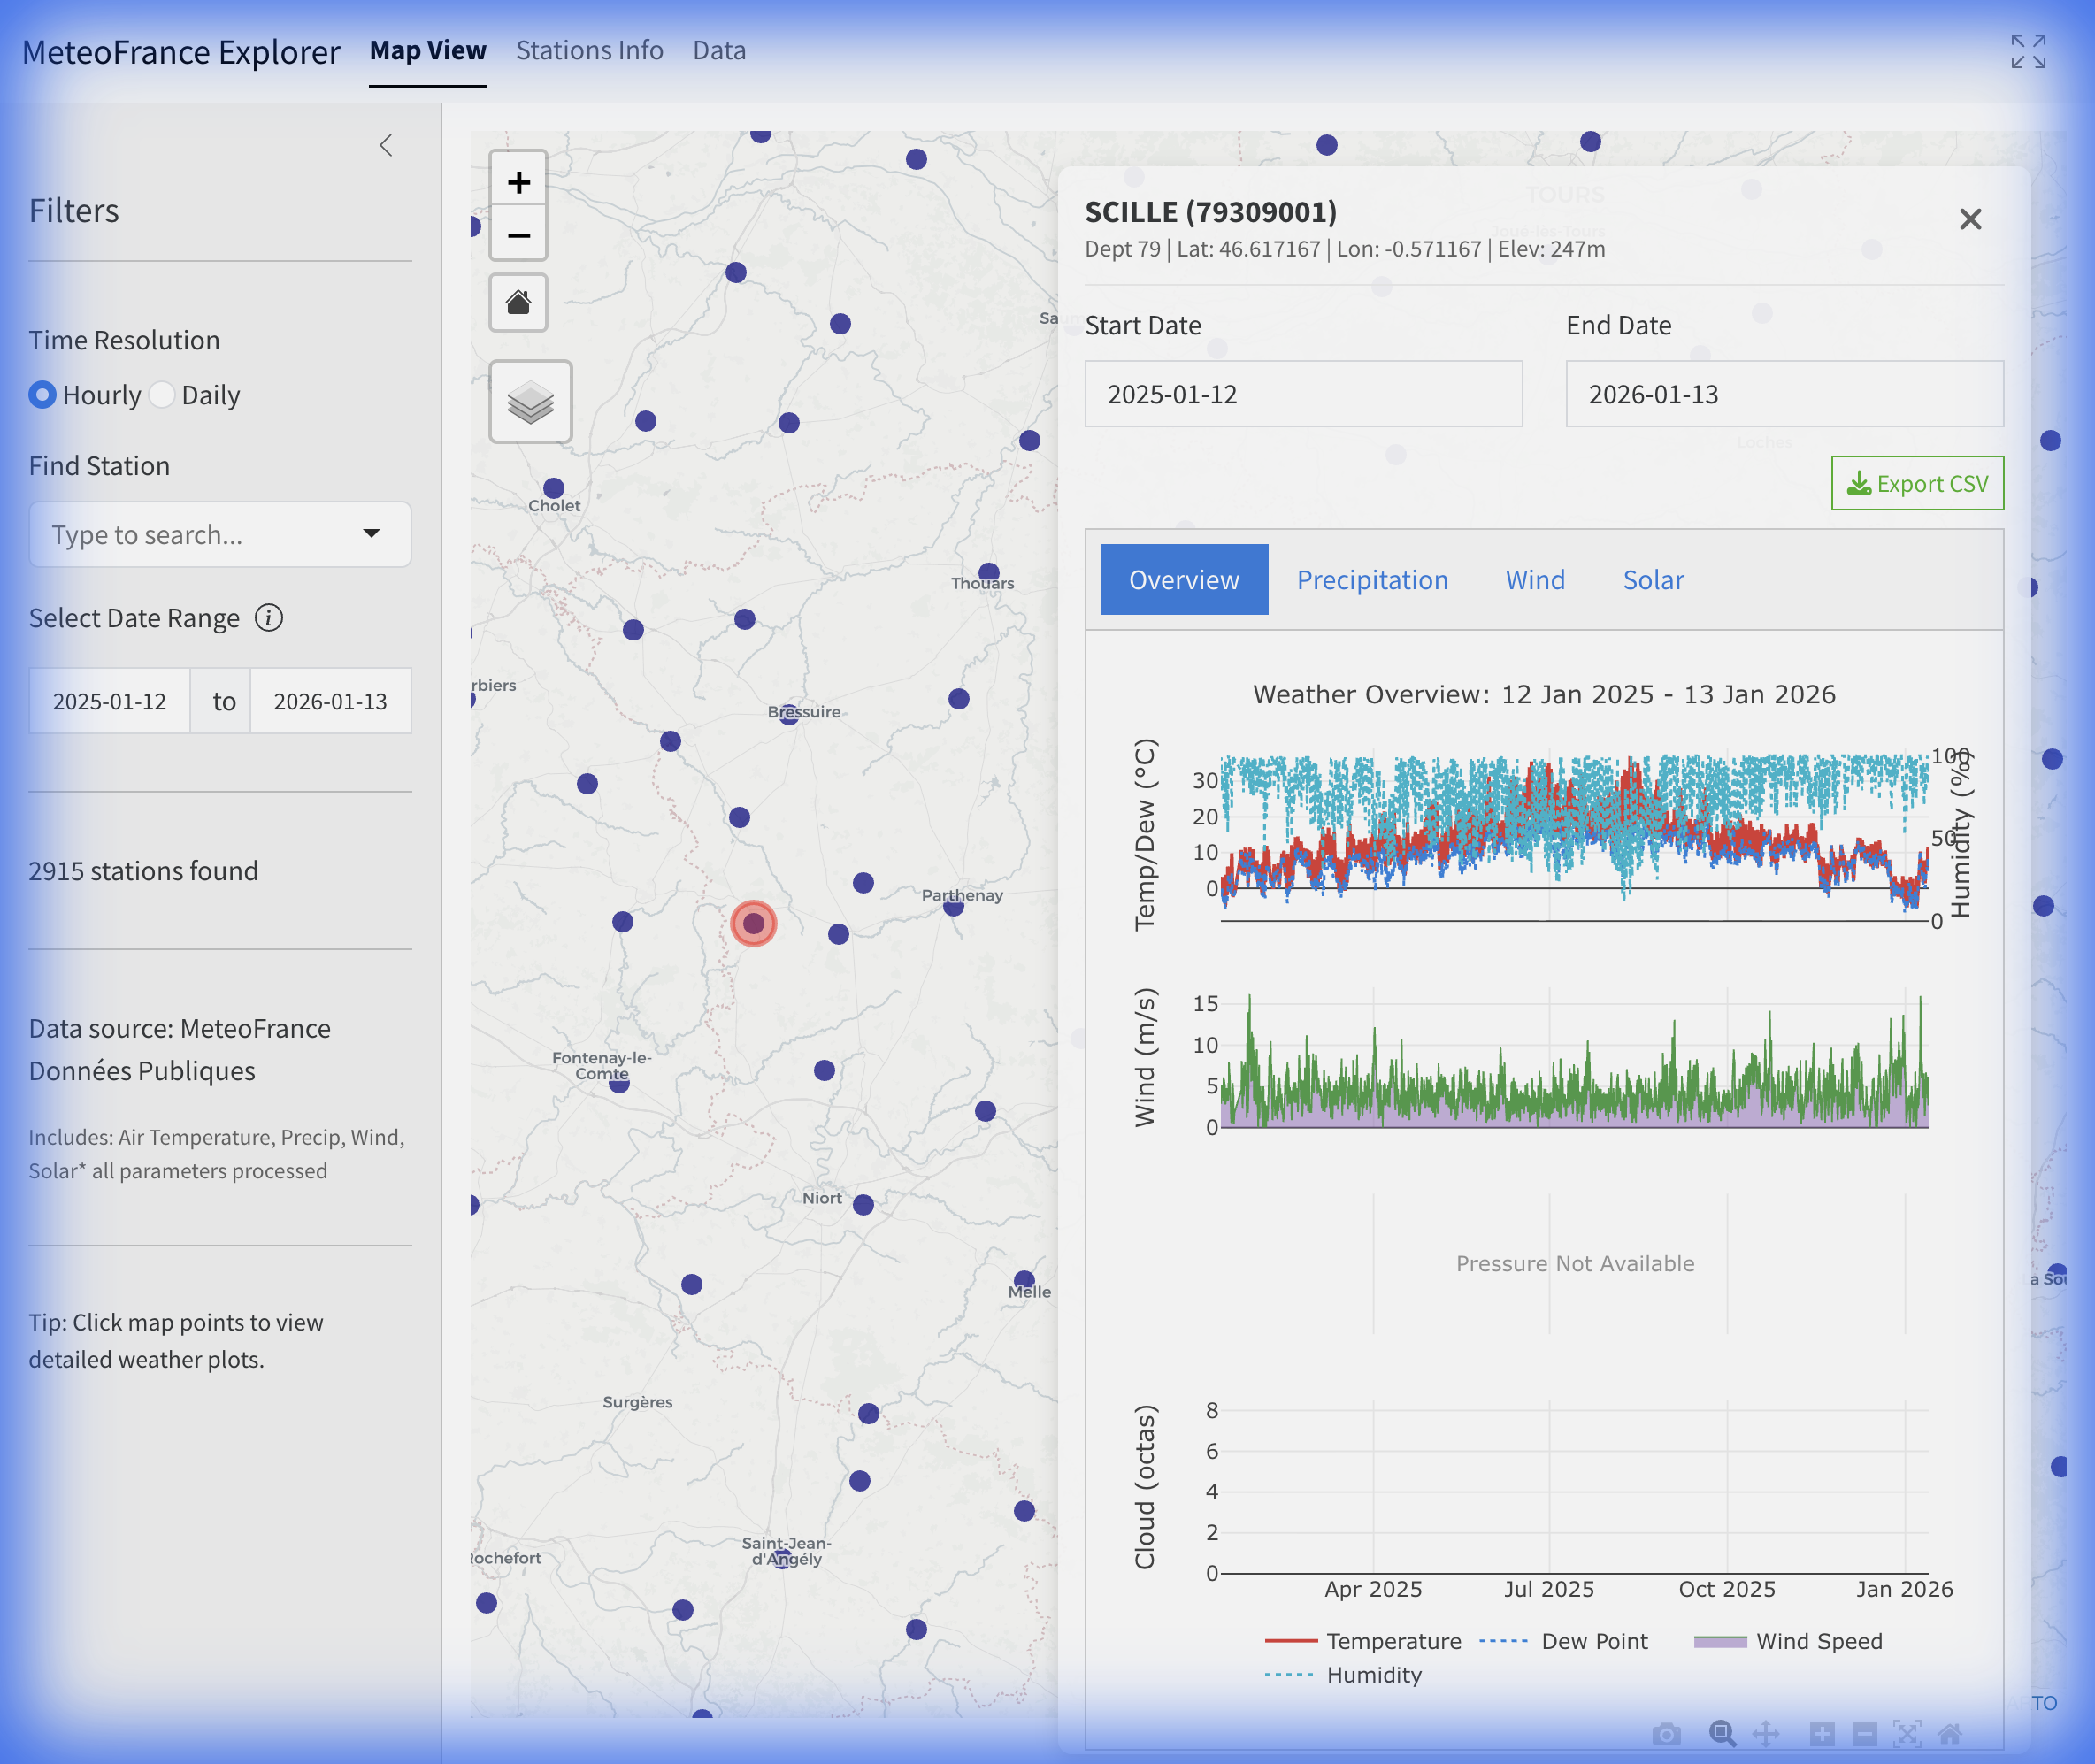
The Dashboard displays detailed data for a selected station. It only becomes active after selecting a station from the map or double-clicking a row in the Stations Info table.
Dashboard Header
- Station Info: Displays the station name, ID, department, and operational dates.
- Export CSV: Download the processed data for the current station and time range in the selected resolution.
Dashboard Sub-Tabs
The Dashboard contains two sub-tabs:
- Plots: Specialized visualization tabs for different weather parameters:
- Temperature: A comprehensive temperature timeline.
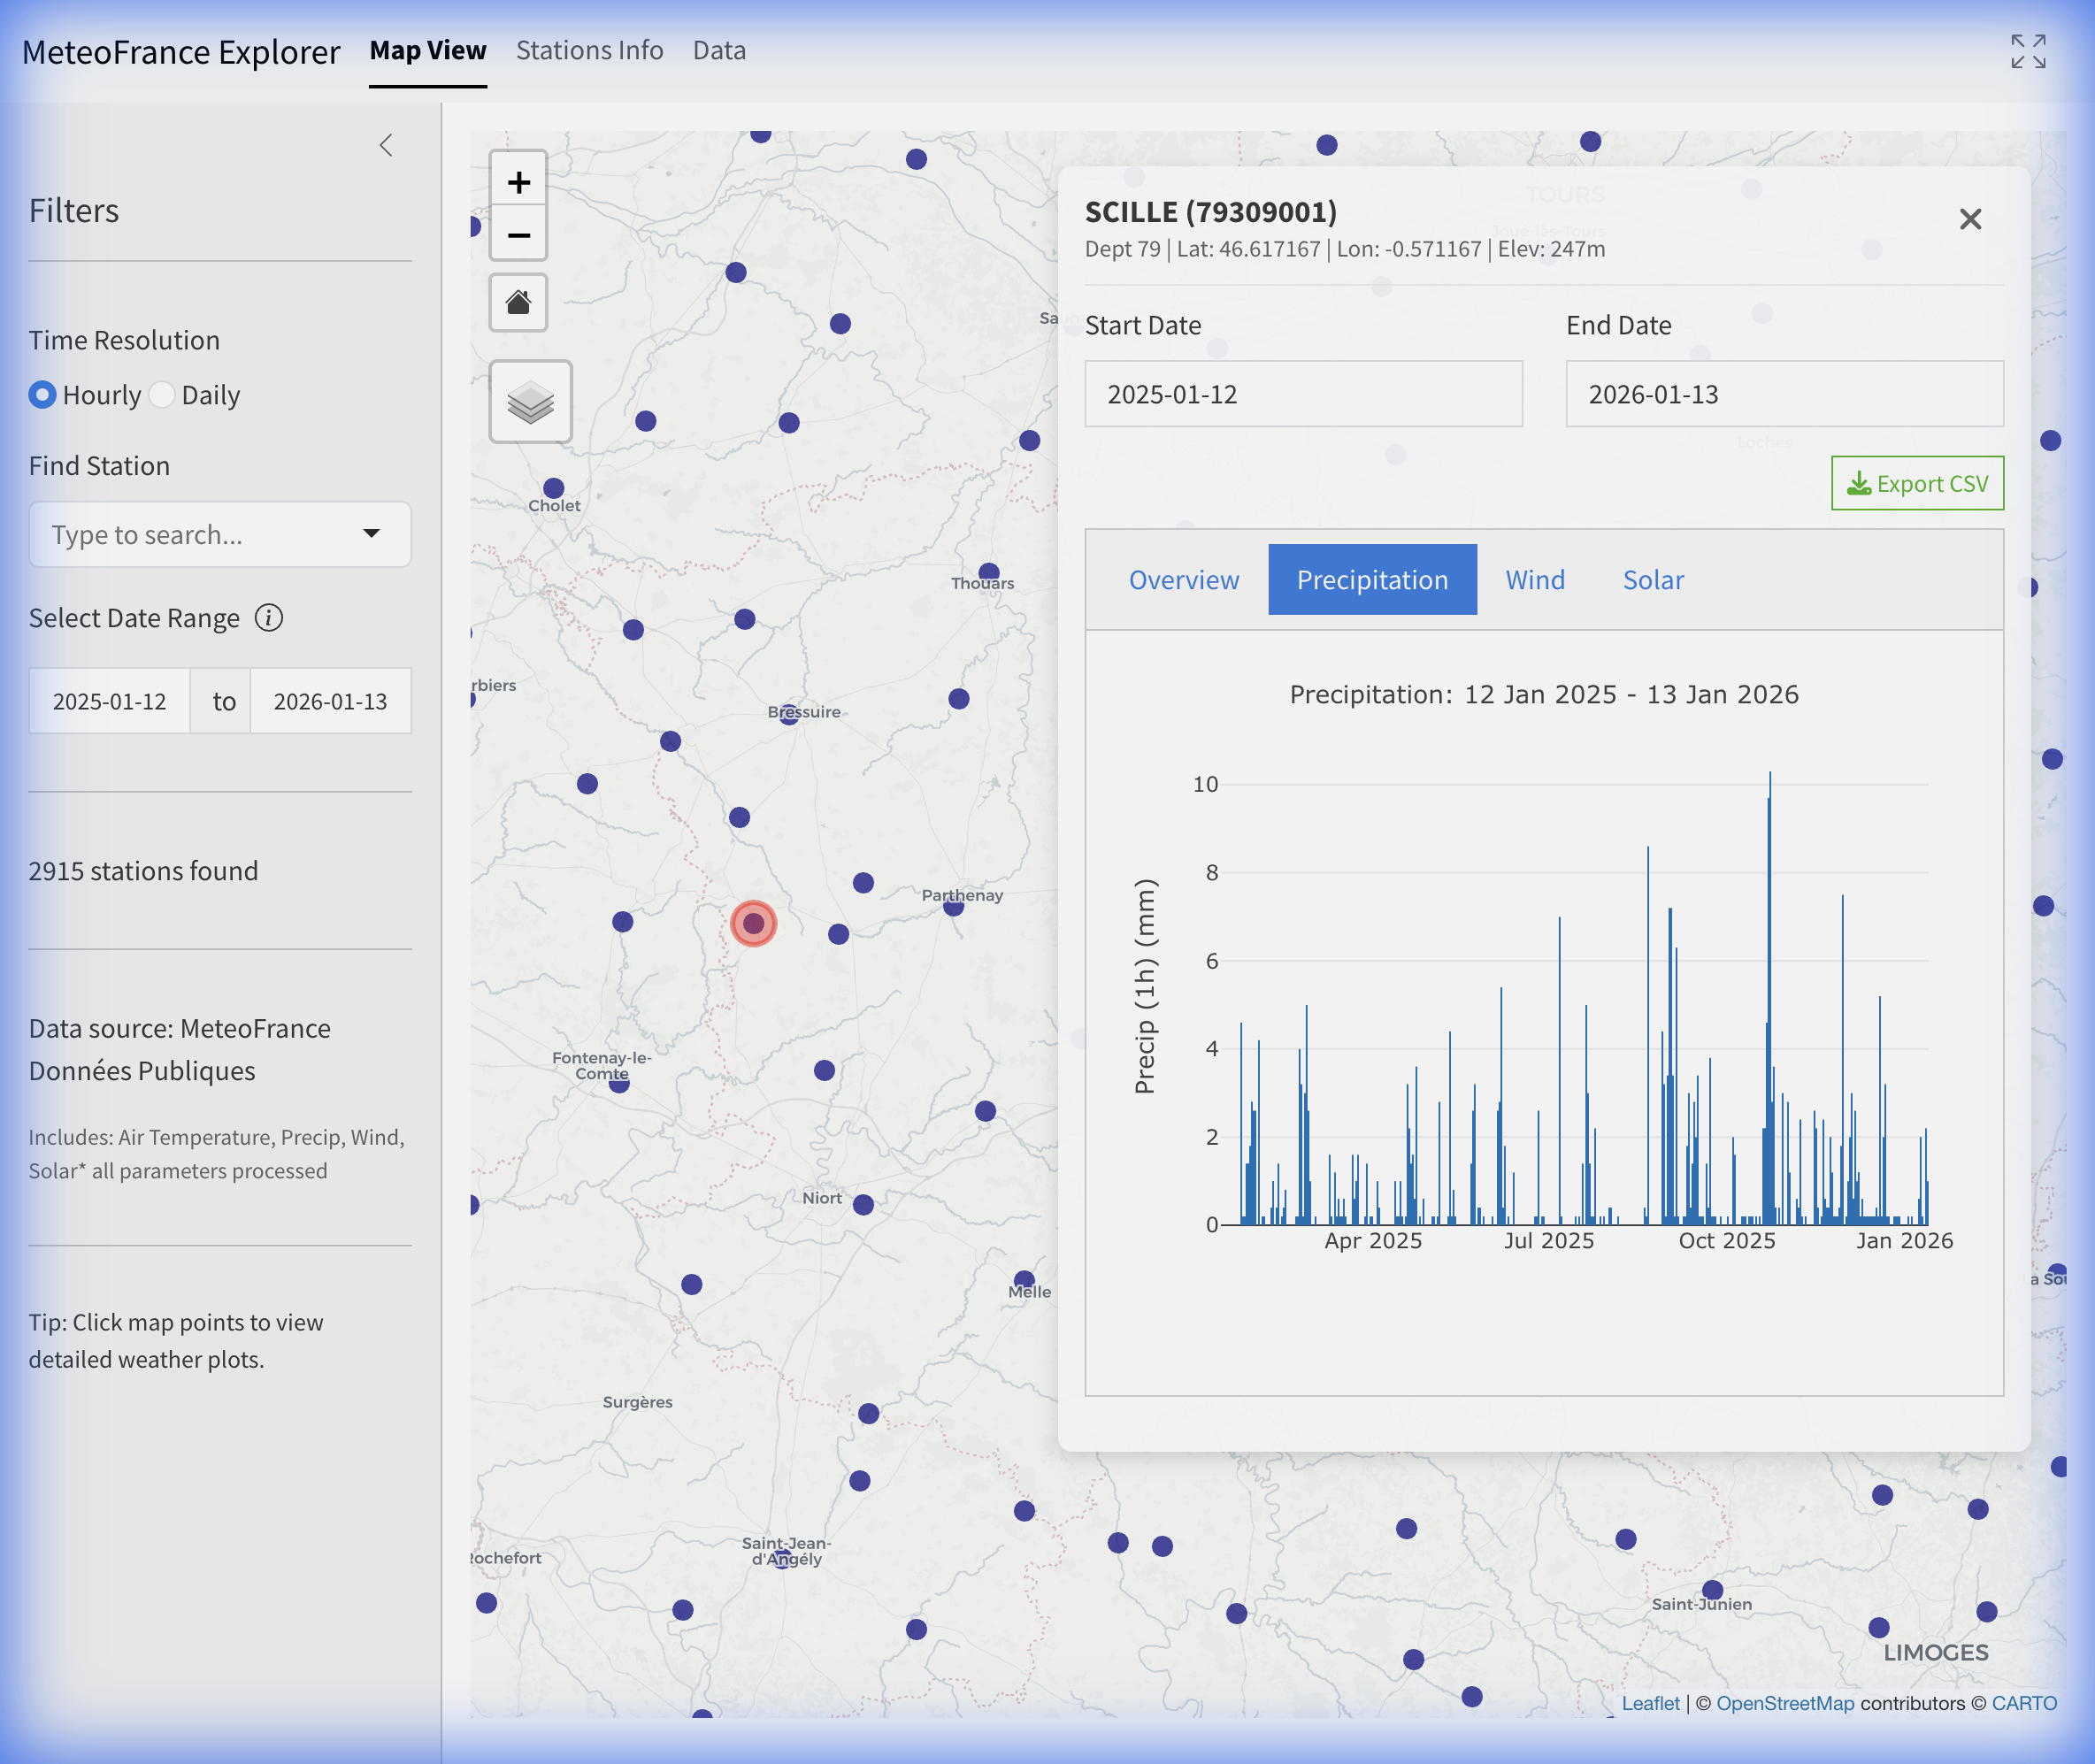
- Precipitation: Detailed precipitation accumulation charts.
- Wind: A Wind Rose diagram showing the frequency distribution of wind speed and direction.
- Data: Provides raw data access for the selected station.
- The data table respects the selected Time Resolution (6-Minute, Hourly, Daily, or Monthly).
- Parameter definitions are displayed above the table.
- Use the Export CSV button in the header to download the data.
5. Parameter Reference
The following tables list the parameters available in the Météo-France Explorer for each resolution. These parameters correspond to the column names in the exported CSV files.
6-Minute Parameters
| Column Name | Definition | Unit |
|---|---|---|
datetime |
Observation Timestamp | UTC |
station_id |
Station Identifier | — |
temp |
Air Temperature (2m) | °C |
rh |
Relative Humidity | % |
precip |
Precipitation (6min) | mm |
wind_speed |
Wind Speed (10m) | m/s |
wind_dir |
Wind Direction | degrees |
wind_gust |
Maximum Wind Gust | m/s |
pressure |
Air Pressure | hPa |
pressure_sea |
Pressure (Sea Level) | hPa |
pressure_station |
Pressure (Station Level) | hPa |
Hourly Parameters
| Column Name | Definition | Unit |
|---|---|---|
datetime |
Observation Timestamp | UTC |
station_id |
Station Identifier | — |
temp |
Air Temperature (2m) | °C |
rh |
Relative Humidity | % |
precip |
Precipitation (1h) | mm |
wind_speed |
Wind Speed (10m) | m/s |
wind_speed_2m |
Wind Speed (2m) | m/s |
wind_dir |
Wind Direction | degrees |
wind_gust |
Maximum Wind Gust | m/s |
wind_gust_inst |
Instantaneous Wind Gust | m/s |
wind_gust_3s |
3-Second Wind Gust | m/s |
pressure |
Air Pressure | hPa |
pressure_sea |
Pressure (Sea Level) | hPa |
pressure_station |
Pressure (Station Level) | hPa |
cloud_cover |
Total Cloud Cover | octas (0-8) |
solar_global |
Global Radiation | J/cm² |
solar_diffuse |
Diffuse Radiation | J/cm² |
solar_direct |
Direct Radiation | J/cm² |
solar_infrared |
Infrared Radiation | J/cm² |
sunshine_duration |
Sunshine Duration | min |
uv_index |
UV Index | — |
visibility |
Minimum Visibility | m |
Daily Parameters
| Column Name | Definition | Unit |
|---|---|---|
datetime |
Observation Timestamp | UTC |
station_id |
Station Identifier | — |
temp |
Mean Air Temperature | °C |
temp_min |
Minimum Air Temperature | °C |
temp_max |
Maximum Air Temperature | °C |
temp_min_abs |
Absolute Minimum Temperature | °C |
temp_max_abs |
Absolute Maximum Temperature | °C |
temp_min_ground |
Minimum Ground Temperature | °C |
temp_min_50cm |
Minimum Temperature at 50cm | °C |
rh |
Mean Relative Humidity | % |
rh_min |
Minimum Relative Humidity | % |
rh_max |
Maximum Relative Humidity | % |
precip |
Total Precipitation | mm |
precip_duration |
Precipitation Duration | min |
wind_speed |
Mean Wind Speed | m/s |
wind_dir |
Dominant Wind Direction | degrees |
wind_gust |
Maximum Wind Gust | m/s |
pressure |
Mean Pressure | hPa |
pressure_sea |
Pressure (Sea Level) | hPa |
pressure_station |
Pressure (Station Level) | hPa |
cloud_cover |
Mean Cloud Cover | octas |
solar_global |
Global Radiation | J/cm² |
sunshine_duration |
Total Sunshine Duration | hours |
snow_fresh |
Fresh Snow | cm |
snow_depth |
Total Snow Depth | cm |
etp |
Evapotranspiration | mm |
visibility |
Minimum Visibility | m |
fog |
Fog Indicator | boolean |
mist |
Mist Indicator | boolean |
thunder |
Thunderstorm Indicator | boolean |
lightning |
Lightning Indicator | boolean |
sleet |
Sleet Indicator | boolean |
hail |
Hail Indicator | boolean |
frost |
Frost Indicator | boolean |
dew |
Dew Indicator | boolean |
ice_glaze |
Ice Glaze Indicator | boolean |
smoke |
Smoke Indicator | boolean |
Monthly Parameters
| Column Name | Definition | Unit |
|---|---|---|
datetime |
Observation Timestamp | UTC |
station_id |
Station Identifier | — |
temp |
Mean Air Temperature | °C |
temp_min |
Mean Minimum Temperature | °C |
temp_max |
Mean Maximum Temperature | °C |
temp_min_abs |
Absolute Minimum Temperature | °C |
temp_max_abs |
Absolute Maximum Temperature | °C |
rh |
Mean Relative Humidity | % |
precip |
Total Precipitation | mm |
wind_speed |
Mean Wind Speed | m/s |
wind_gust |
Maximum Wind Gust | m/s |
pressure |
Mean Pressure | hPa |
cloud_cover |
Mean Cloud Cover | octas |
solar_global |
Total Global Radiation | J/cm² |
sunshine_duration |
Total Sunshine Duration | hours |
snow_fresh |
Total Fresh Snow | cm |
snow_depth |
Maximum Snow Depth | cm |
etp |
Total Evapotranspiration | mm |
days_frost |
Days with Frost (TN ≤ 0) | count |
days_ice |
Days with Ice (TX ≤ 0) | count |
days_thunder |
Days with Thunderstorm | count |
days_fog |
Days with Fog | count |
days_hail |
Days with Hail | count |
days_snow |
Days with Snowfall | count |
days_rain_1mm |
Days with Rain ≥ 1mm | count |
days_rain_5mm |
Days with Rain ≥ 5mm | count |
days_rain_10mm |
Days with Rain ≥ 10mm | count |
days_hot_25 |
Days with TX ≥ 25°C | count |
days_hot_30 |
Days with TX ≥ 30°C | count |
days_tropical_20 |
Tropical Nights (TN ≥ 20°C) | count |