JMA User Guide
Access the Application: Return to Explorer
1. Introduction
The JMA Explorer is an interactive dashboard for exploring historical and recent weather data from the Japan Meteorological Agency (JMA). It allows you to visualize meteorological records from stations across Japan, including AMeDAS (Automated Meteorological Data Acquisition System) and manned stations. Data is available in four resolutions: 10-Minute, Hourly, Daily, and Monthly.
1.1 Station Types
The explorer distinguishes between two main types of observation stations:
- Manned Stations (Synoptic): These are premium stations (historically staffed) that collect the most comprehensive data, including cloud cover, visibility, detailed weather codes, and humidity.
- AMeDAS (Automated Meteorological Data Acquisition System): A high-density network of automated stations. While they provide excellent coverage for core parameters like temperature, precipitation, and wind, they typically do not record visual observations like cloud cover or visibility.
3. Main Navigation Tabs
The application features three main tabs at the top:
Map View
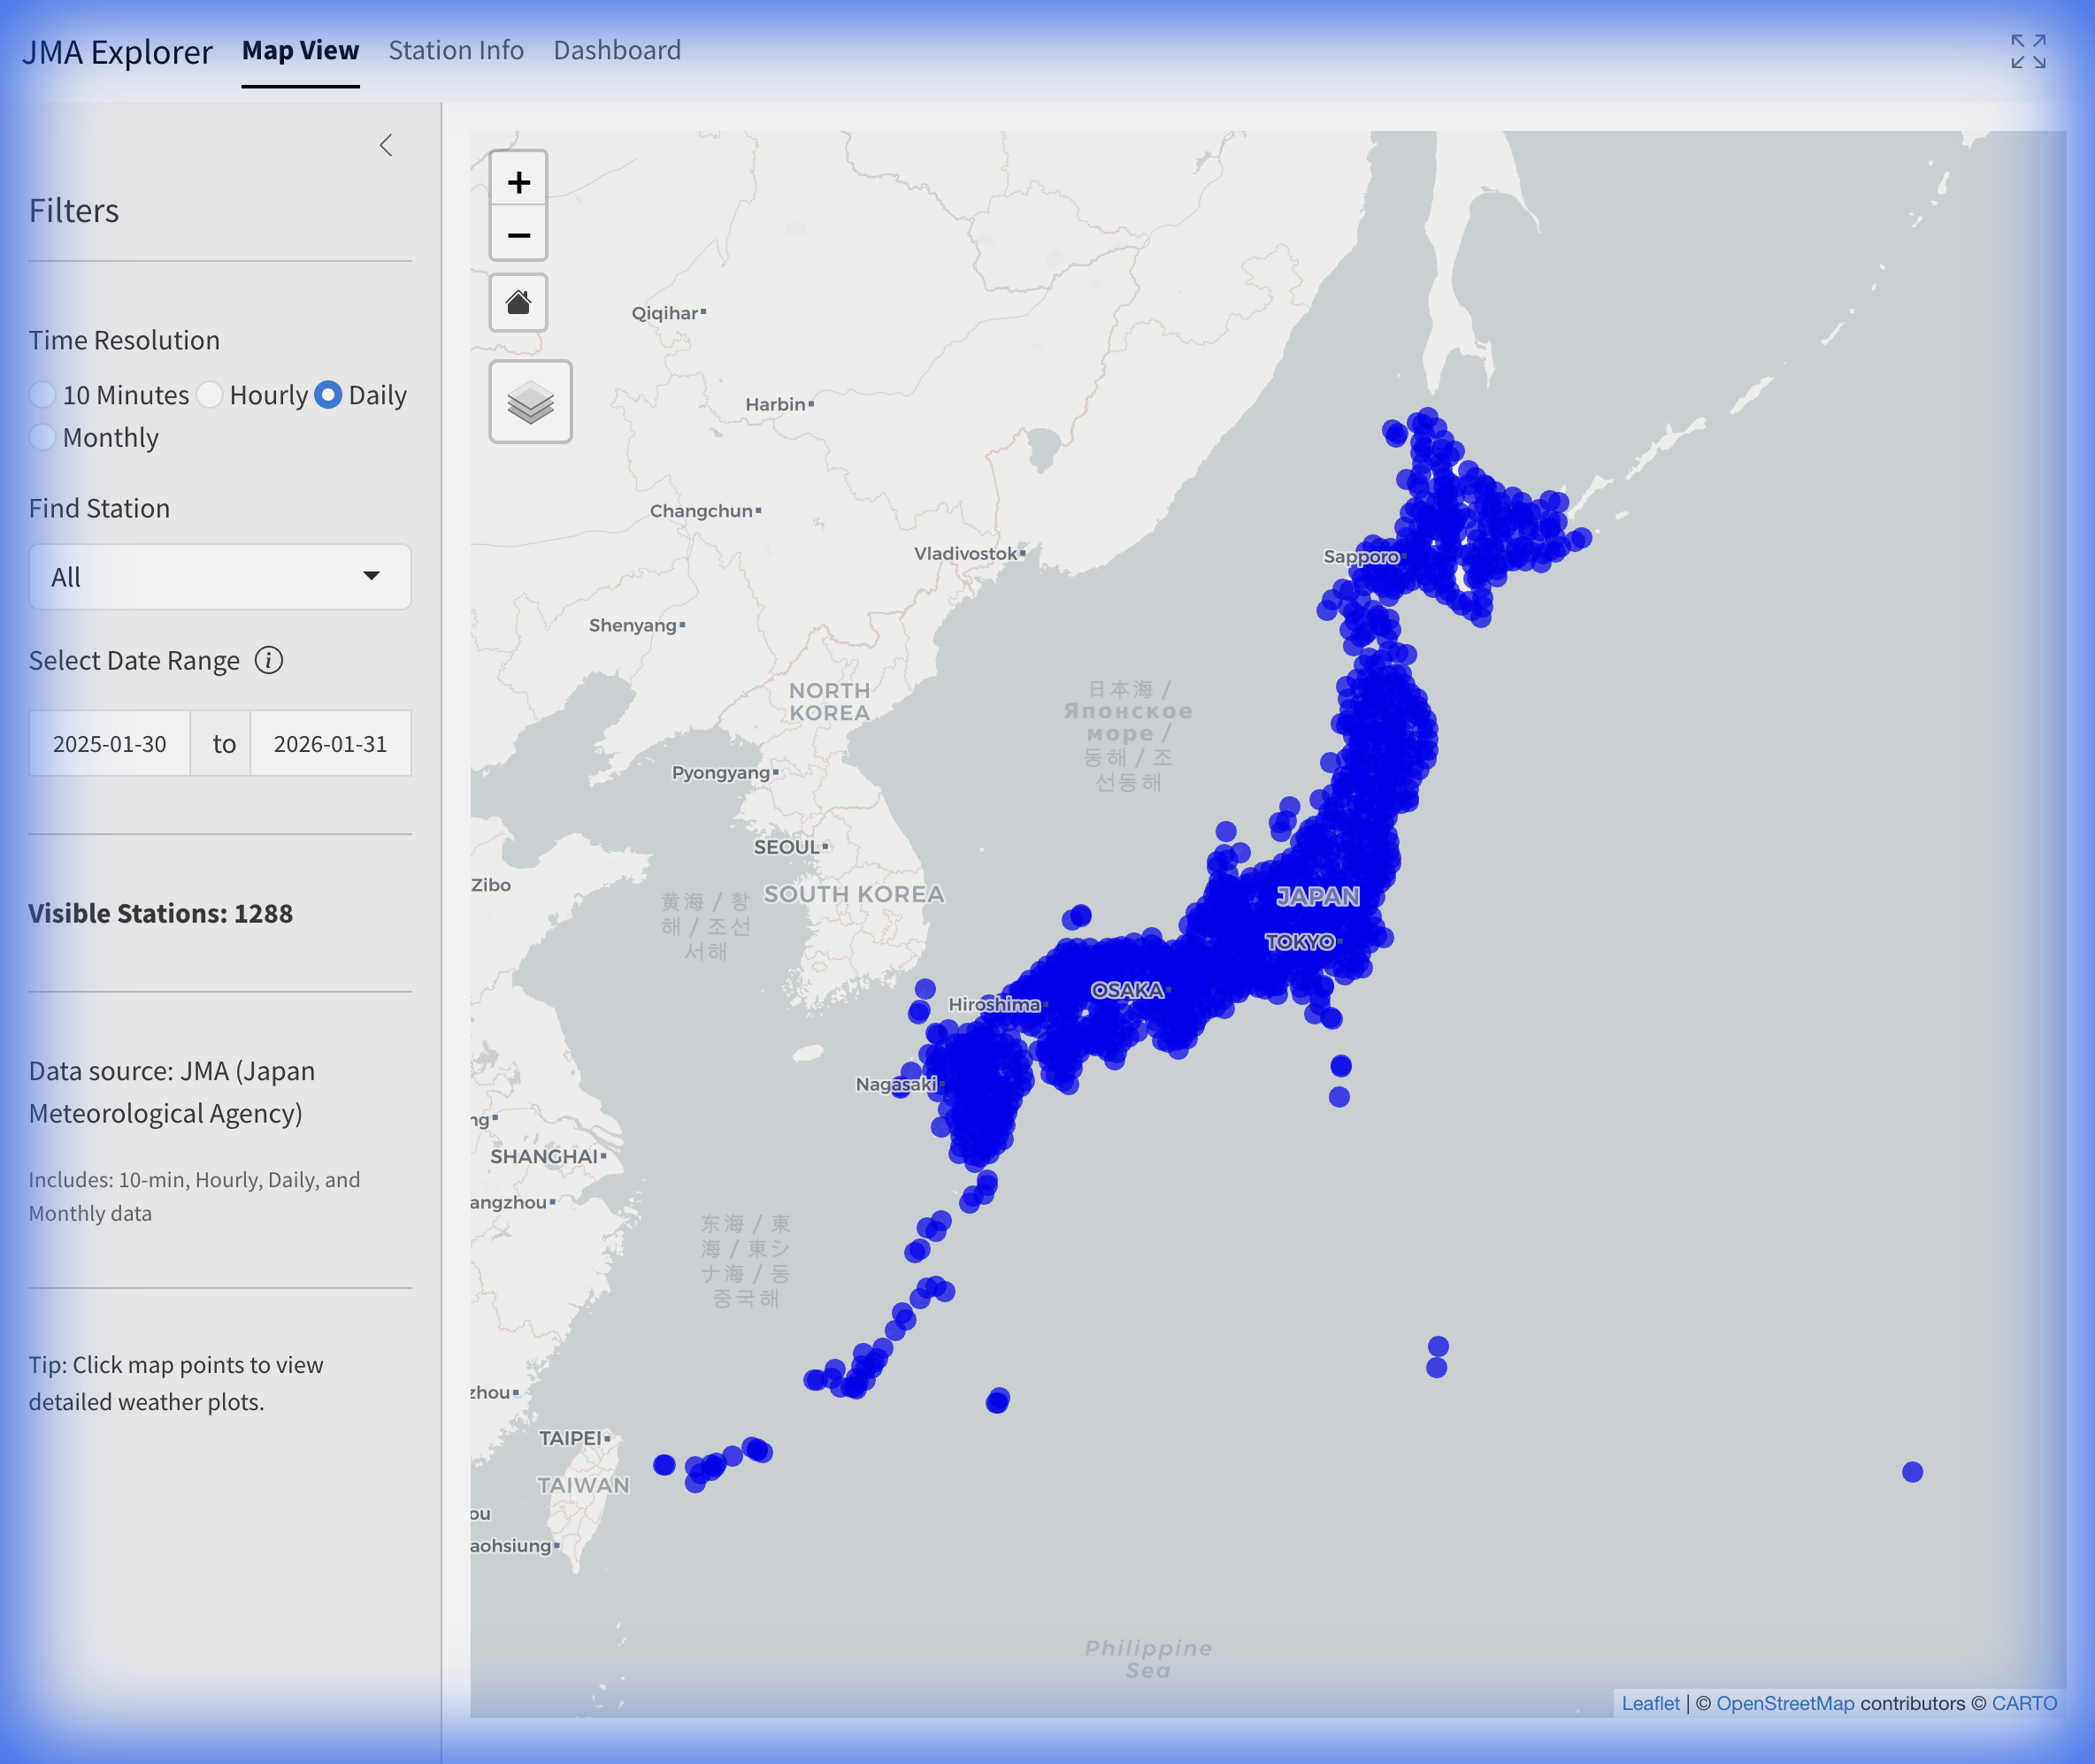
The default view is an interactive map showing available Japanese weather stations.
- Markers: Blue dots represent available stations.
- Selection: Click any marker to highlight the station (red ring) and view its summary.
- Popup Info: Display name, ID, Type (AMeDAS or Manned), and period of record.
- Home Button: A “Home” icon is overlaid on the map to reset the view to the Japan archipelago.
Station Info
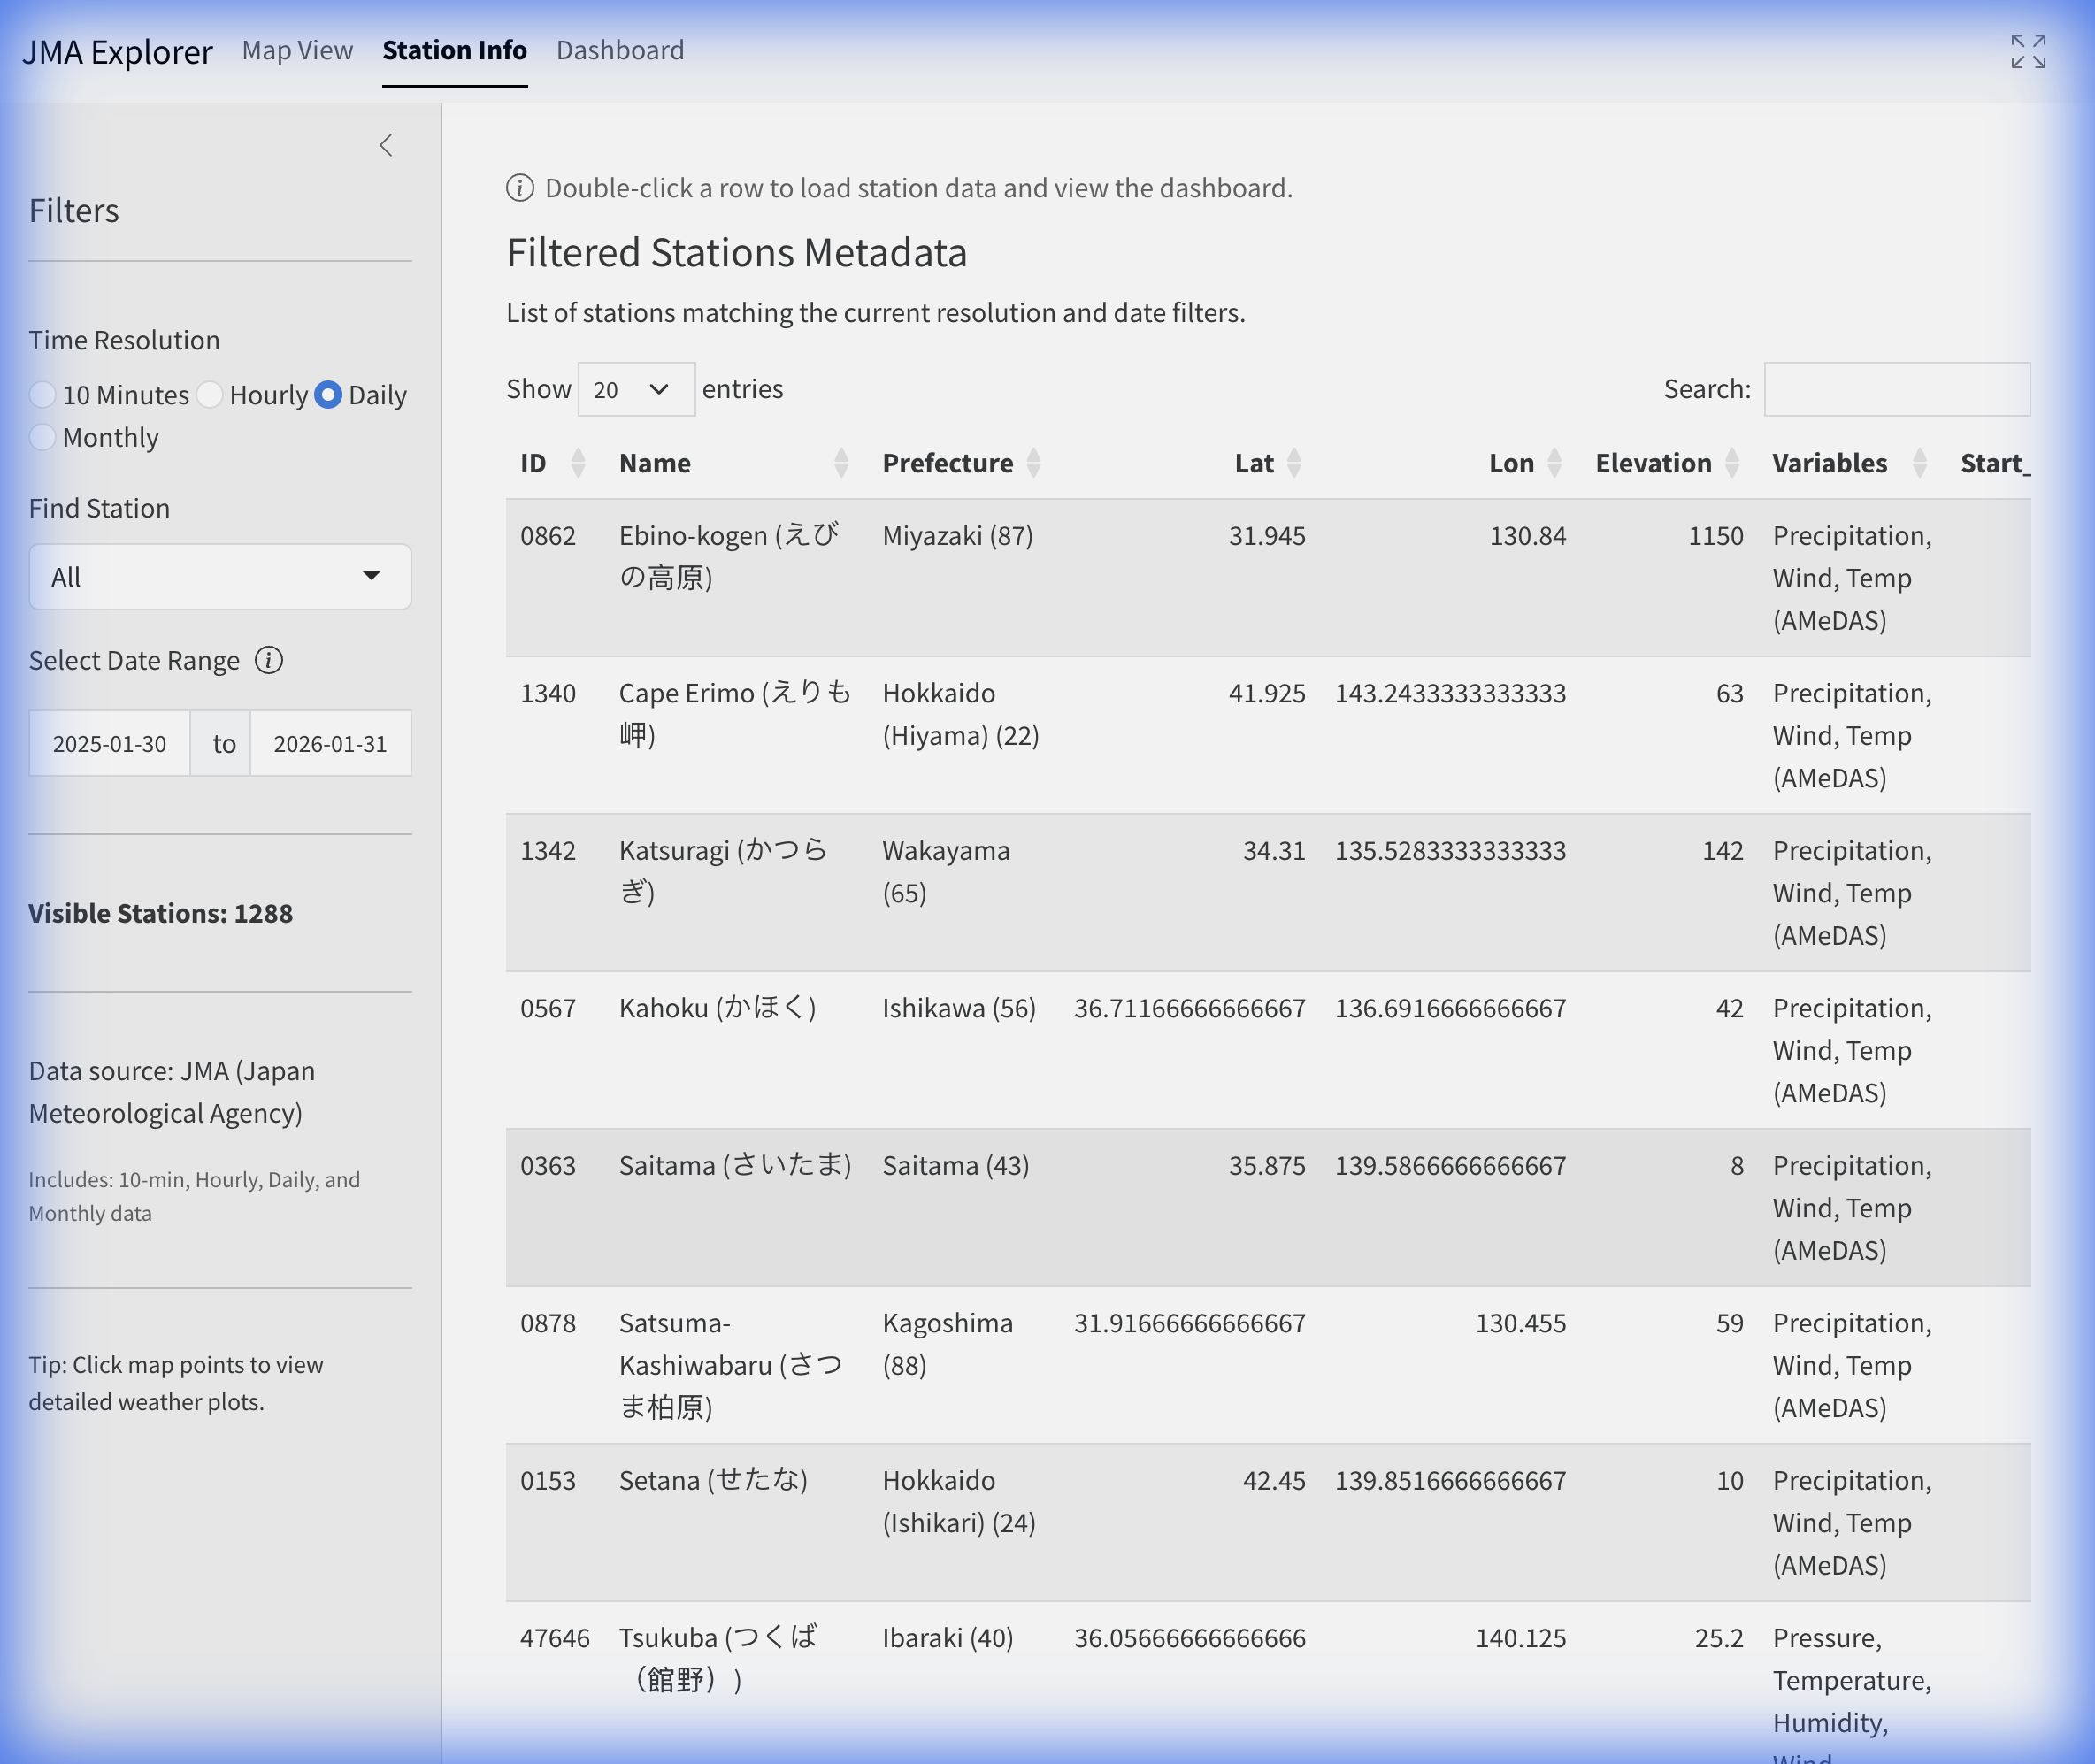
A tabular listing of all filtered stations. This view is useful for browsing the full station catalog or filtering by specific attributes.
- Double-Click: Double-click any row to load that station’s data and navigate directly to the Dashboard.
Dashboard
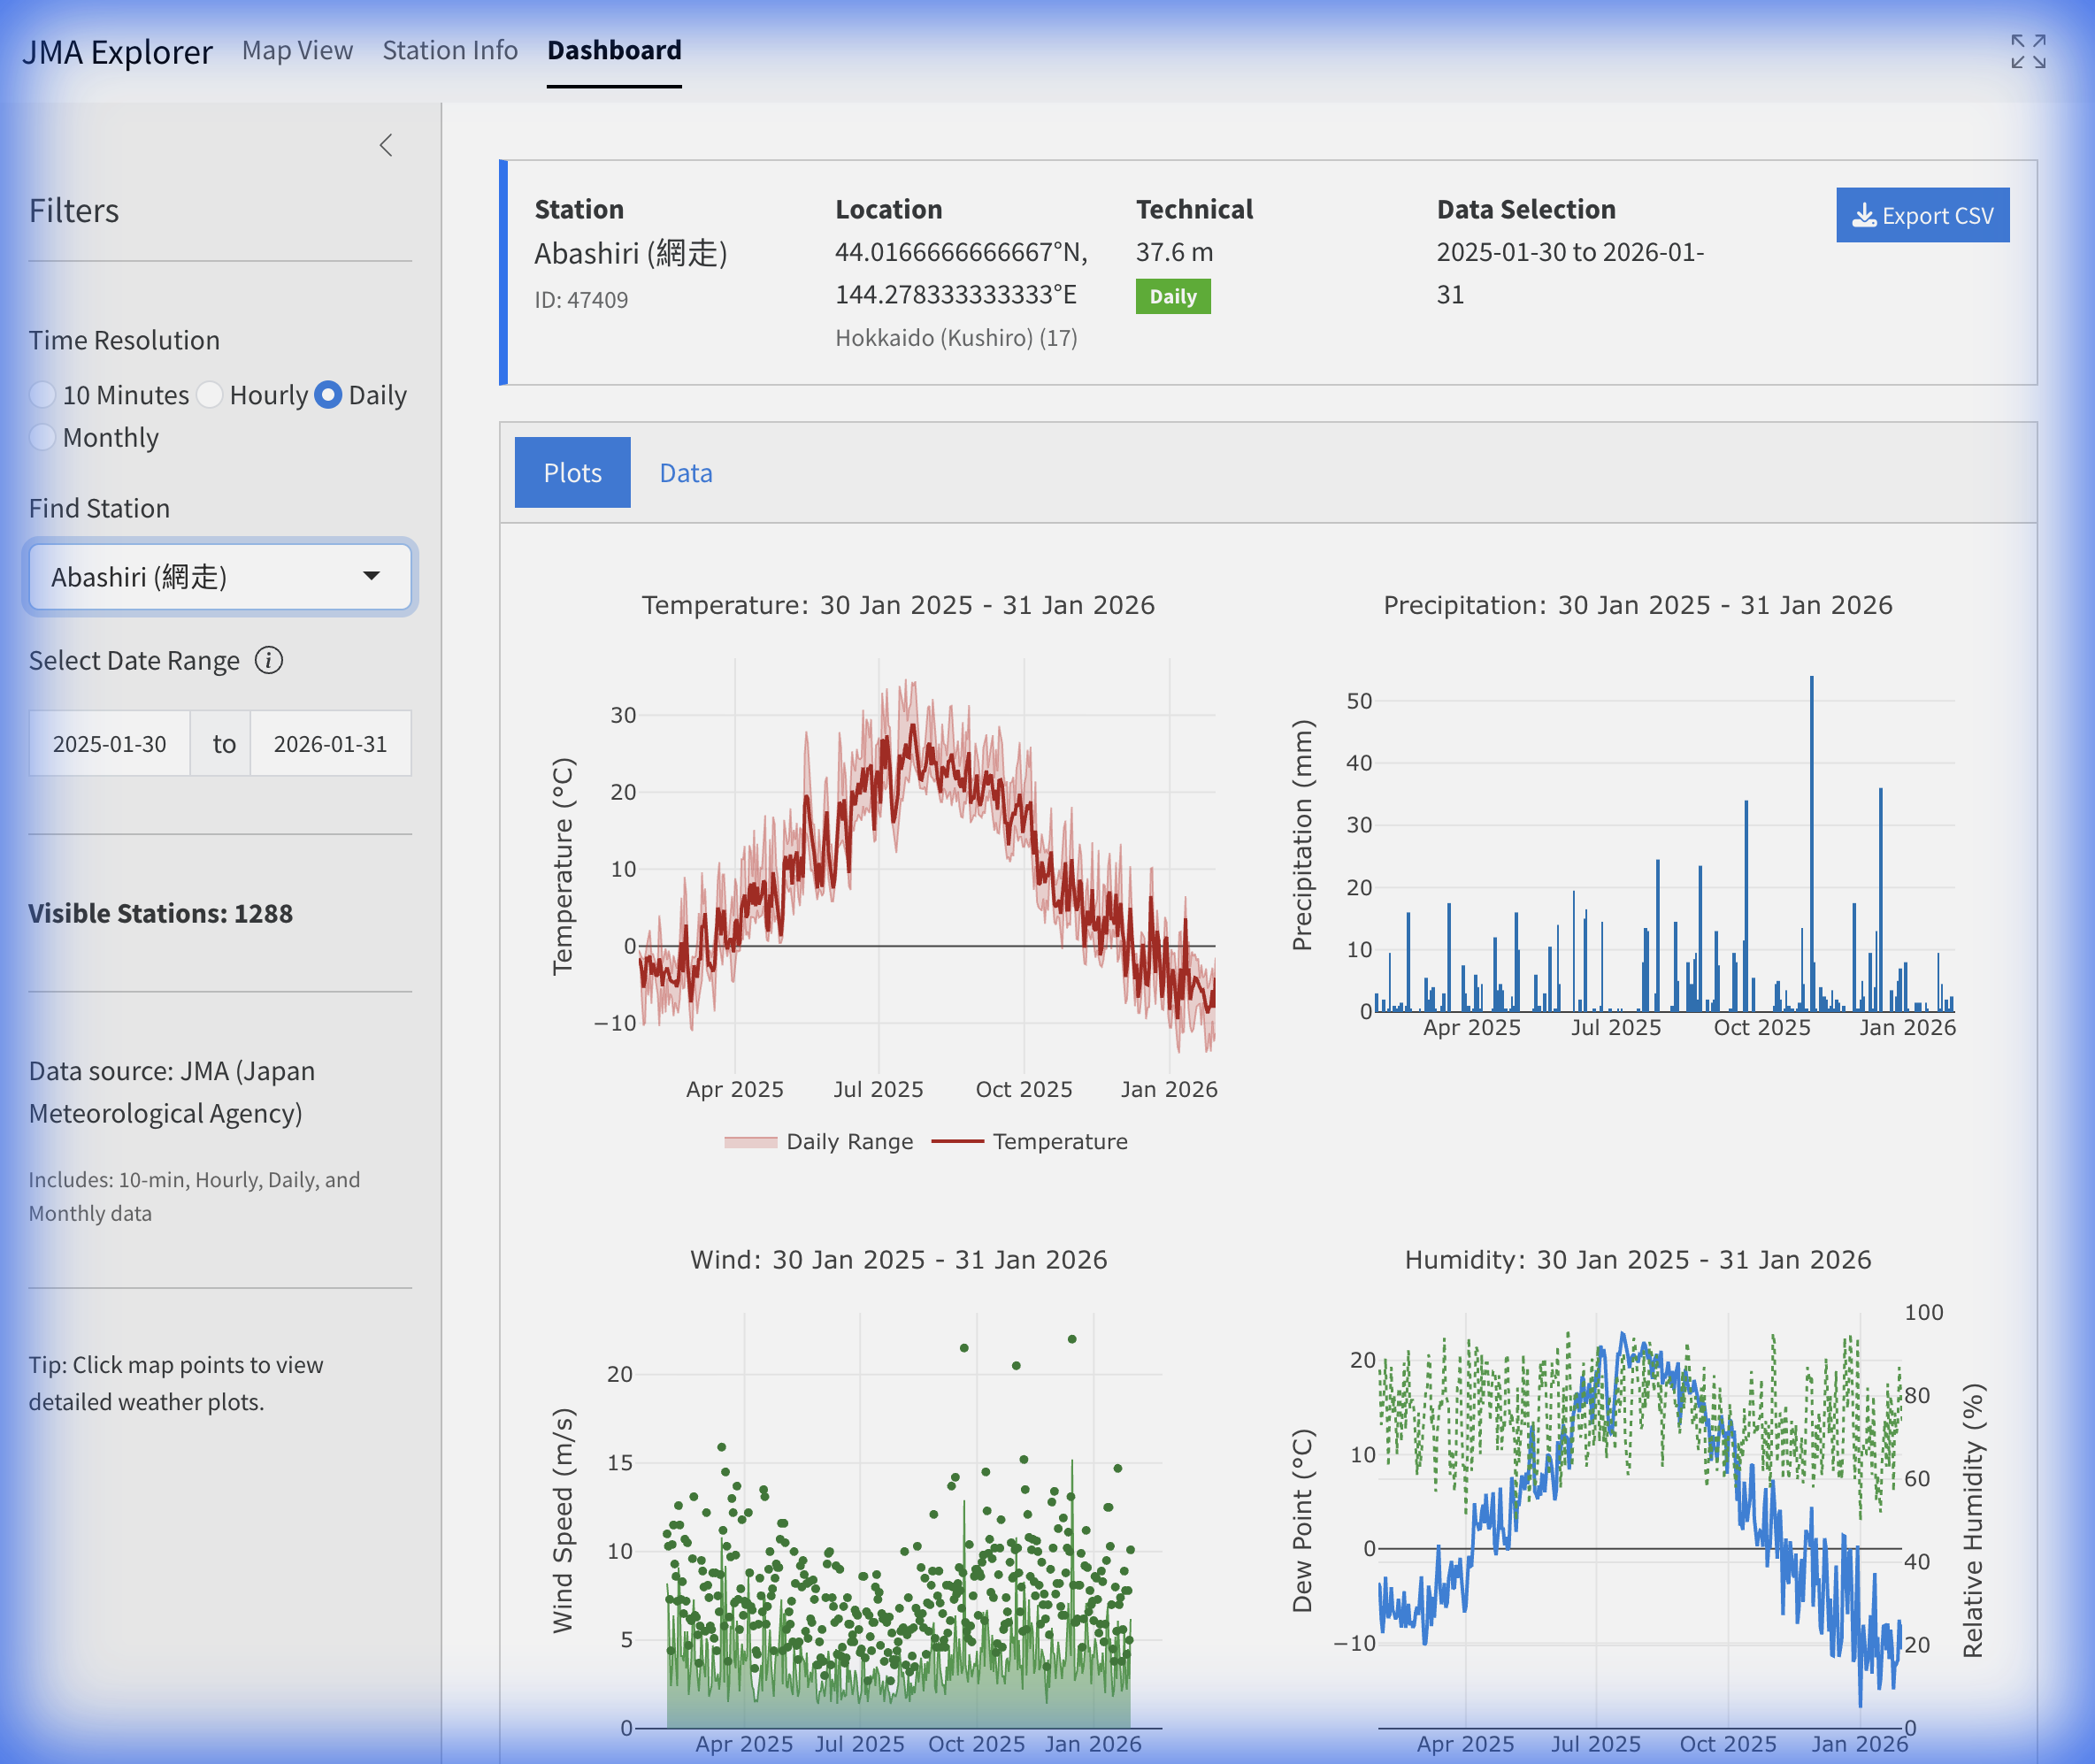
The Dashboard displays detailed data for a selected station. It becomes active after selecting a station from the map or table.
Dashboard Sub-Tabs
Plots: Specialized visualization tabs for different weather parameters:
- Temperature: Timeline of Mean, Max, and Min temperatures.
- Precipitation: Bar charts of precipitation accumulation.
- Wind: Wind speed timeline and Wind Rose (for Hourly data).
- Solar/Clouds: Solar radiation, Sunshine duration, and Cloud cover (where available).
- Humidity/Pressure: Relative Humidity and Pressure trends.
- Snow: Snowfall and Snow Depth (where available).
Data: Provides raw data access for the selected station and period.
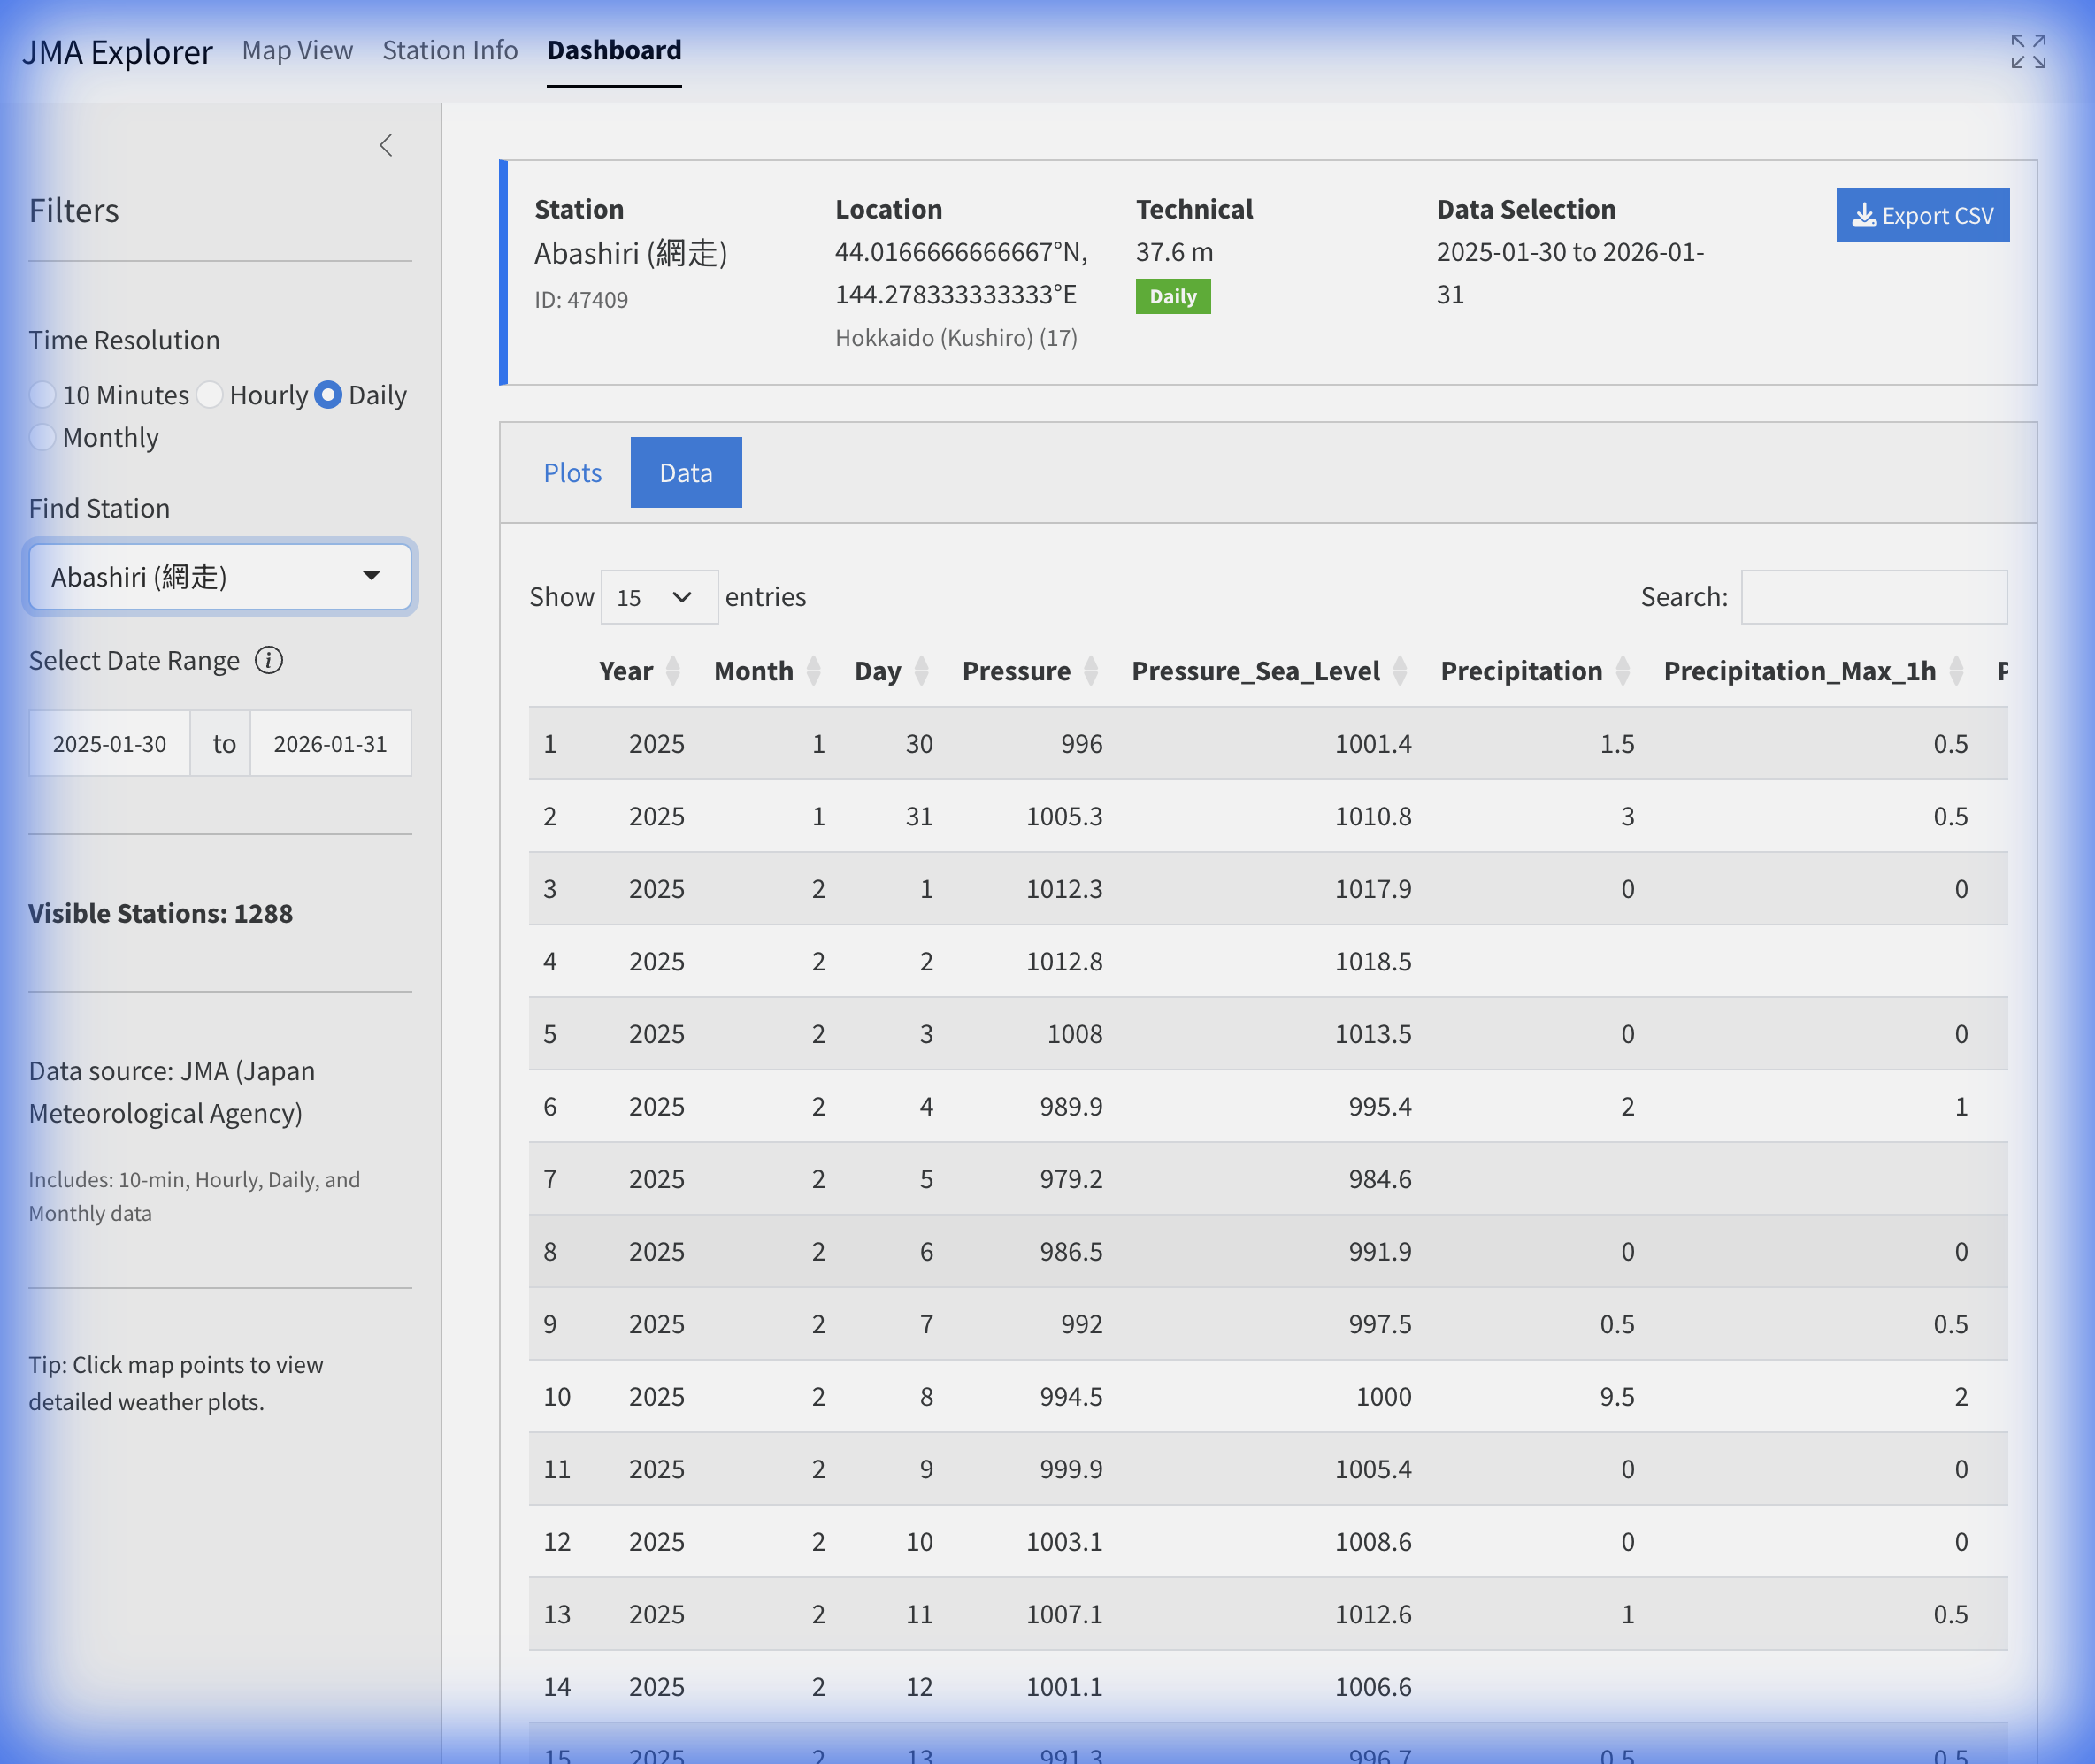
Dashboard Data - The table displays the parsed data ready for export.
- Export CSV: Use the download buttons to save the currently loaded dataset.
4. Parameter Reference
The following tables list the parameters available in the JMA Explorer for each resolution. Note that not all stations measure all parameters.
10-Minute & Hourly Parameters
[!NOTE] All timestamps for 10-Minute and Hourly resolutions are in Japan Standard Time (JST), which is UTC+9.
| Column Name | Definition | Unit |
|---|---|---|
Year, Month, Day |
Date Components | - |
Hour |
Hour of Observation | 1-24 |
Time |
Time of Observation (10-min resolution) | HH:MM |
Temperature |
Air Temperature | °C |
Precipitation |
Precipitation Amount | mm |
Wind_Speed |
Mean Wind Speed | m/s |
Wind_Direction |
Wind Direction | 16-point Compass / Degrees |
Wind_Direction_Deg |
Wind Direction | Degrees (0-360) |
Sunshine_Minutes |
Sunshine Duration (10-min) | min |
Sunshine_Hours |
Sunshine Duration (Hourly) | hours |
Pressure |
Station Level Pressure | hPa |
Pressure_Sea_Level |
Sea Level Pressure | hPa |
Humidity |
Relative Humidity | % |
Dew_Point |
Dew Point Temperature | °C |
Vapor_Pressure |
Vapor Pressure | hPa |
Solar_Radiation |
Global Solar Radiation | MJ/m² |
Cloud_Cover |
Cloud Cover (0-10) | 1/10 |
Visibility |
Visibility | km |
Snowfall |
Snowfall Amount | cm |
Snow_Depth |
Snow Depth | cm |
Daily Parameters
| Column Name | Definition | Unit |
|---|---|---|
Year, Month, Day |
Date Components | - |
Temp_Mean |
Daily Mean Temperature | °C |
Temp_Max |
Daily Maximum Temperature | °C |
Temp_Min |
Daily Minimum Temperature | °C |
Precipitation |
Total Precipitation | mm |
Precipitation_Max_1h |
Max 1-Hour Precipitation | mm |
Precipitation_Max_10min |
Max 10-Minute Precipitation | mm |
Wind_Speed |
Mean Wind Speed | m/s |
Wind_Max_Speed |
Maximum Wind Speed | m/s |
Wind_Gust_Speed |
Maximum Gust Speed | m/s |
Humidity |
Mean Relative Humidity | % |
Humidity_Min |
Minimum Relative Humidity | % |
Pressure |
Mean Station Pressure | hPa |
Pressure_Sea_Level |
Mean Sea Level Pressure | hPa |
Sunshine_Hours |
Total Sunshine Duration | hours |
Snowfall |
Total Snowfall | cm |
Snow_Depth |
Maximum Snow Depth | cm |
Monthly Parameters
| Column Name | Definition | Unit |
|---|---|---|
Year, Month |
Date Components | - |
Temp_Mean |
Monthly Mean Temperature | °C |
Temp_Max |
Monthly Mean Daily Maximum | °C |
Temp_Min |
Monthly Mean Daily Minimum | °C |
Precipitation |
Total Precipitation | mm |
Wind_Speed |
Monthly Mean Wind Speed | m/s |
Wind_Speed_Max |
Maximum Wind Speed | m/s |
Pressure |
Monthly Mean Station Pressure | hPa |
Pressure_Sea_Level |
Monthly Mean Sea Level Pressure | hPa |
Humidity |
Monthly Mean Humidity | % |
Sunshine_Hours |
Total Sunshine Duration | hours |
Snowfall |
Total Snowfall | cm |
Snow_Depth |
Max Snow Depth | cm |
Snow_Days |
Number of Days with Snow | days |
Fog_Days |
Number of Days with Fog | days |
Thunder_Days |
Number of Days with Thunder | days |
5. Data Source
Original data is sourced from the Japan Meteorological Agency (JMA) website.
- Source URL: JMA Historical Weather Data Search
- Note: The application dynamically scrapes and parses these tables to provide a unified dataset.