IMGW User Guide
Access the Application: Return to Explorer
1. Introduction
The IMGW Explorer is an interactive dashboard for exploring historical and recent weather data from the Polish Institute of Meteorology and Water Management (IMGW-PIB). It allows you to visualize meteorological records from synoptic and climatological stations across Poland. Data is available in three resolutions: Hourly, Daily, and Monthly.
1.1 Station Types
The explorer includes two main types of observation stations:
- Synoptic Stations: Premium stations that collect the most comprehensive data, including detailed wind observations, cloud cover, visibility, weather codes, and atmospheric pressure.
- Climatological Stations: A broader network that provides core parameters like temperature, precipitation, and snow measurements, with varying levels of instrumentation.
3. Main Navigation Tabs
The application features three main tabs at the top:
Map View
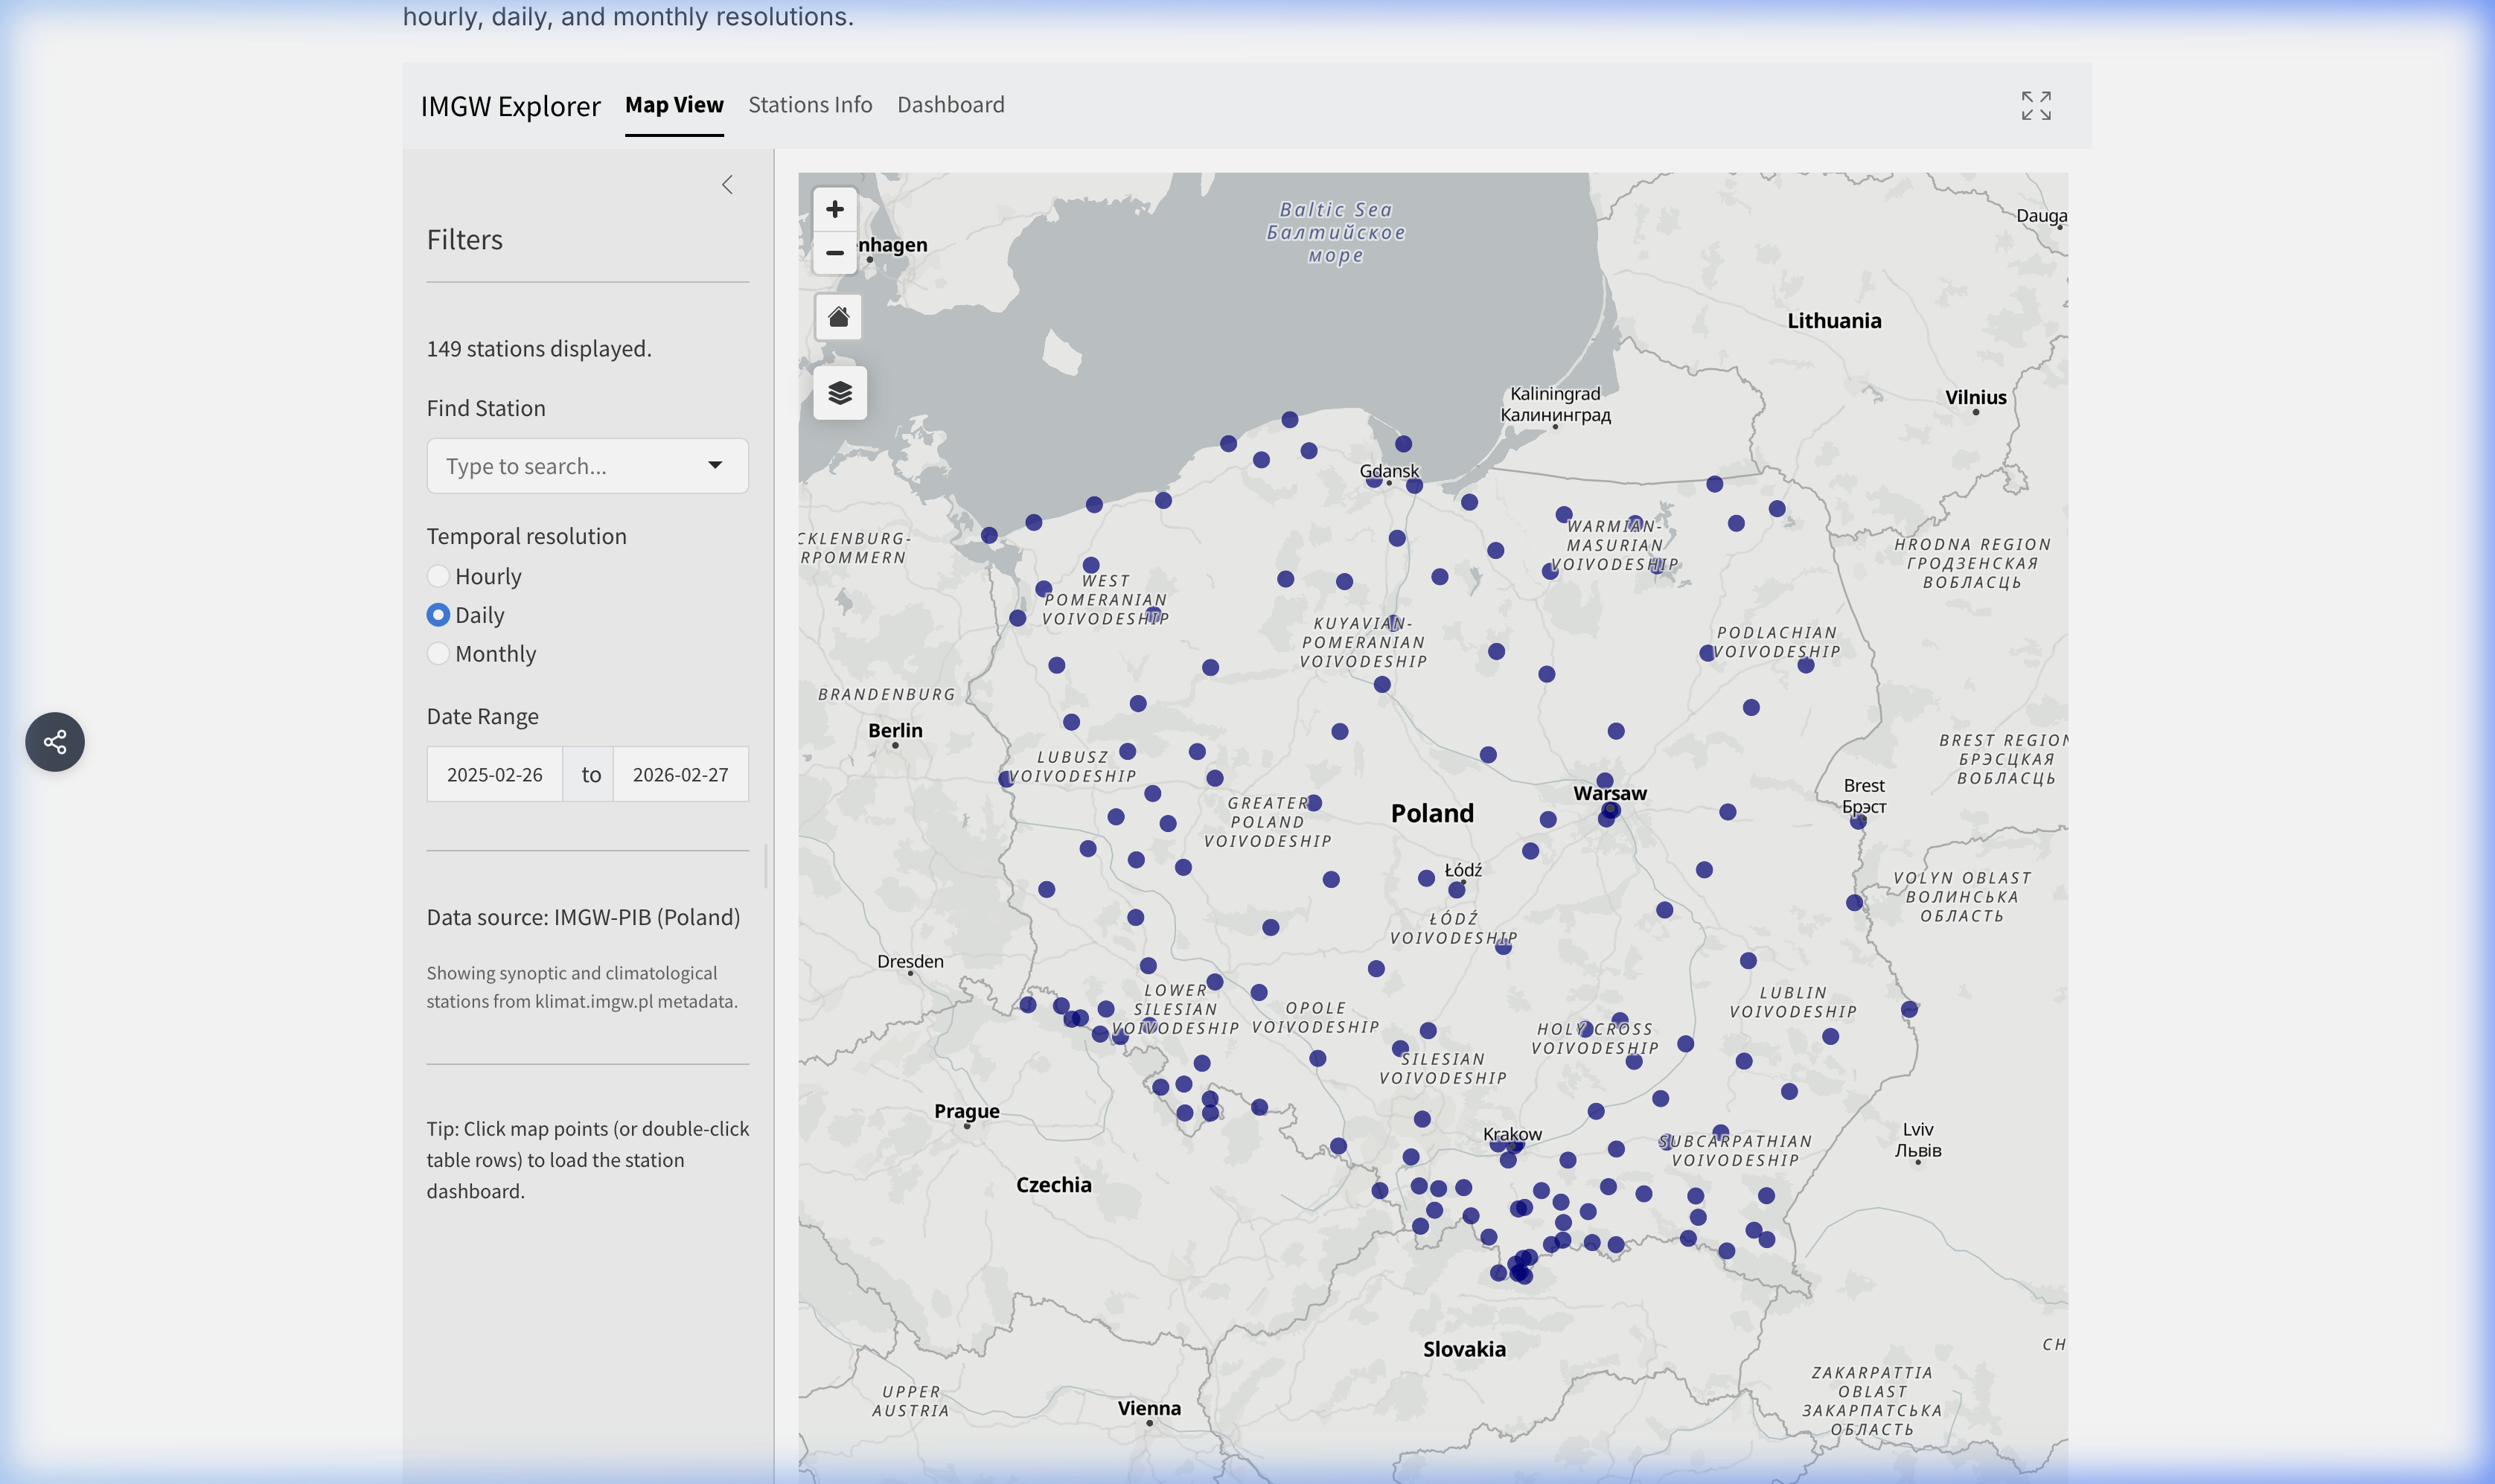
The default view is an interactive map showing available IMGW weather stations across Poland.
- Markers: Blue dots represent available stations.
- Selection: Click any marker to highlight the station and view its summary popup.
- Home Button: A “Home” icon resets the view to the full extent of Poland.
- Layer Control: Switch between different basemaps (Positron, Bright, Satellite) and toggle labels on/off.
Stations Info
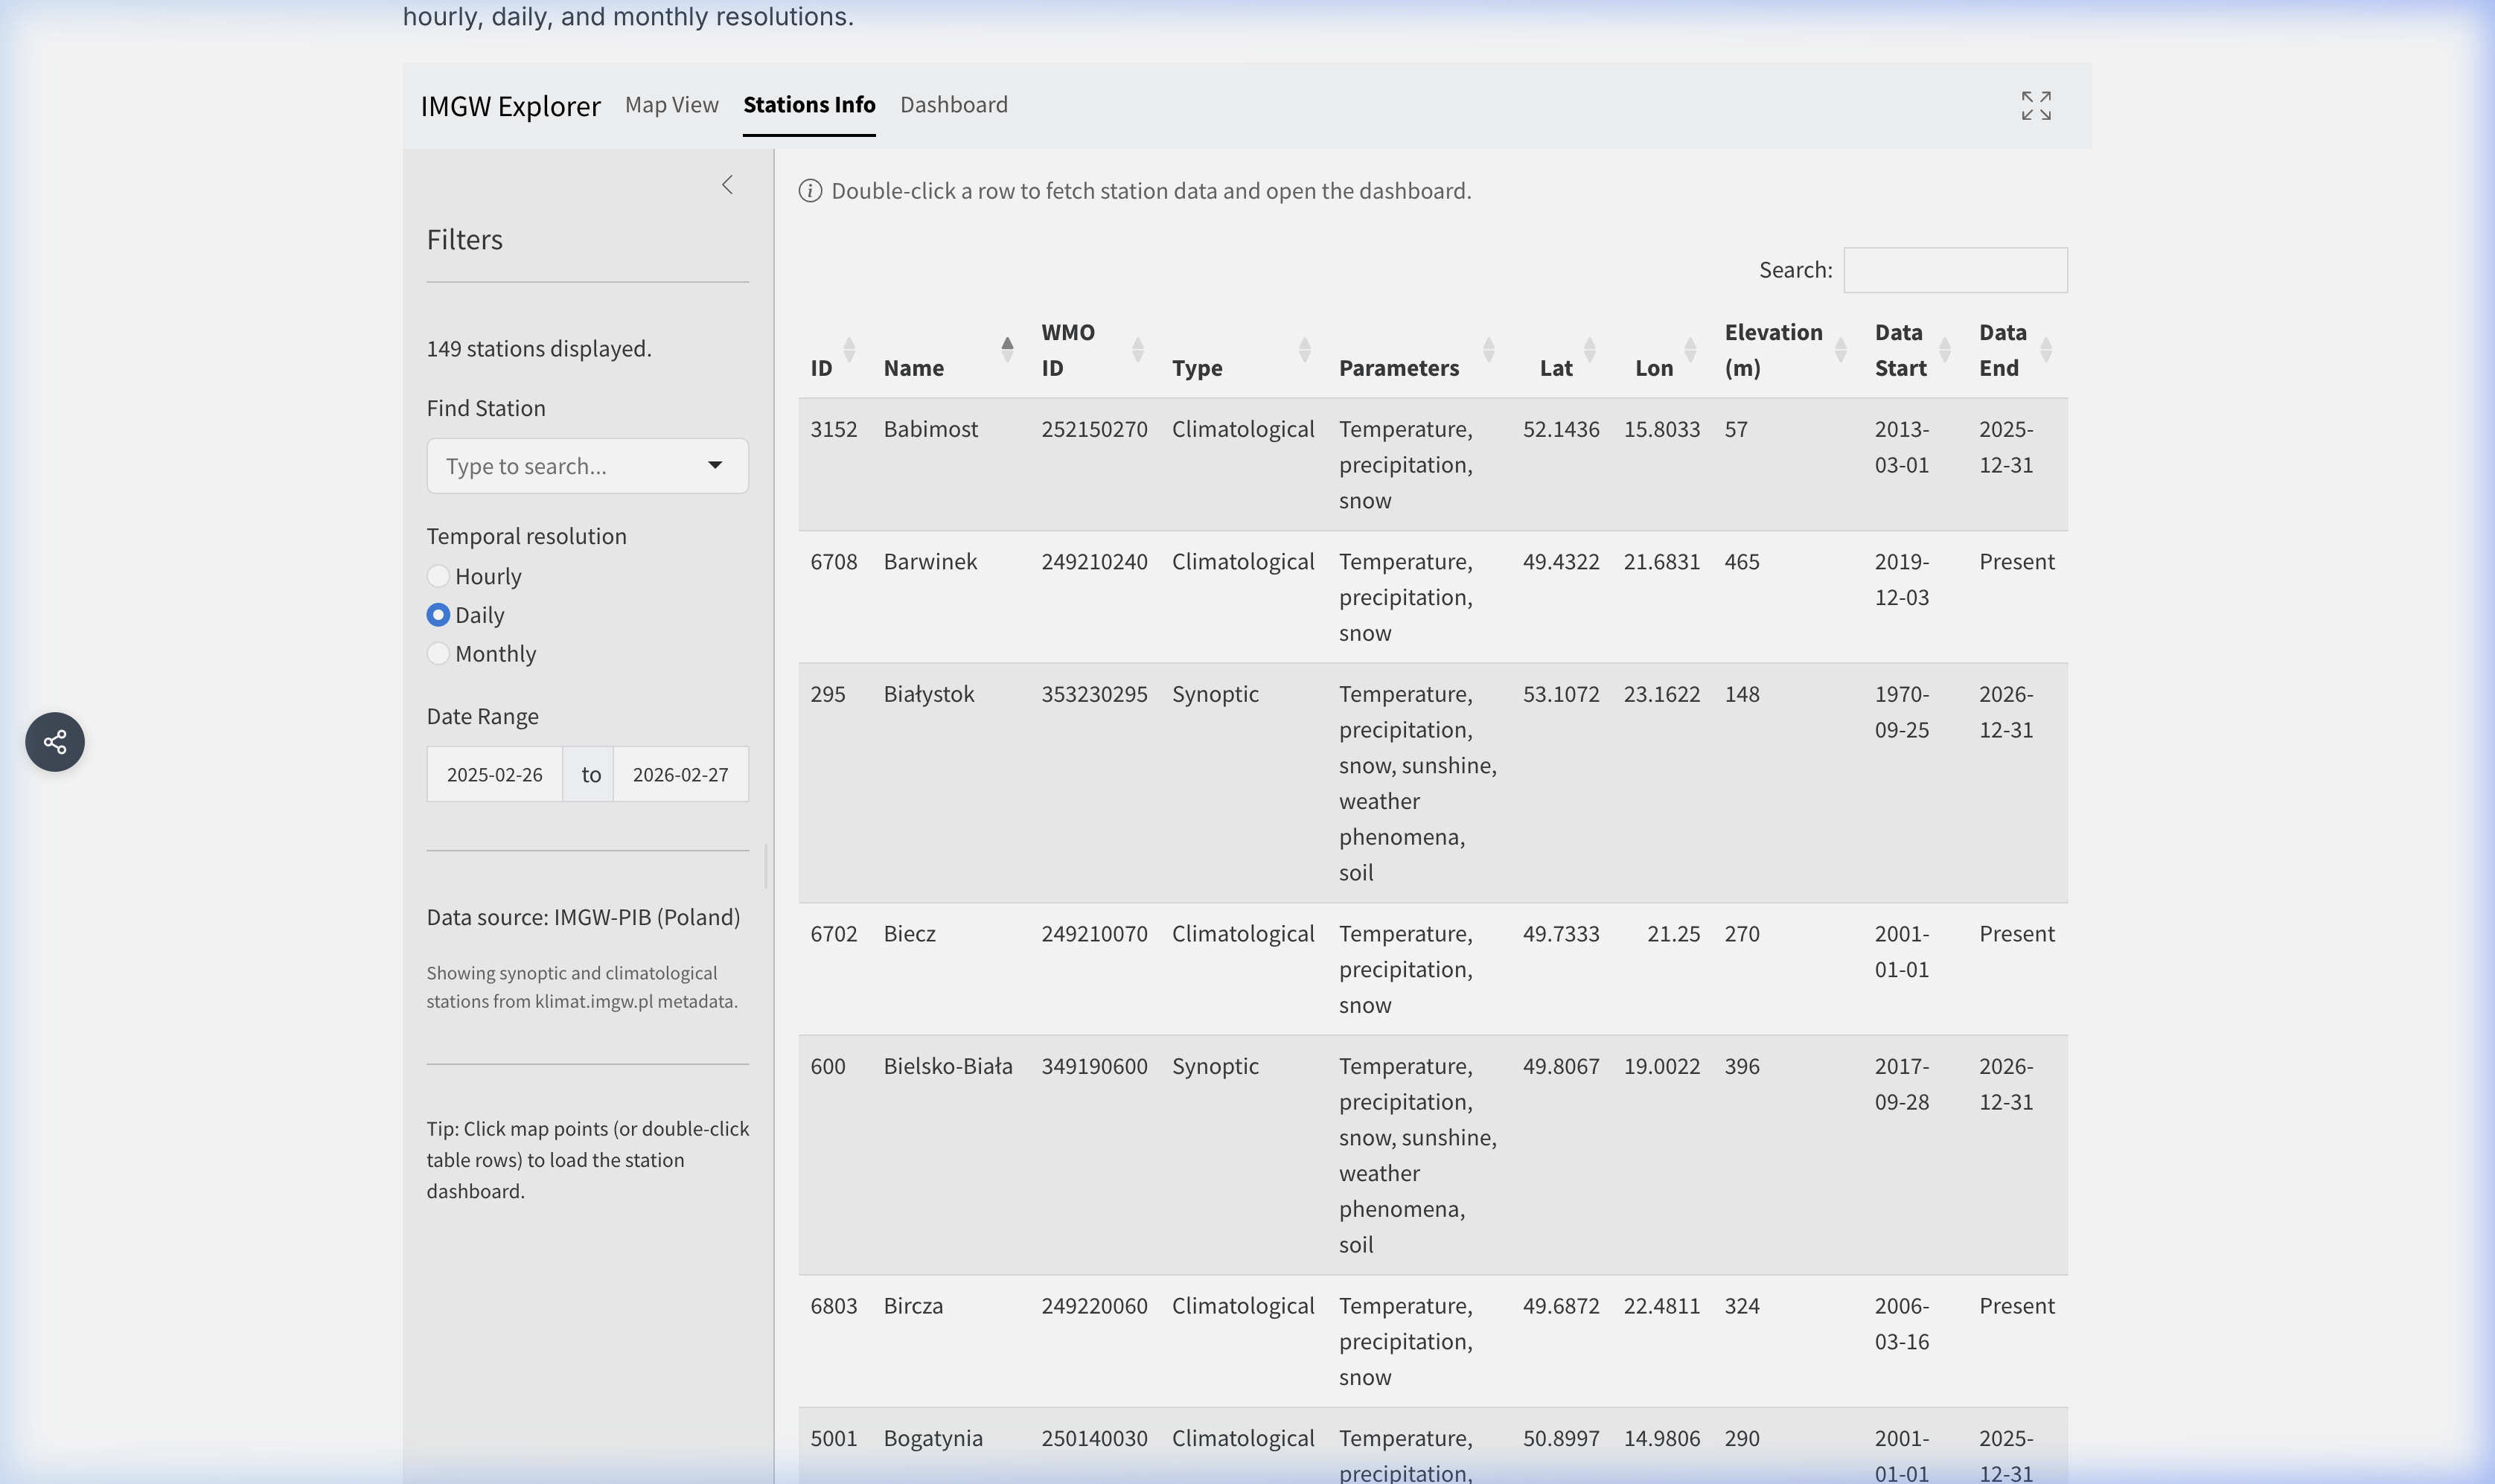
A tabular listing of all filtered stations. This view is useful for browsing the full station catalog.
- Double-Click: Double-click any row to fetch that station’s data and navigate directly to the Dashboard.
Dashboard
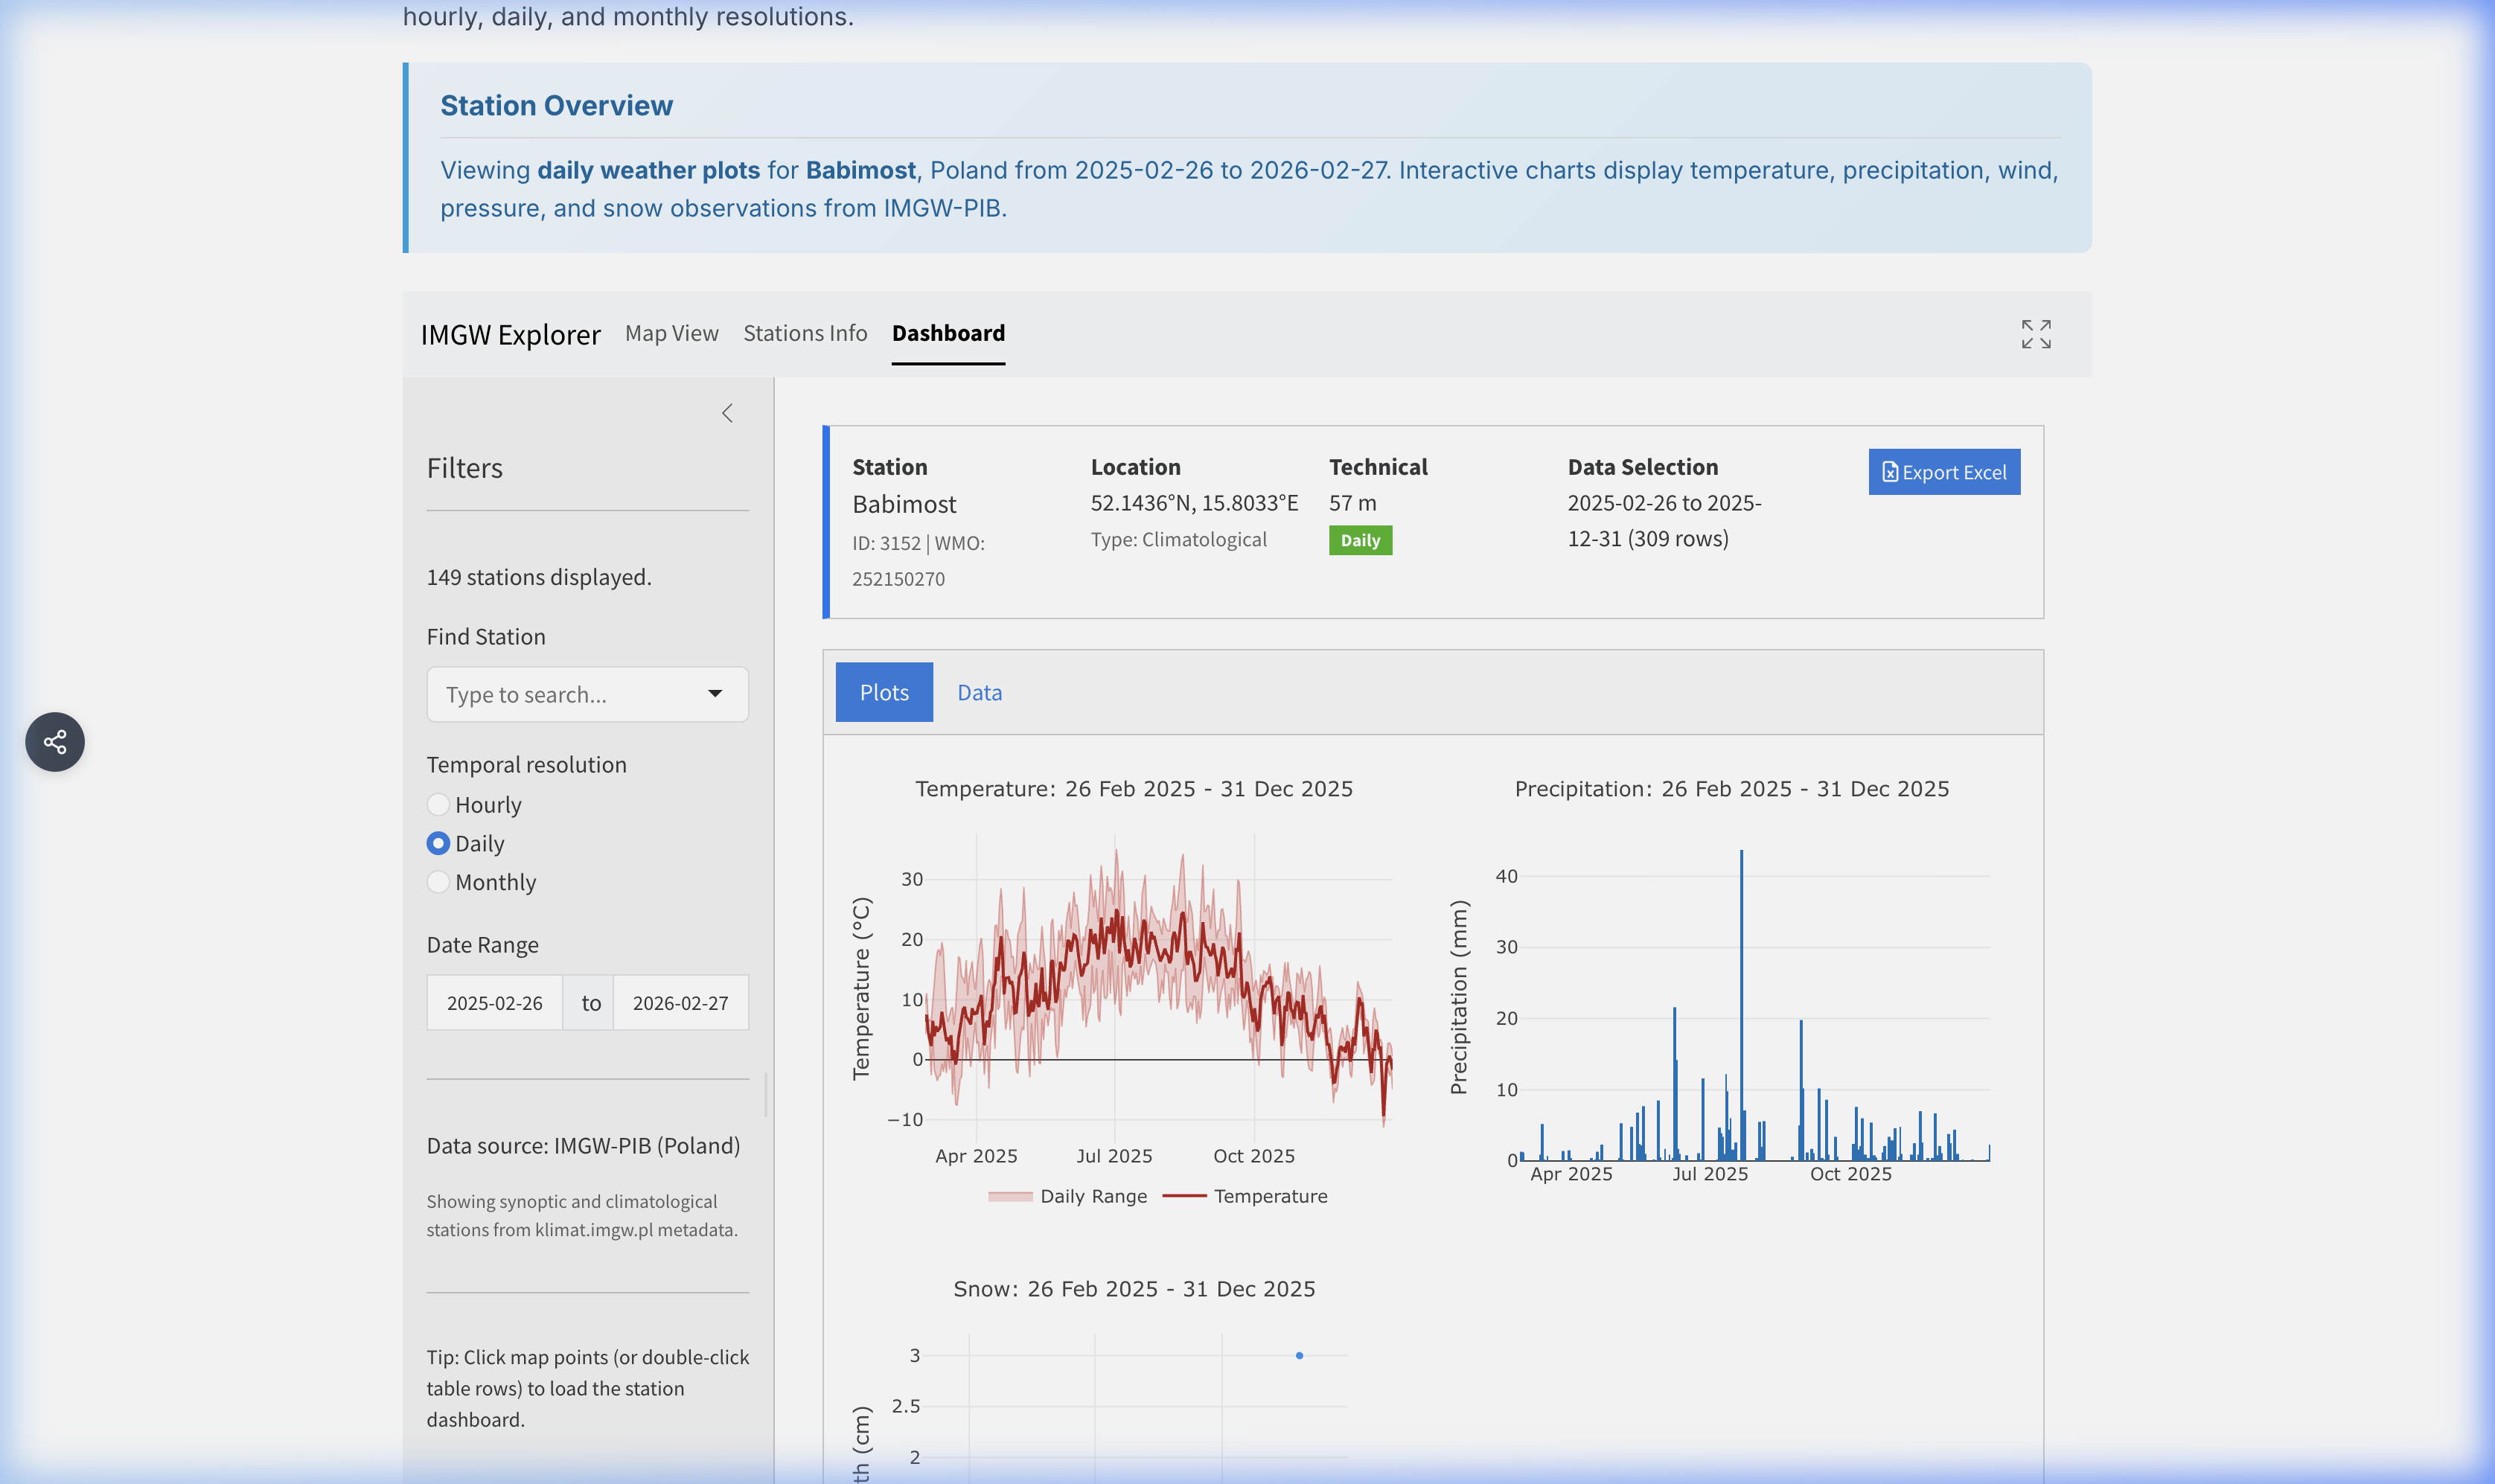
The Dashboard displays detailed data for a selected station. It becomes active after selecting a station from the map or table.
Dashboard Sub-Tabs
Plots: Interactive visualizations for different weather parameters:
- Temperature: Timeline of mean, maximum, and minimum temperatures.
- Precipitation: Bar charts of precipitation accumulation.
- Wind: Wind speed timeline and wind rose (for hourly data).
- Pressure: Station-level and sea-level pressure trends.
- Humidity: Relative humidity trends.
- Sunshine: Sunshine duration (where available).
- Snow: Snow depth and fresh snowfall (where available).
Data: Provides raw data access for the selected station and period.
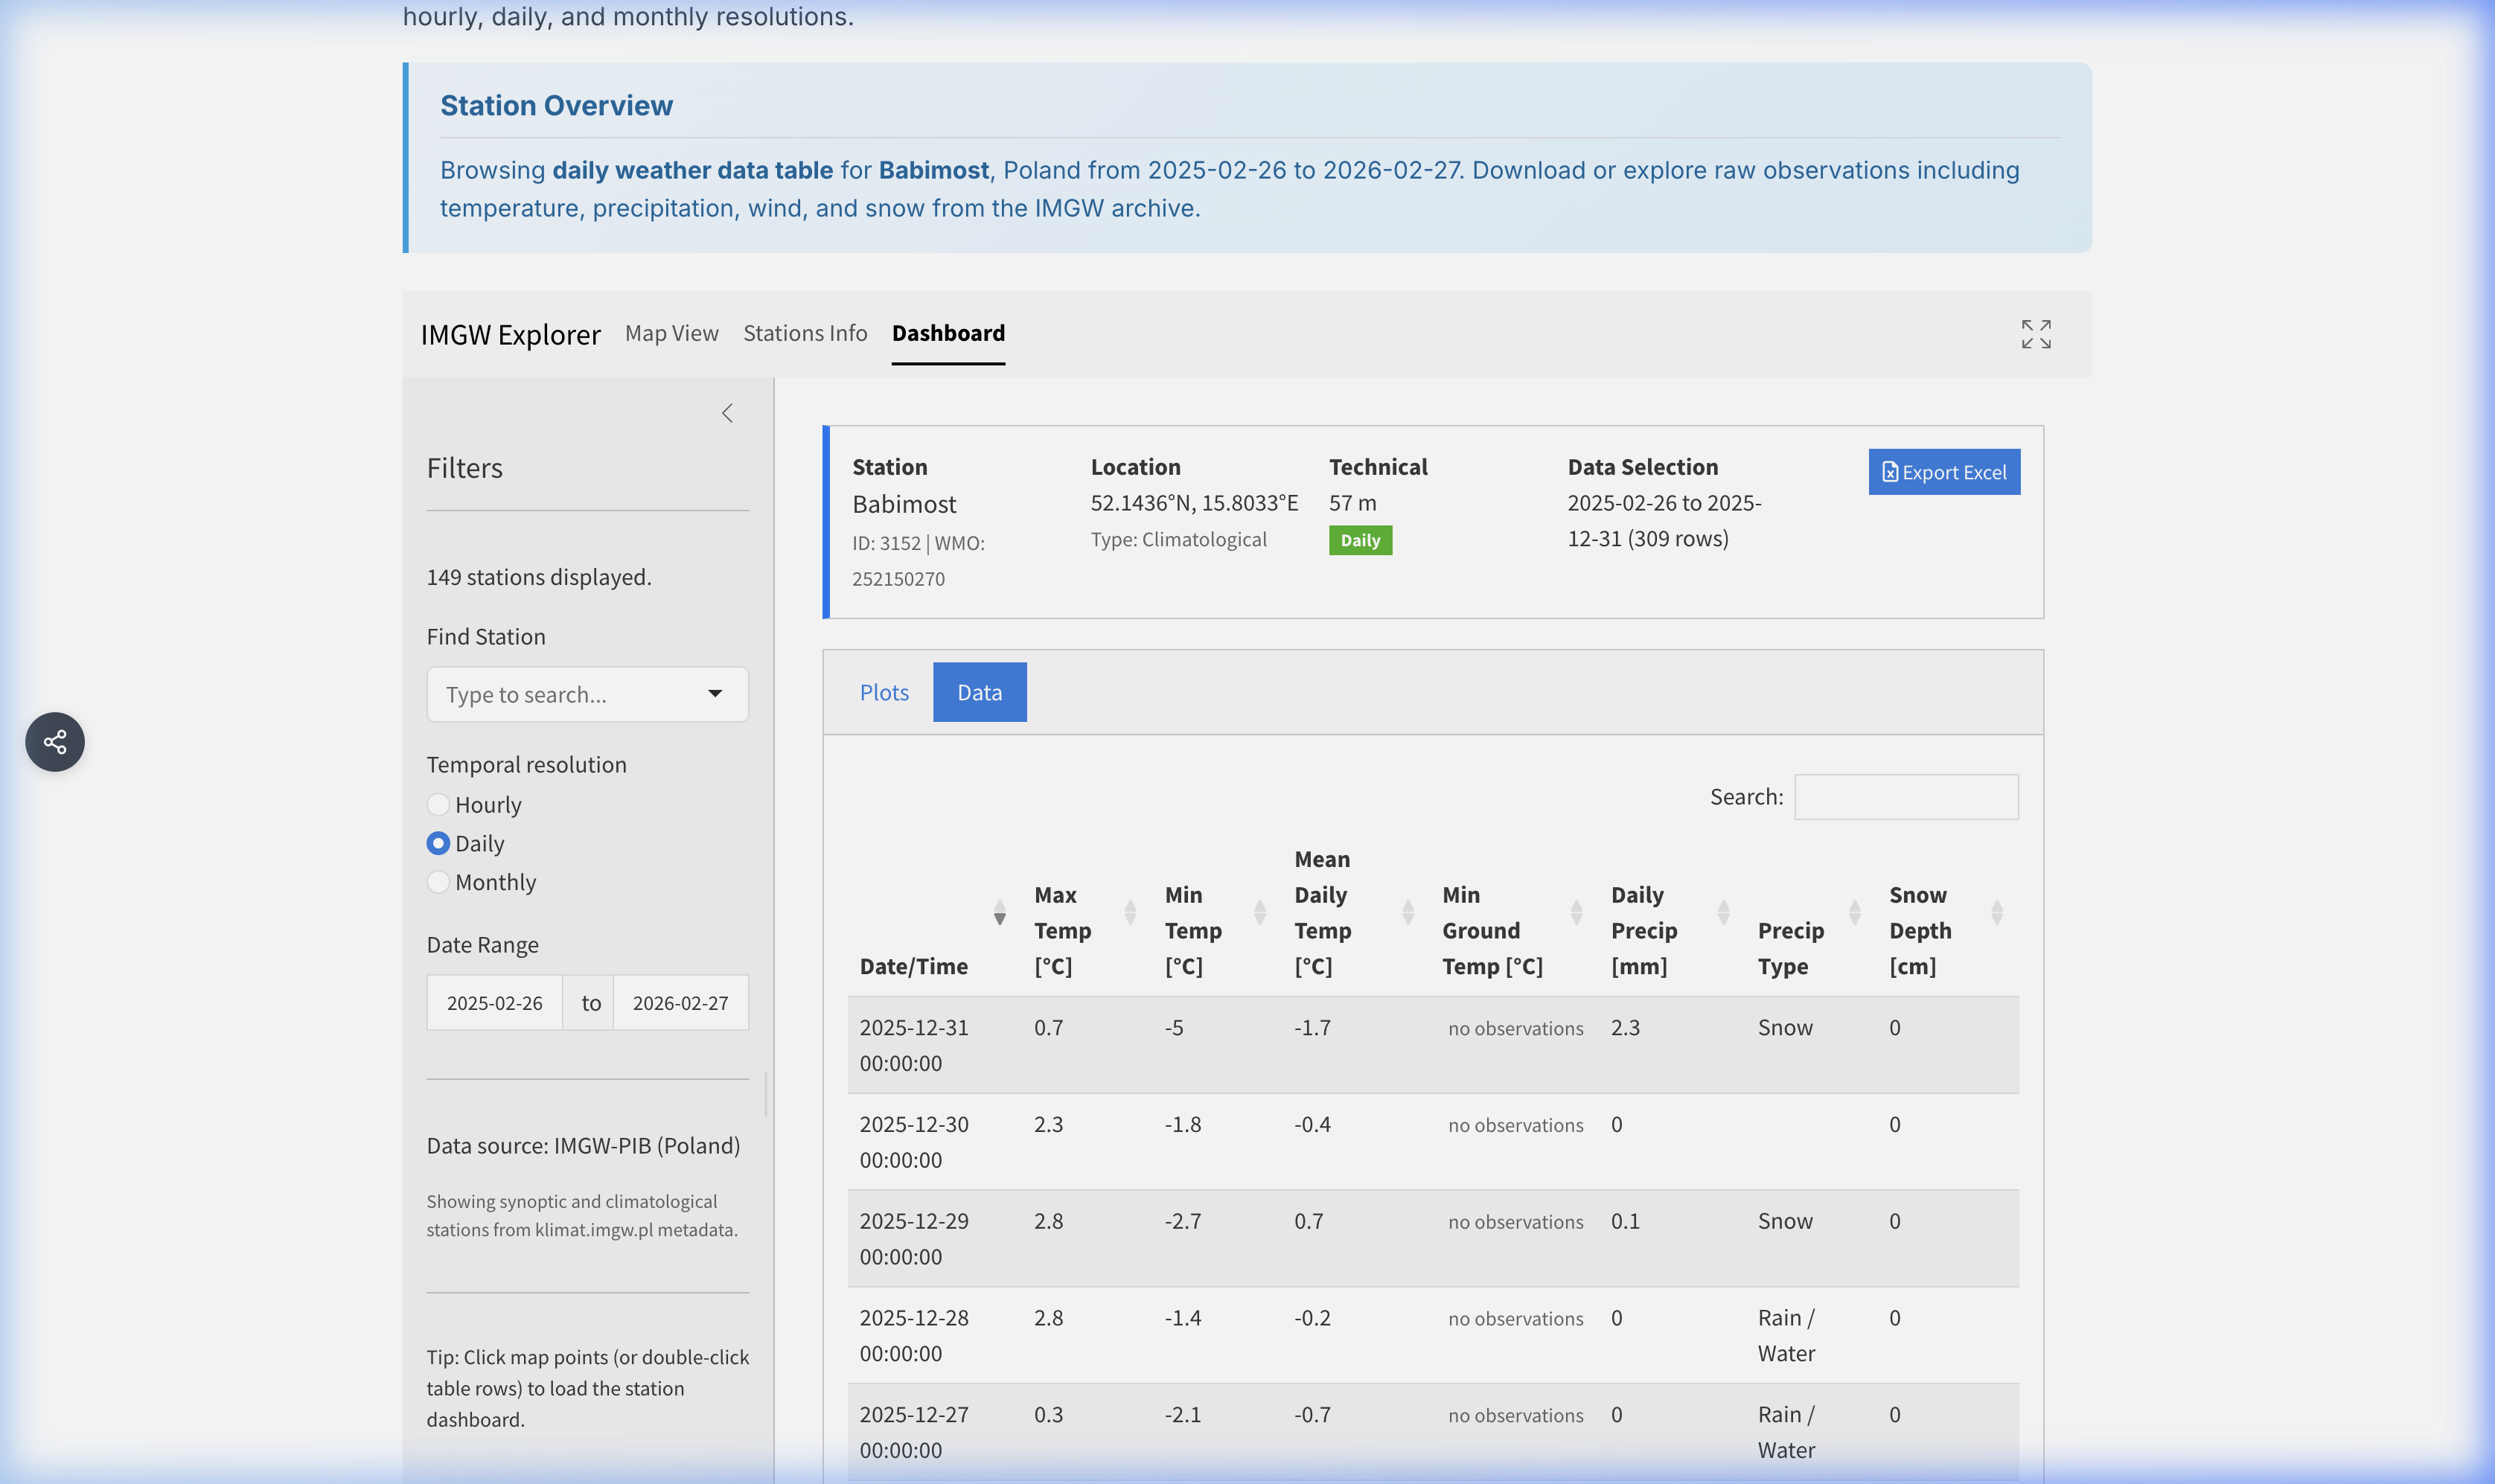
Dashboard Data - The table displays the parsed and translated data.
- Quality flags are integrated into the displayed values.
- Export Excel: Use the download button to save the currently loaded dataset as an Excel file.
4. Parameter Reference
The following tables list key parameters available in the IMGW Explorer for each resolution. Not all stations measure all parameters.
Hourly Parameters
[!NOTE] All timestamps for Hourly resolution are in Central European Time (CET/CEST).
| Column Name | Definition | Unit |
|---|---|---|
Temp |
Air Temperature | °C |
Dew Point |
Dew Point Temperature | °C |
Relative Humidity |
Relative Humidity | % |
Wind Speed |
Mean Wind Speed | m/s |
Wind Direction |
Wind Direction | ° |
Wind Gust |
Maximum Wind Gust | m/s |
Station Pressure |
Station-Level Pressure | hPa |
Sea Level Pressure |
Sea-Level Pressure | hPa |
Precipitation 6h |
6-Hour Precipitation Total | mm |
Snow Depth |
Snow Depth on Ground | cm |
Sunshine |
Sunshine Duration | h |
Cloud Cover |
Total Cloud Cover | oktas |
Visibility |
Horizontal Visibility | km |
Daily Parameters
| Column Name | Definition | Unit |
|---|---|---|
Mean Daily Temp |
Daily Mean Temperature | °C |
Max Temp |
Daily Maximum Temperature | °C |
Min Temp |
Daily Minimum Temperature | °C |
Daily Precip |
Total Daily Precipitation | mm |
Mean Wind Speed |
Daily Mean Wind Speed | m/s |
Max Gust |
Maximum Wind Gust | m/s |
Mean Rel Humidity |
Mean Relative Humidity | % |
Snow Depth |
Snow Depth on Ground | cm |
Fresh Snow |
Fresh Snow Depth | cm |
Sunshine |
Total Sunshine Duration | h |
Monthly Parameters
| Column Name | Definition | Unit |
|---|---|---|
Mean Monthly Temp |
Monthly Mean Temperature | °C |
Max Monthly Temp |
Monthly Maximum Temperature | °C |
Min Monthly Temp |
Monthly Minimum Temperature | °C |
Monthly Precip |
Total Monthly Precipitation | mm |
Mean Wind Speed |
Monthly Mean Wind Speed | m/s |
Monthly Sunshine |
Total Sunshine Duration | h |
Snow Days |
Number of Days with Snow Cover | days |
5. Quality Flags
The IMGW raw data includes status flags indicating measurement quality:
- Standard measurement (no flag)
- [8]: No observations performed
- 9 → 0: “No phenomena” flag (e.g., no precipitation occurred)
- Special values for snow depth: 997 = less than 0.5 cm, 998 = patchy, 999 = unmeasurable
In the data table, these flags are integrated directly into the displayed values or shown as muted superscripts.
7. Common Use Cases
Beyond browsing raw observations, the IMGW Explorer supports a range of practical and analytical workflows:
- Climate Trend Analysis: Select a station with a long record (e.g., Warszawa-Okęcie or Kraków-Balice) and compare monthly mean temperatures across decades to identify warming trends, shifting frost dates, or changes in precipitation seasonality.
- Agricultural Planning: Farmers and agronomists can examine daily temperature and precipitation data to determine optimum sowing windows, estimate growing degree-days, or assess drought risk during critical growth phases.
- Flood Event Investigation: Switch to hourly resolution and examine precipitation intensity during known flood events on the Vistula or Oder river basins. Combine this with wind and pressure data to reconstruct the synoptic situation that triggered the event.
- Renewable Energy Assessment: Use multi-year daily or hourly wind speed records to evaluate wind energy potential at locations near IMGW synoptic stations. Sunshine-duration data can similarly support preliminary solar energy feasibility studies.
- Education & Research: University lecturers and students can use the explorer as a teaching tool — for example, to illustrate the concept of temperature inversions, foehn effects in the Tatra foothills, or the urban heat-island effect by comparing city stations against nearby rural ones.
8. Data Source
Original data is sourced from the IMGW-PIB open data portal.
- Source URL: IMGW Public Data
- Metadata: Station coordinates and operational information are derived from the IMGW metadata catalog.