GHCNh User Guide
Access the Application: Return to Explorer
1. Introduction
The GHCNh Explorer is an interactive dashboard for exploring Global Historical Climatology Network hourly (GHCNh) data. It allows you to visualize detailed weather records from thousands of stations worldwide, including temperature, precipitation, wind, and pressure data.
3. Main Navigation Tabs
The application features three main tabs at the top:
Map View
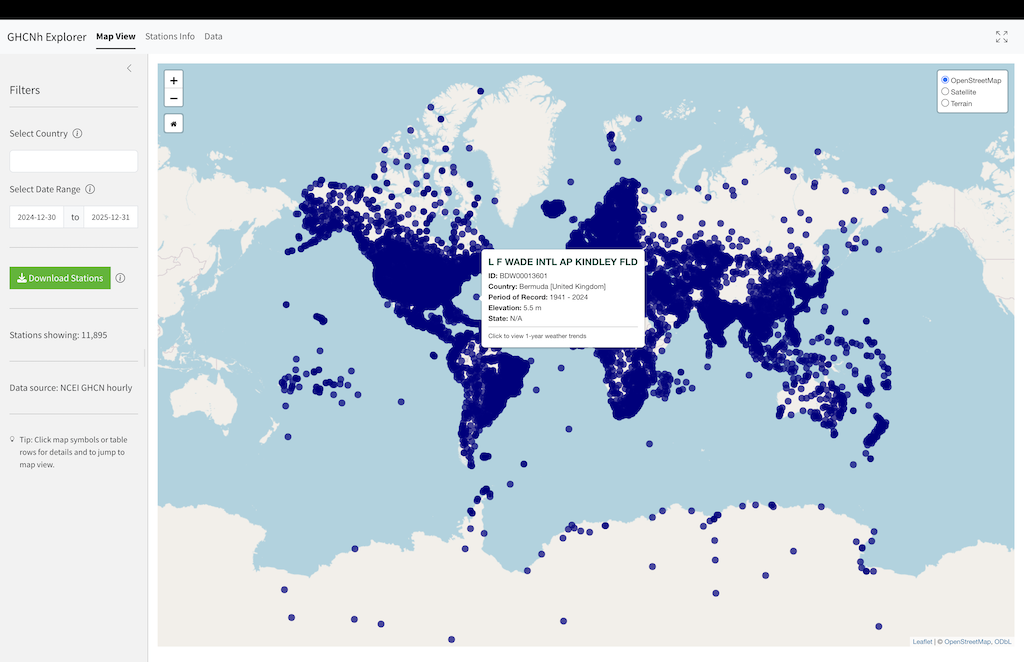
The default view is an interactive map showing available weather stations.
- Blue Dots: Represent stations available within your selected filters.
- Selection: Click any blue dot to select a station.
- Red Highlight: The selected station is highlighted with a red ring.
- Persistence: Note that even if you change global filters (like the date range) that might hide the station from the general list, the selected station remains highlighted so you never lose your place.
Stations Info
A tabular listing of all available stations. This view is useful for browsing the full station catalog.
- Double-Click: Double-click any row to load that station’s data and navigate directly to the Dashboard.
Dashboard
The Dashboard displays detailed data for a selected station. It only becomes active after selecting a station from the map or double-clicking a row in the Stations Info table.
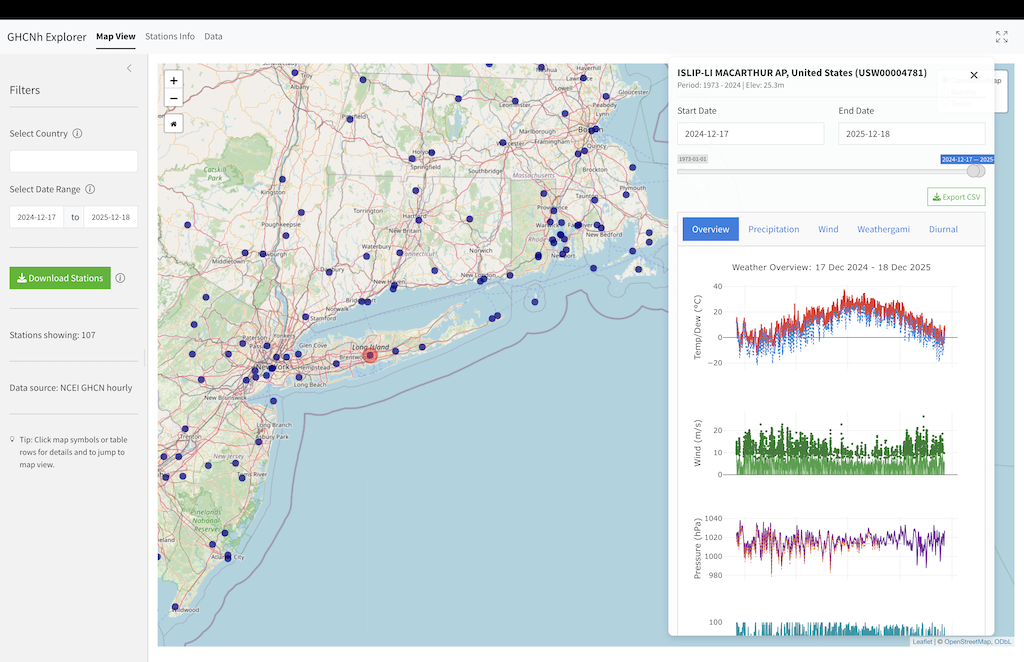
Dashboard Header
- Station Info: Name, ID, Country, Elevation, and Data Period.
- Export CSV: Download the parsed data for the currently viewed period.
Dashboard Sub-Tabs
The Dashboard contains two sub-tabs:
- Plots: Specialized visualization tabs for different weather parameters:
- Overview: A comprehensive 5-panel timeline showing Temperature & Dew Point, Wind Speed & Gusts, Pressure (MSL & Station), Relative Humidity, and Visibility.
- Precipitation: Stacked bar charts showing precipitation accumulations across different intervals (1h, 3h, 6h, 24h).
- Wind: A Wind Rose diagram showing the frequency distribution of wind speed and direction.
- Weathergami: A heatmap of Daily Max vs. Daily Min temperatures, visualizing the station’s climate signature.
- Diurnal: Shows the daily temperature cycle with median hourly temperature (red line) and individual daily traces (grey lines).
- Data: Provides raw data access with nested tabs for different resolutions.
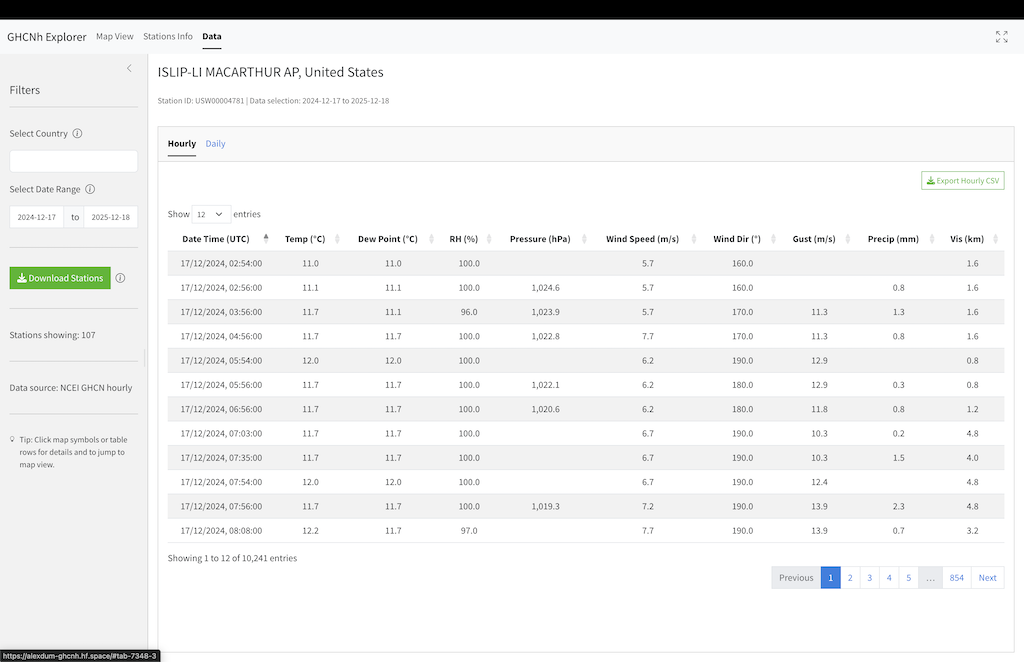
- Hourly: The detailed hour-by-hour dataset with an Export Hourly CSV button.
- Daily: A generated daily summary table with an Export Daily CSV button.
4. Parameter Reference
The following tables list the parameters available in the GHCNh Explorer for each resolution. These parameters correspond to the column names in the exported CSV files.
Hourly Parameters
| Column Name | Definition | Unit |
|---|---|---|
datetime |
Observation Timestamp | UTC |
temp |
Air Temperature | °C |
dew_point |
Dew Point Temperature | °C |
rh |
Relative Humidity | % |
precip |
Precipitation (1h) | mm |
precip_3h … precip_24h |
Precipitation Accumulations | mm |
wind_speed |
Wind Speed | m/s |
wind_dir |
Wind Direction | degrees |
wind_gust |
Wind Gust | m/s |
pressure |
Sea Level Pressure | hPa |
station_pressure |
Station Level Pressure | hPa |
altimeter |
Altimeter Setting | hPa |
vis |
Visibility | m |
wet_bulb |
Wet Bulb Temperature | °C |
snow_depth |
Snow Depth | cm |
sky_cover_1 … sky_cover_3 |
Sky Cover Layers | oktas |
sky_baseht_1 … sky_baseht_3 |
Cloud Base Height | m |
pres_wx_mw1 … pres_wx_mw3 |
Present Weather (Manual) | Code |
pres_wx_au1 … pres_wx_au3 |
Present Weather (Auto) | Code |
pres_wx_aw1 … pres_wx_aw3 |
Present Weather (Auto - Recent) | Code |
Daily Parameters
| Column Name | Definition | Unit |
|---|---|---|
date |
Date | YYYY-MM-DD |
Tavg |
Average Temperature | °C |
Tmax |
Maximum Temperature | °C |
Tmin |
Minimum Temperature | °C |
Precip_Sum |
Total Precipitation | mm |
Wind_Max |
Maximum Hourly Wind Speed | m/s |
RH_Avg |
Average Relative Humidity | % |
Pavg |
Average Pressure | hPa |
Vis_Avg |
Average Visibility | m |
5. Direct Data Access
Advanced users can download the full historical raw data (Pipe Separated Values - .psv) directly from the NOAA NCEI repository.
- Base URL: https://www.ncei.noaa.gov/oa/global-historical-climatology-network/hourly/access/by-station/
- File Naming Convention:
GHCNh_<Station_ID>_por.psv
You can find the Station ID for any location in the Stations Info tab of the application, or by downloading the station list CSV.
Example: To download the data for TOKYO (ID: JAI0000RJTD): https://www.ncei.noaa.gov/oa/global-historical-climatology-network/hourly/access/by-station/GHCNh_JAI0000RJTD_por.psv