EuroMeteo User Guide
Access the Application: Return to Explorer
1. Introduction
The EuroMeteo Explorer is an interactive dashboard for exploring near real-time meteorological observations across Europe and beyond. Powered by the MeteoGate platform, it provides access to thousands of stations following the WIS 2.0 / E-SOH standards, including high-resolution data for temperature, precipitation, wind, and pressure.
3. Data Source: MeteoGate
EuroMeteo leverages the MeteoGate Observations API, which integrates data from National Meteorological Services across the continent.
- Real-Time Data: Observations are generally updated hourly.
- Retention: The explorer focuses on the most recent 24 hours of data.
- Open Standards: Data is served via OGC API Features, ensuring interoperability and transparency.
For technical details, visit the MeteoGate Platform.
4. Main Navigation Tabs
The application features three main tabs at the top:
Map View
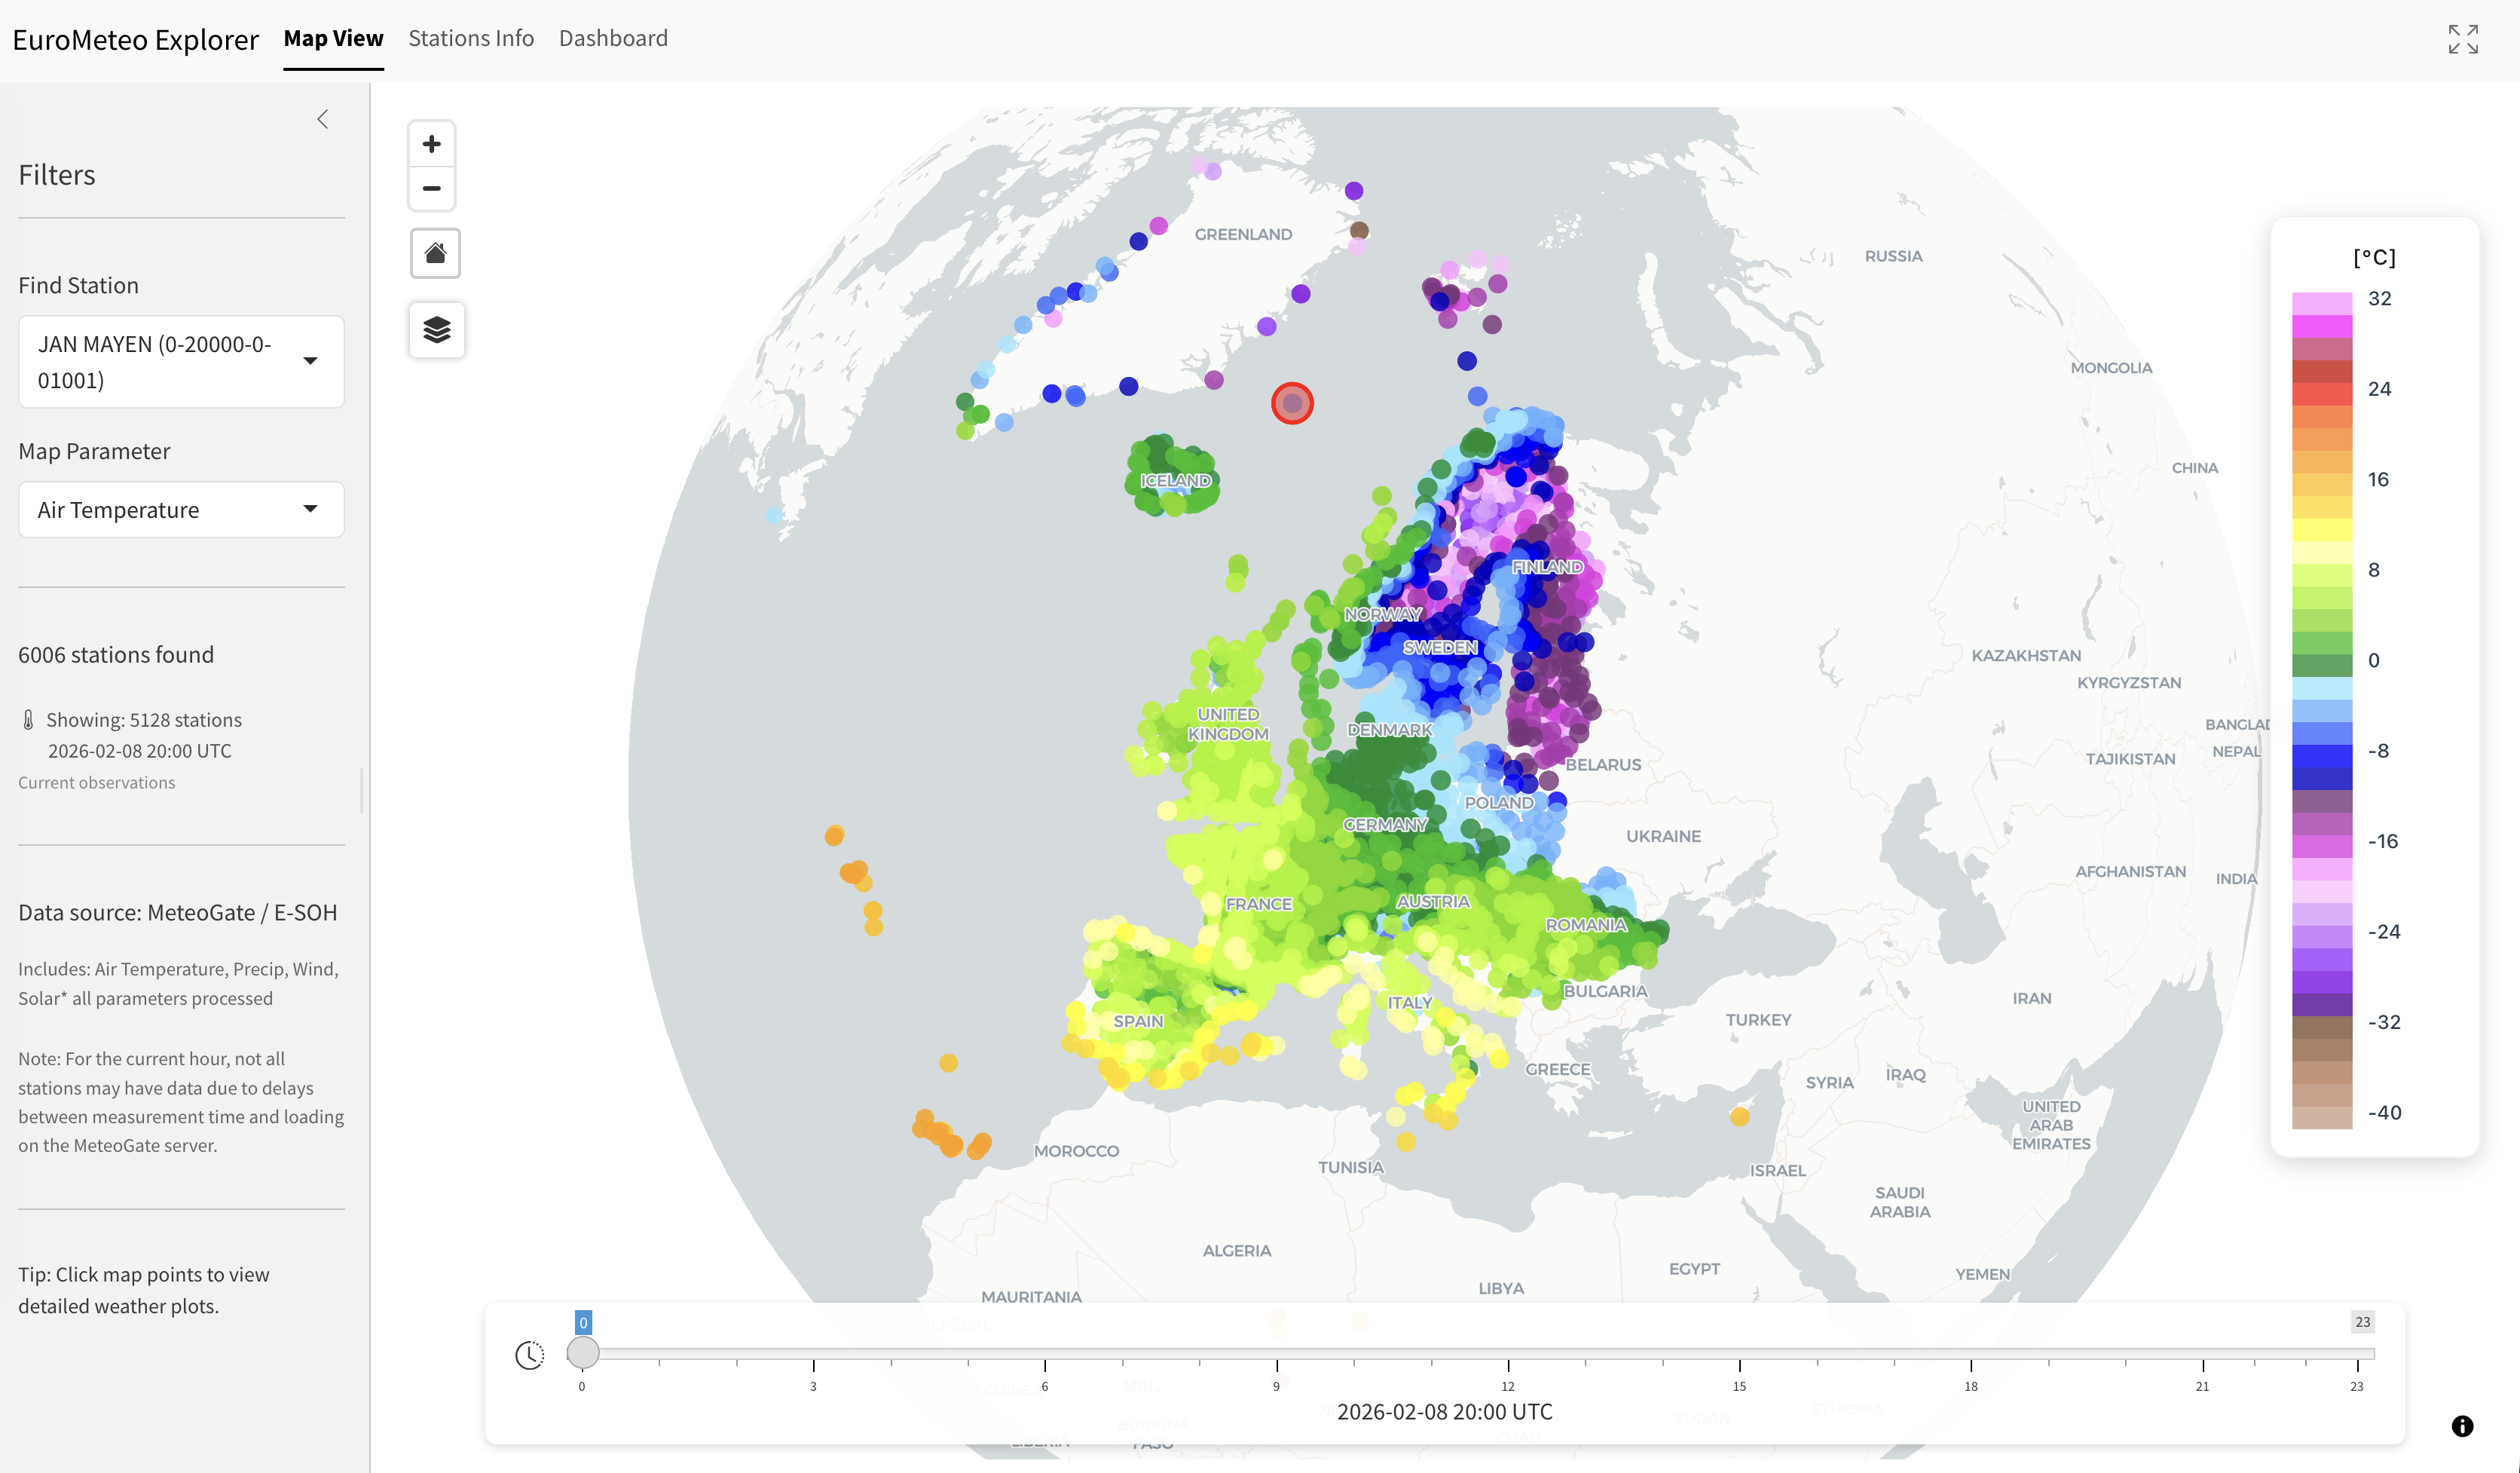
The default view is an interactive globe showing weather stations.
- Markers: Represent active stations. Color intensity reflects the value of the selected Map Parameter.
- Time Slider: Located at the bottom, allows you to step back through the last 24 individual hours of observations.
- Layer Control: Change the basemap (Light, Dark, Satellite) and toggle labels.
- Selection: Click any marker to view a detailed popup with the latest values.
Stations Info
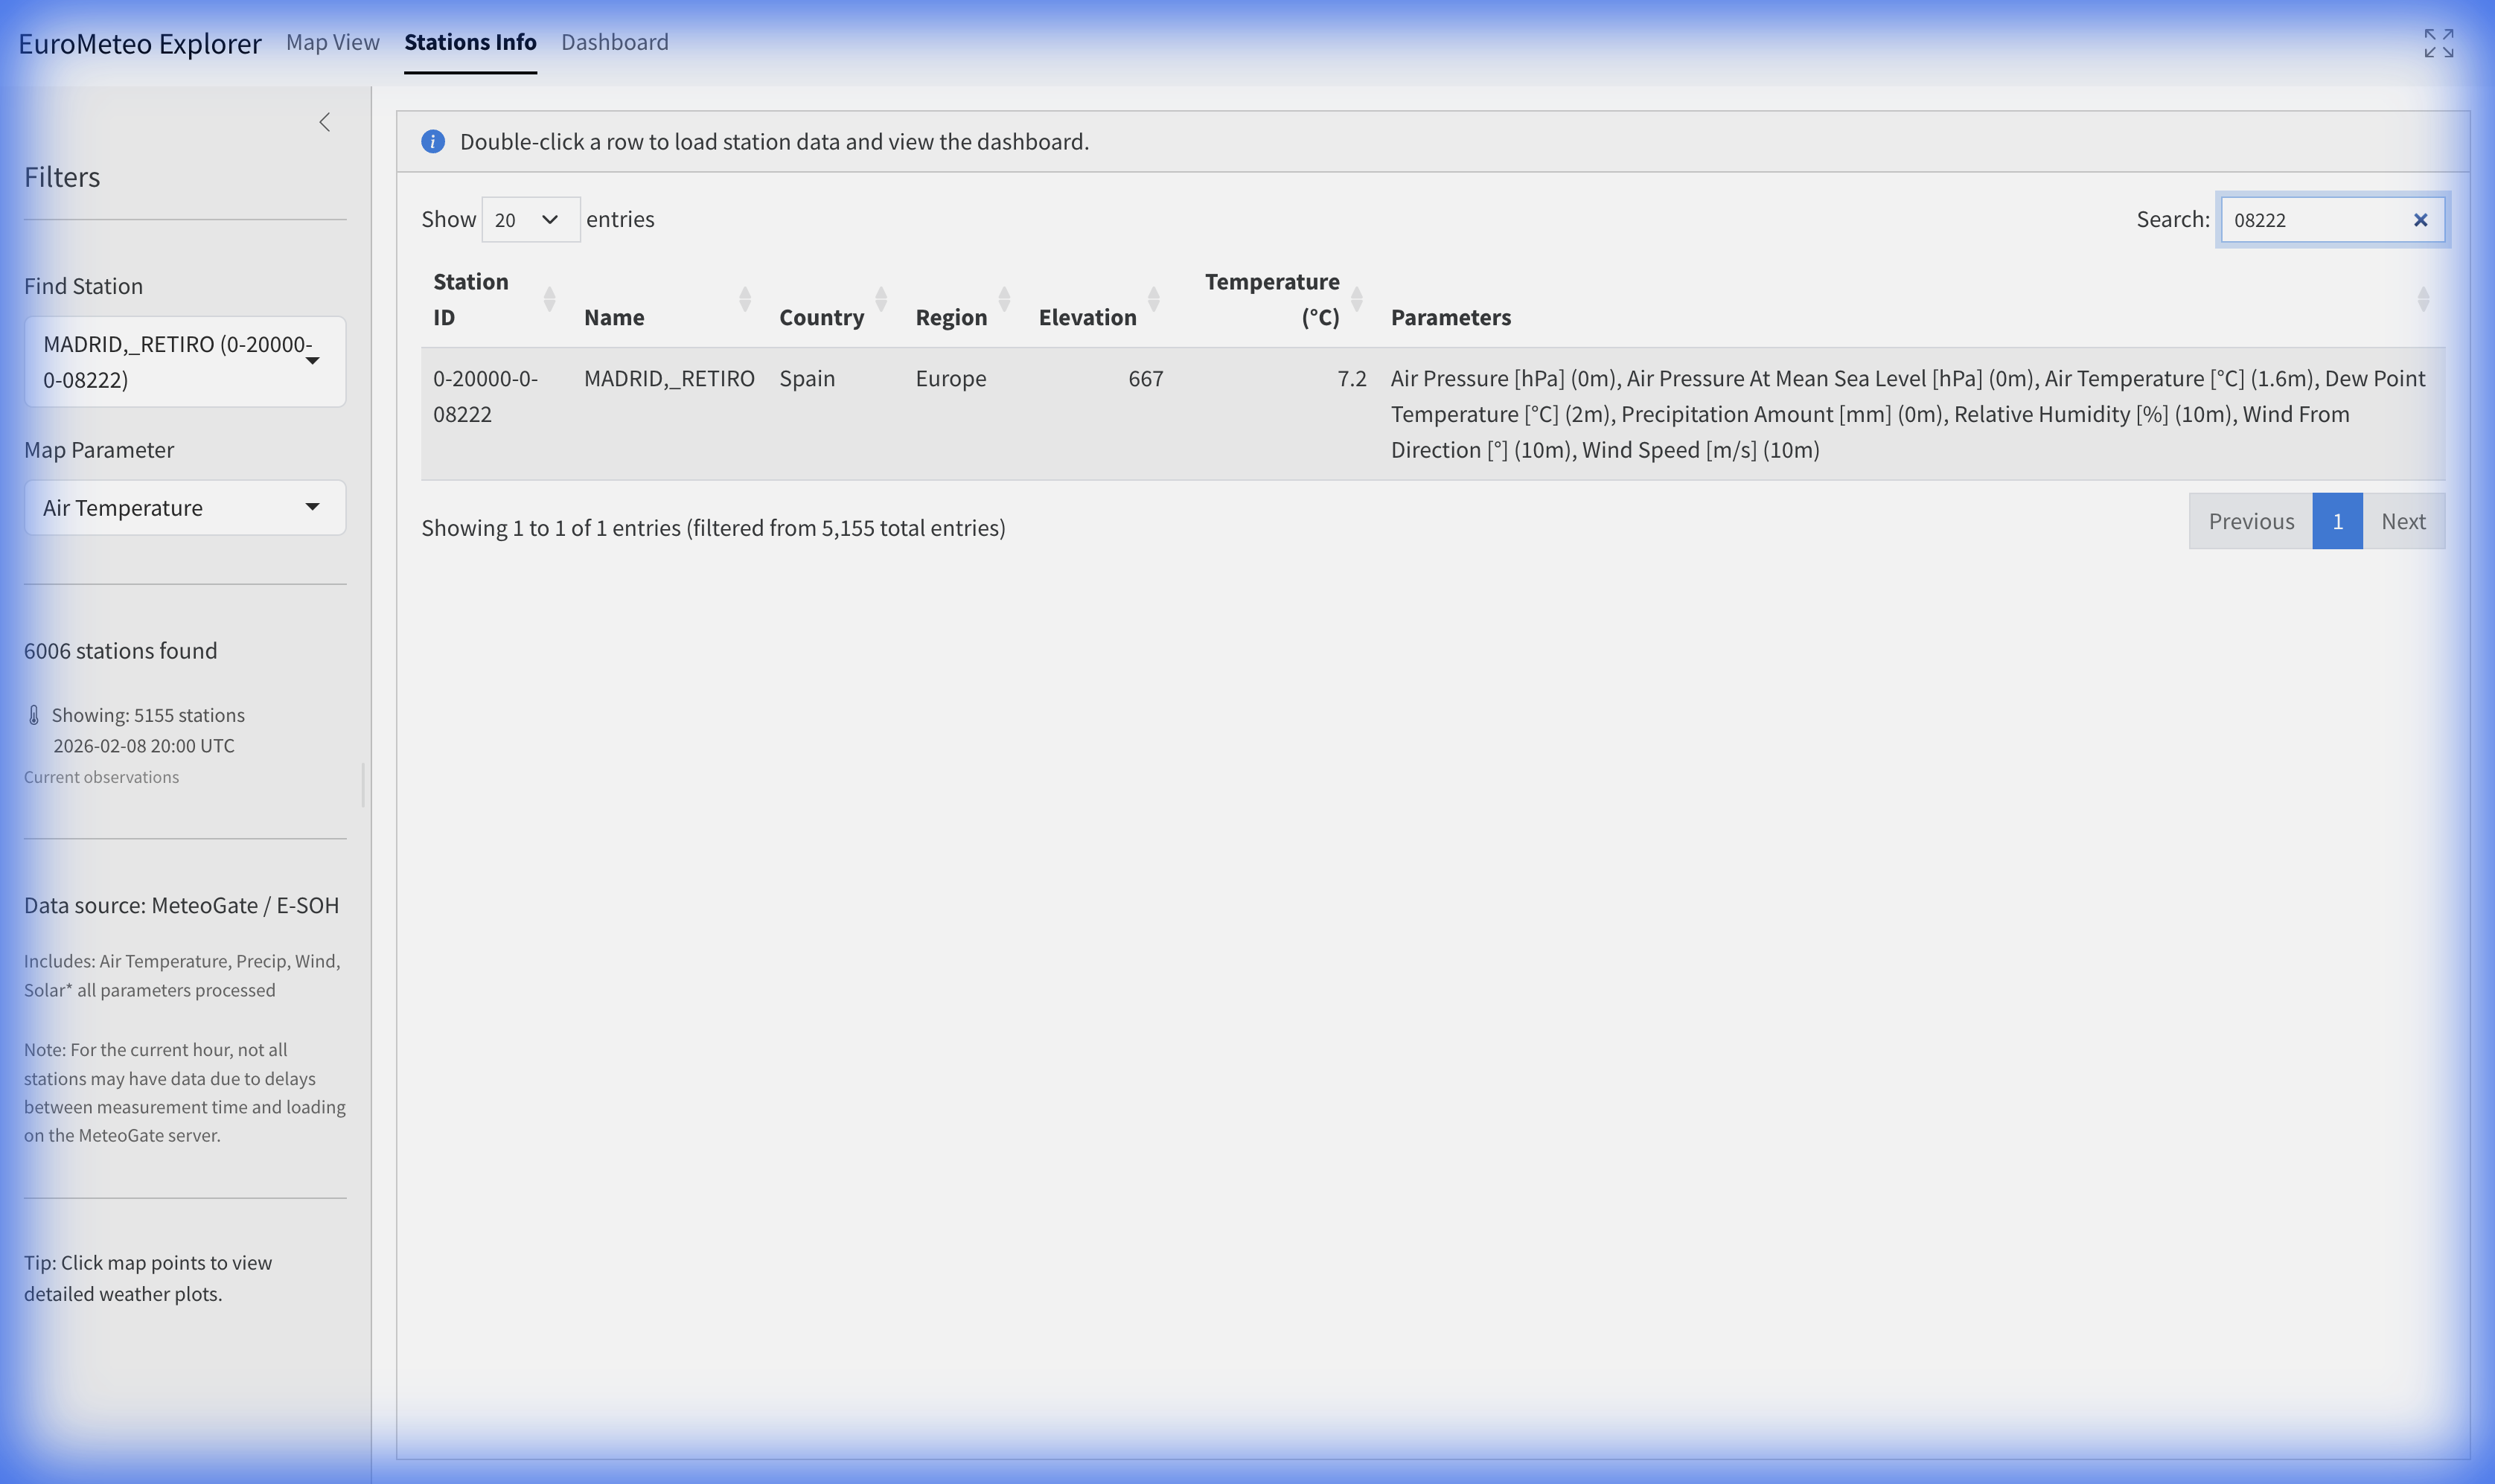
A comprehensive list of all stations in the network.
- Search & Filter: Use the table search to find stations by country or city.
- Capabilities: The “Parameters” column lists all meteorological variables reported by each station.
- Engagement: Double-click any row to load that station’s full 24-hour history and navigate to the Dashboard.
Dashboard
The Dashboard provides a deep dive into the selected station’s data.
Plots Tab
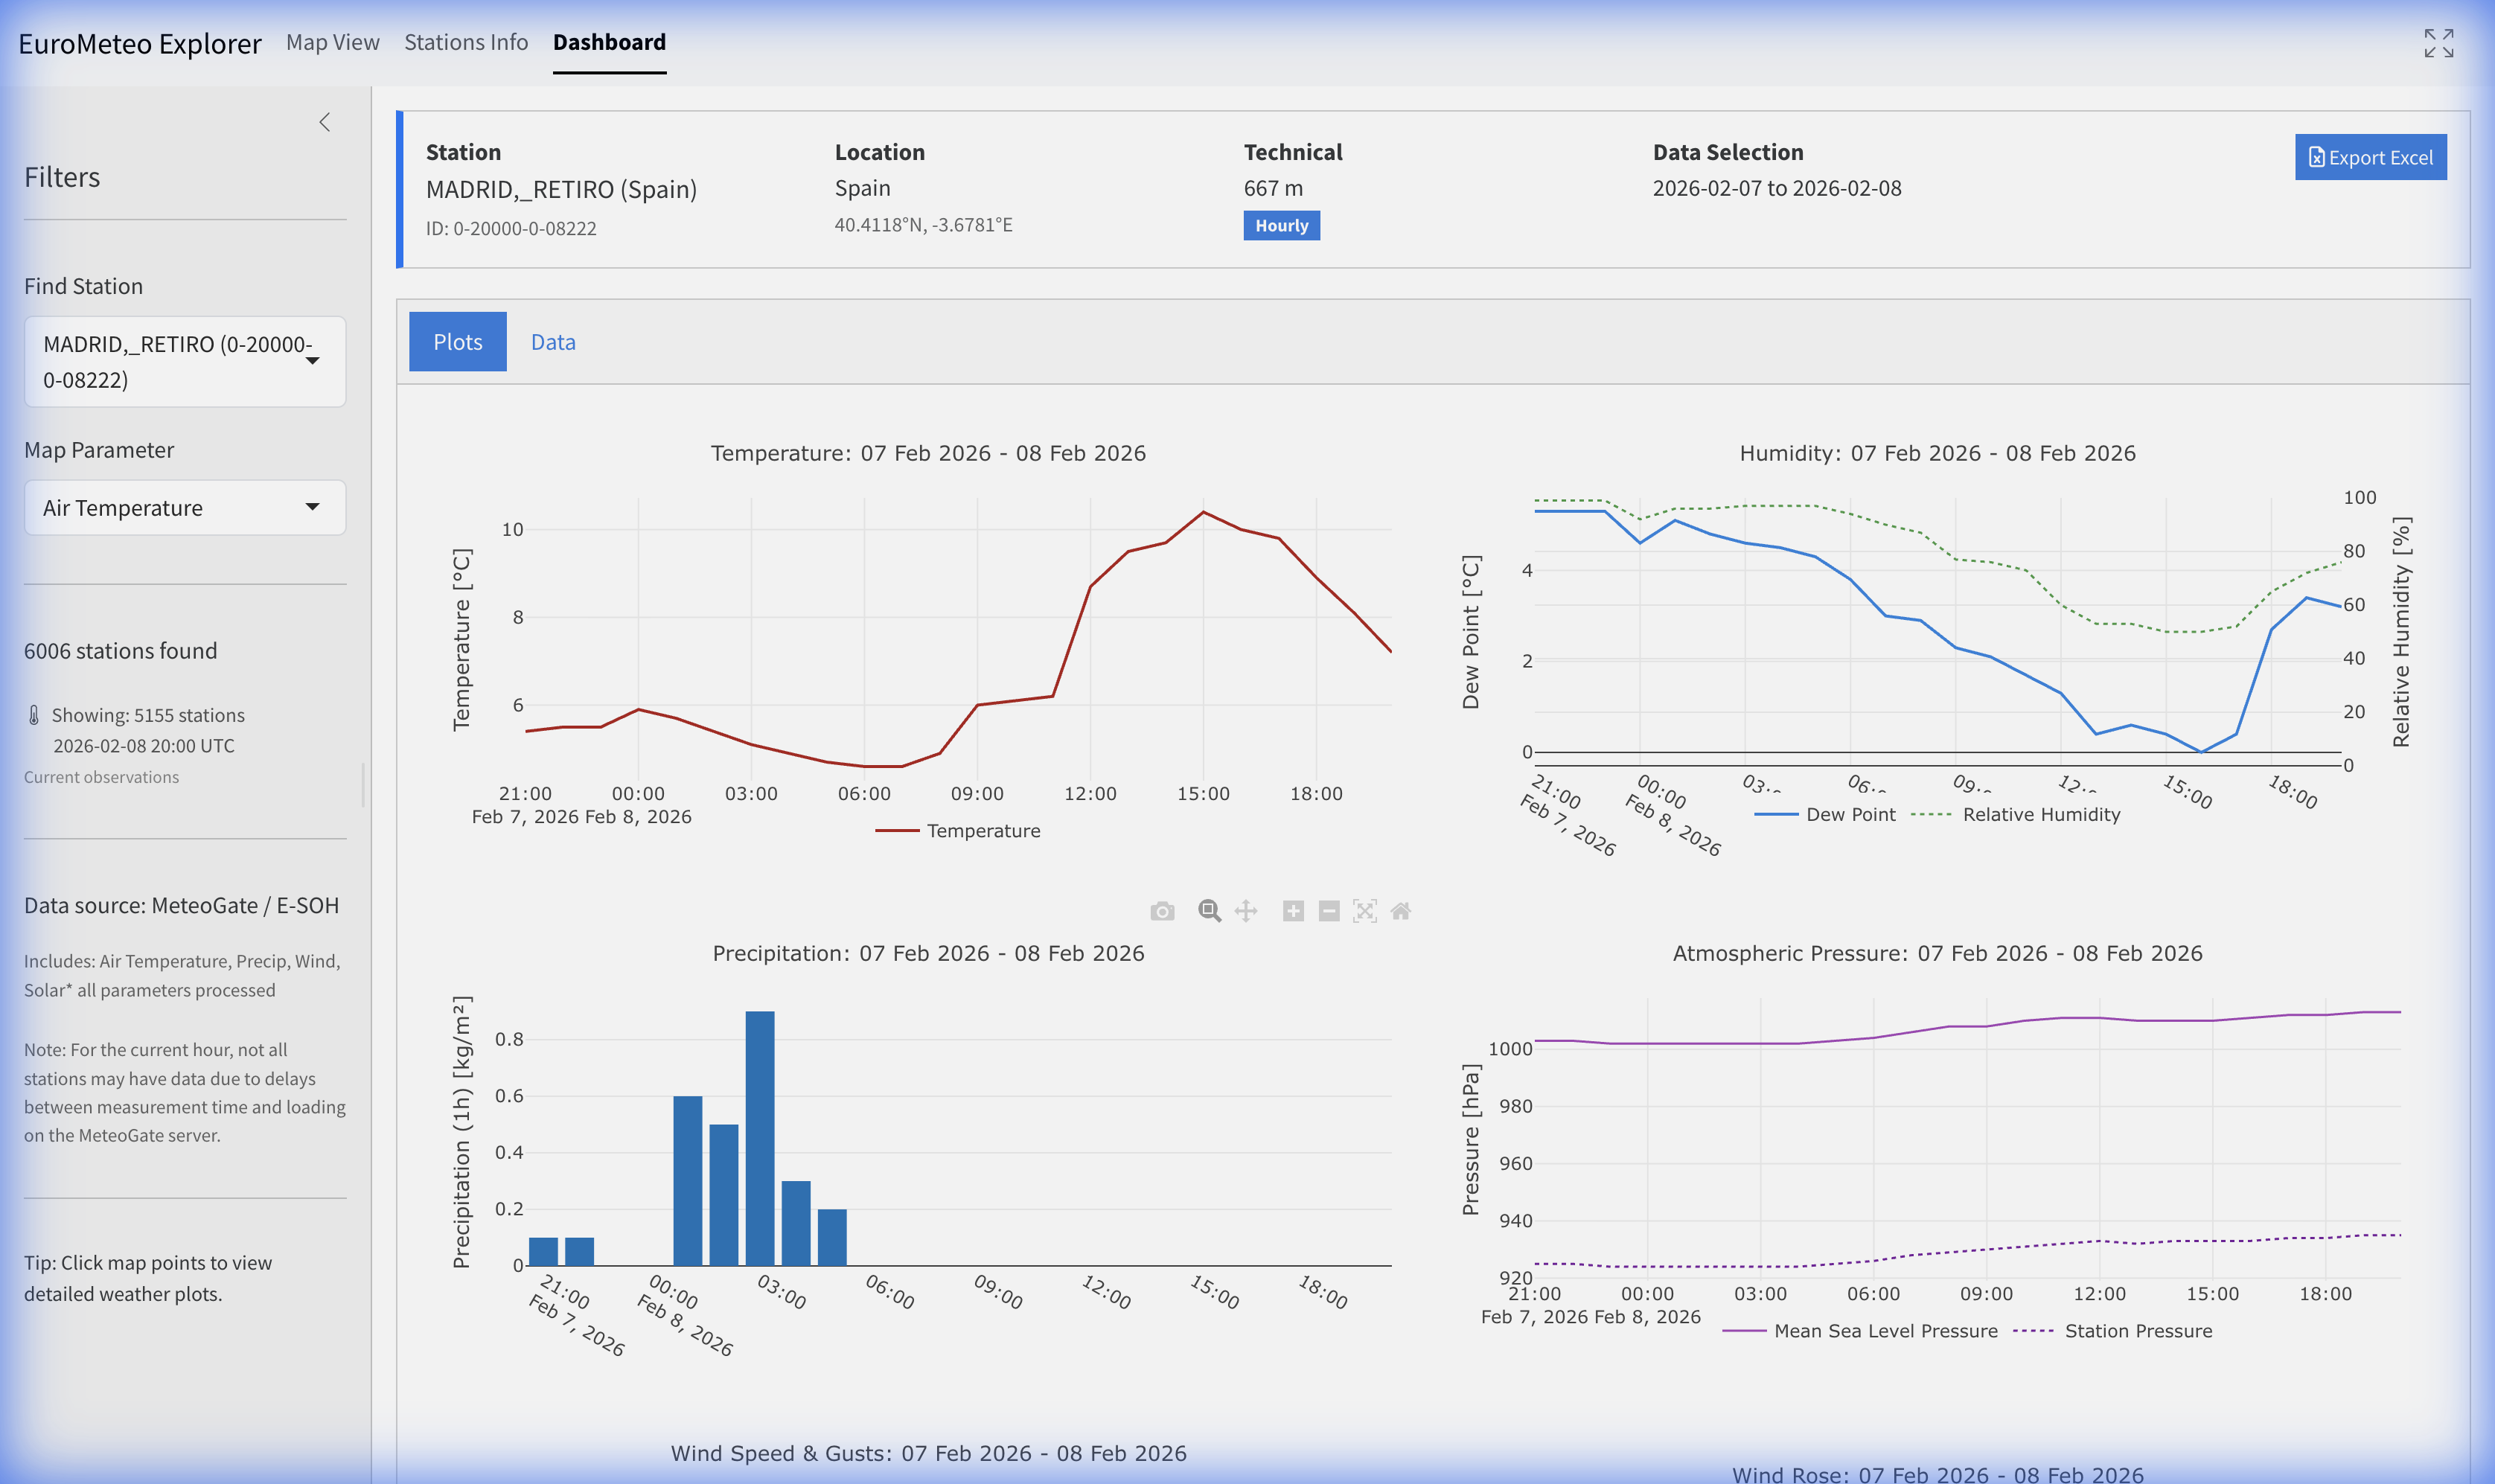
Specialized visualization for station trends: - Temperature & Humidity: Dual-axis or separate timelines for air temperature and relative humidity. - Precipitation: Hourly or 10-minute accumulation charts depending on station capability. - Wind: Dynamic wind speed trends and wind rose analysis. - Pressure: Barometric pressure trends.
Data Tab
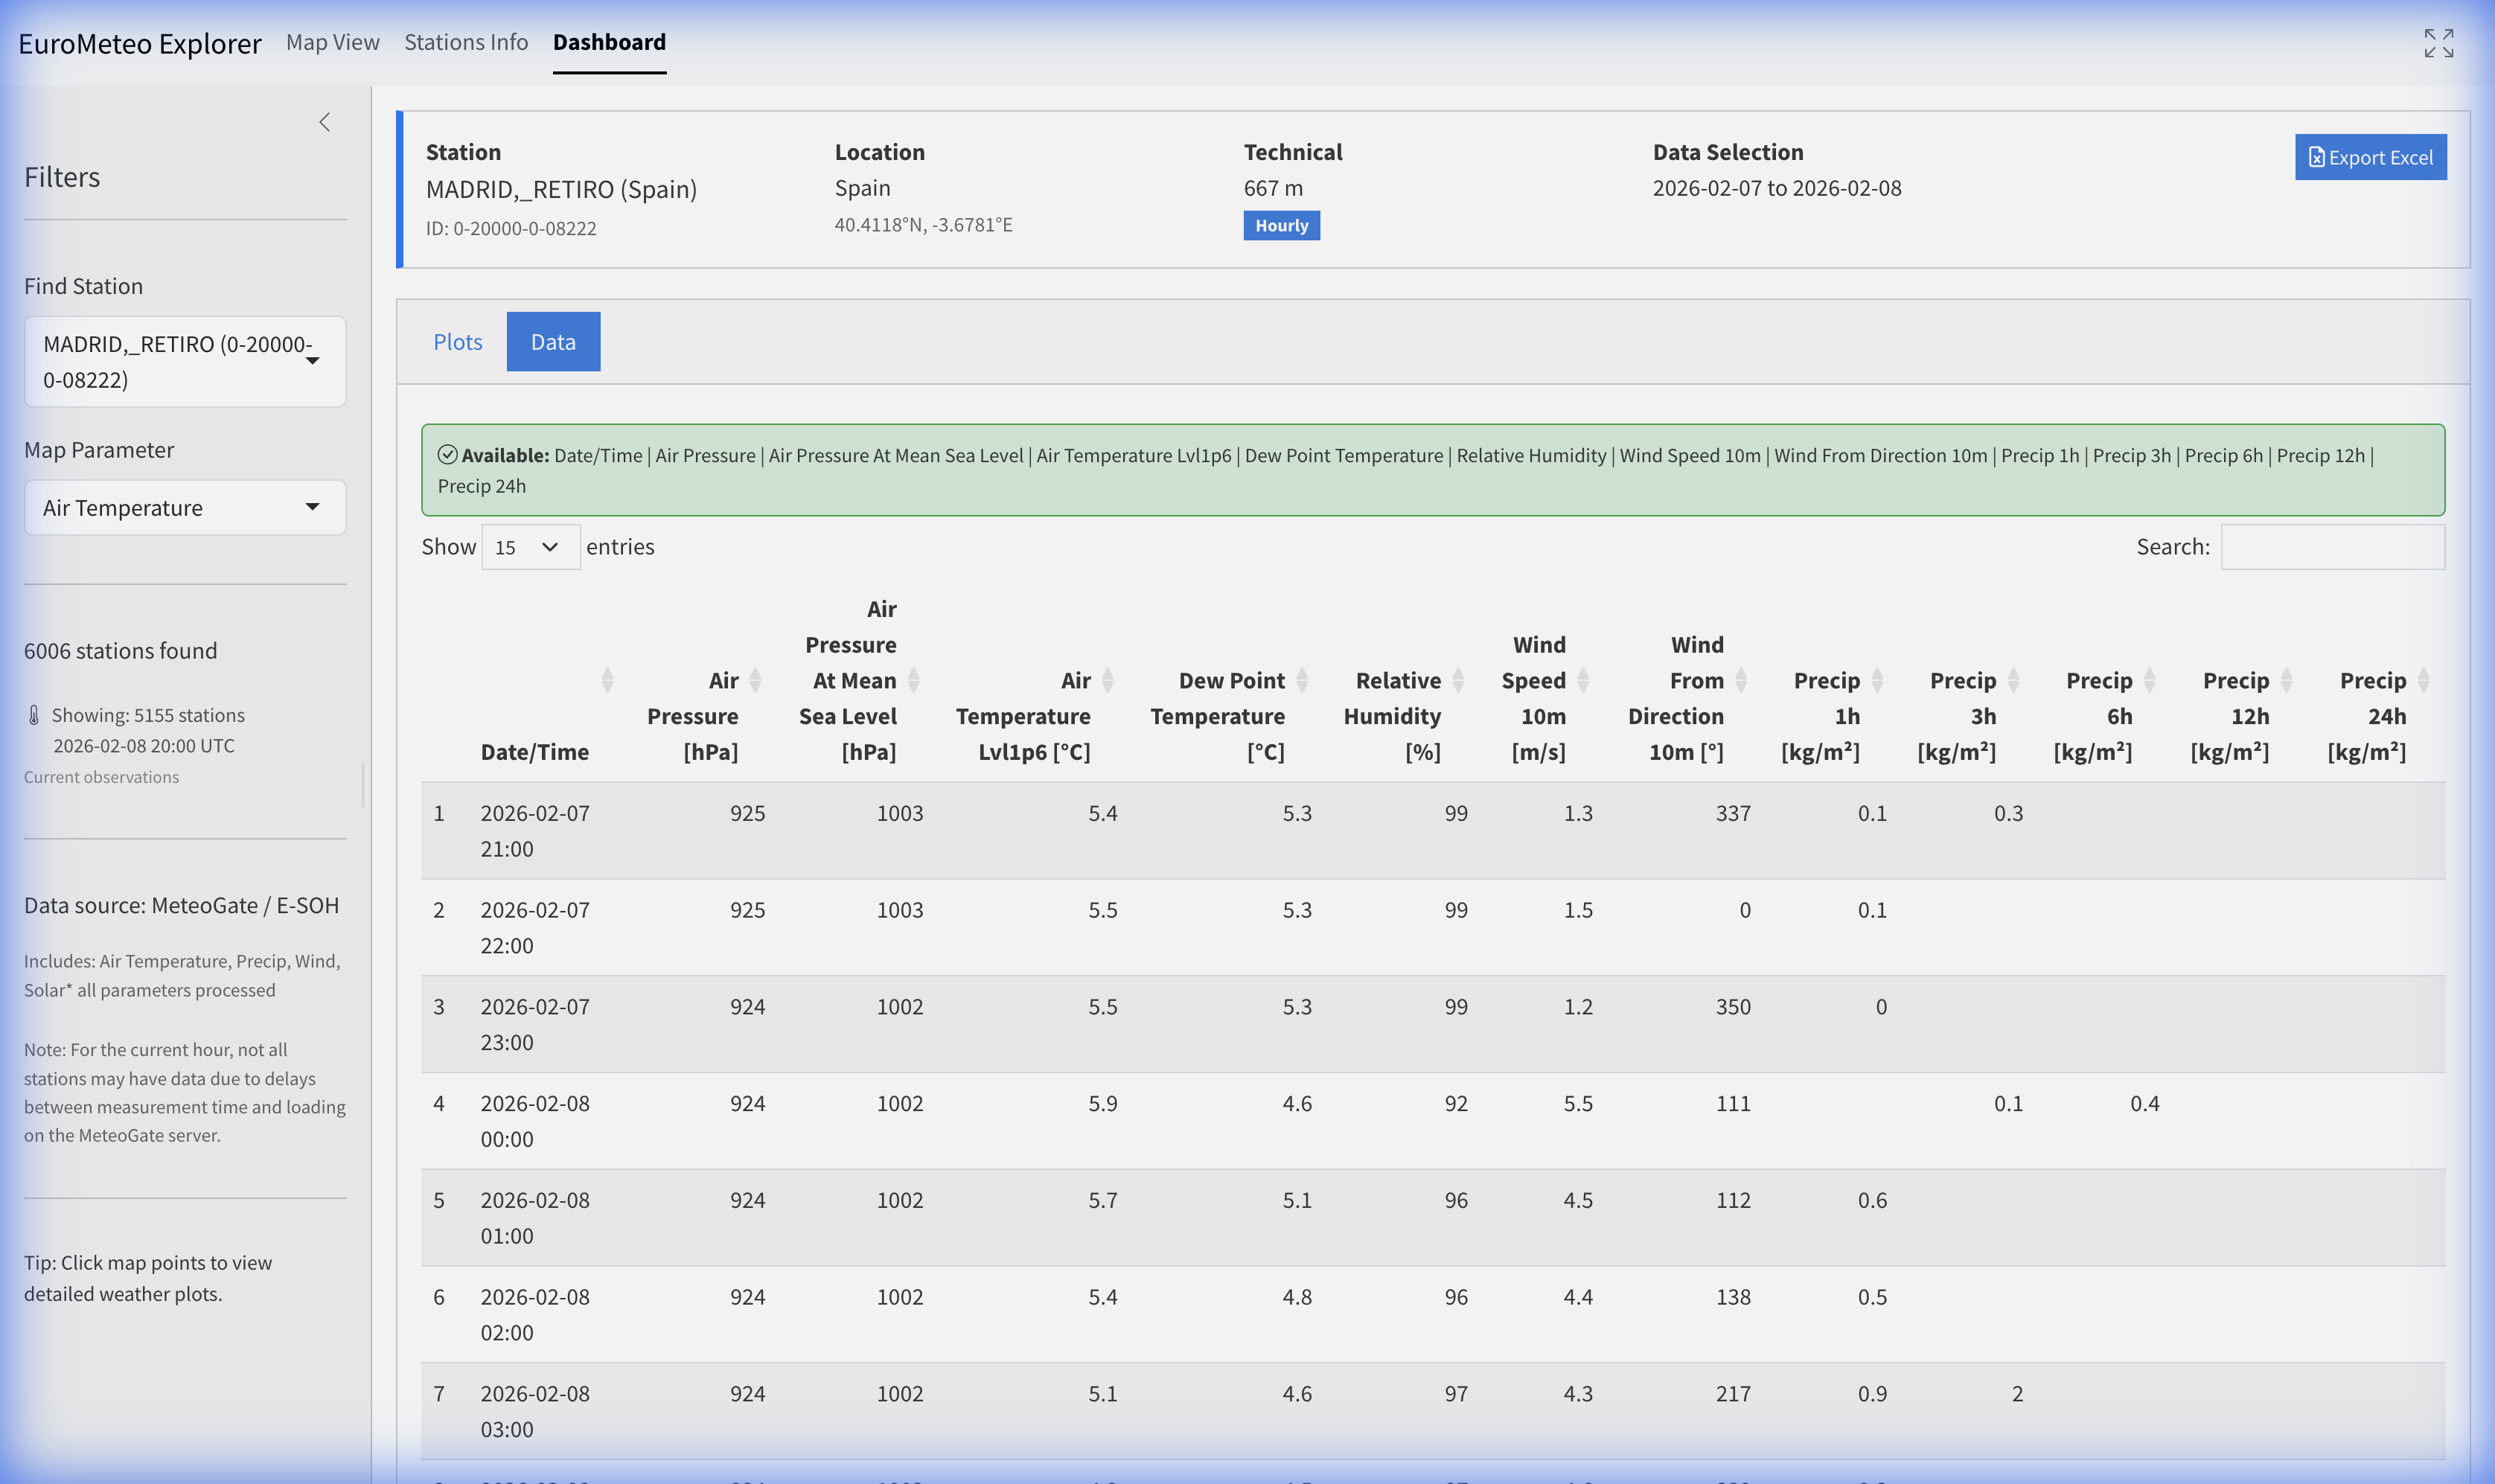
- Raw Measurements: View the underlying data points in a sortable table.
- Parameter Definitions: Explanations of the standard names and units are provided above the table.
- Export Data: Use the Export Excel button in the header to download the station’s 24-hour record for offline analysis.
5. Parameter Reference
EuroMeteo utilizes standard CF (Climate and Forecast) naming conventions for meteorological variables.
| Standard Name | Common Name | Unit |
|---|---|---|
air_temperature |
Air Temperature | °C |
air_temperature_max |
Max Air Temperature | °C |
air_temperature_min |
Min Air Temperature | °C |
dew_point_temperature |
Dew Point Temperature | °C |
relative_humidity |
Relative Humidity | % |
precipitation_amount |
Precipitation Amount | mm |
air_pressure |
Air Pressure | hPa |
surface_air_pressure |
Surface Air Pressure | hPa |
air_pressure_at_mean_sea_level |
Sea Level Pressure | hPa |
wind_speed |
Wind Speed | m/s |
wind_from_direction |
Wind Direction | degrees |
wind_speed_of_gust |
Wind Speed Gust | m/s |
global_solar_radiation |
Global Solar Radiation | W/m² |
surface_snow_thickness |
Snow Thickness | cm |