DWD User Guide
Access the Application: Return to Explorer
1. Introduction
The DWD Explorer is an interactive dashboard for exploring open data from Deutscher Wetterdienst (DWD). It allows you to visualize high-quality meteorological records from stations across Germany, including air temperature, precipitation, wind, and solar radiation, available in 10-minute, hourly, daily, and monthly resolutions.
If you need Europe-wide near real-time hourly observations, use the EuroMeteo Explorer for cross-country coverage.
3. Direct Data Download
Advanced users can download data directly from the DWD OpenData server without using the application interface. This is useful for automated scripts or bulk downloading.
- Base URL:
https://opendata.dwd.de/climate_environment/CDC/observations_germany/climate/ - Structure: The data is organized by resolution and parameter:
[resolution]/[parameter]/[recent|historical]/
Example 1: Hourly Air Temperature
To download recent hourly air temperature data for a specific station, construct the URL using the Station ID found in the Stations Info table.
- Station: Bremen (ID:
00691) - URL:
https://opendata.dwd.de/climate_environment/CDC/observations_germany/climate/hourly/air_temperature/recent/stundenwerte_TU_00691_akt.zip - Description: Contains recent hourly air temperature measurements for station Bremen.
Example 2: Monthly Climate Data
To download monthly climate data (temperature, precipitation, wind, clouds, sunshine), use the kl parameter:
- Station: Bremen (ID:
00691) - URL:
https://opendata.dwd.de/climate_environment/CDC/observations_germany/climate/monthly/kl/recent/monatswerte_KL_00691_akt.zip - Description: Contains recent monthly climate data for station Bremen, including temperature, precipitation, wind speed, cloud cover, and sunshine duration.
4. Main Navigation Tabs
The application features three main tabs at the top:
Map View
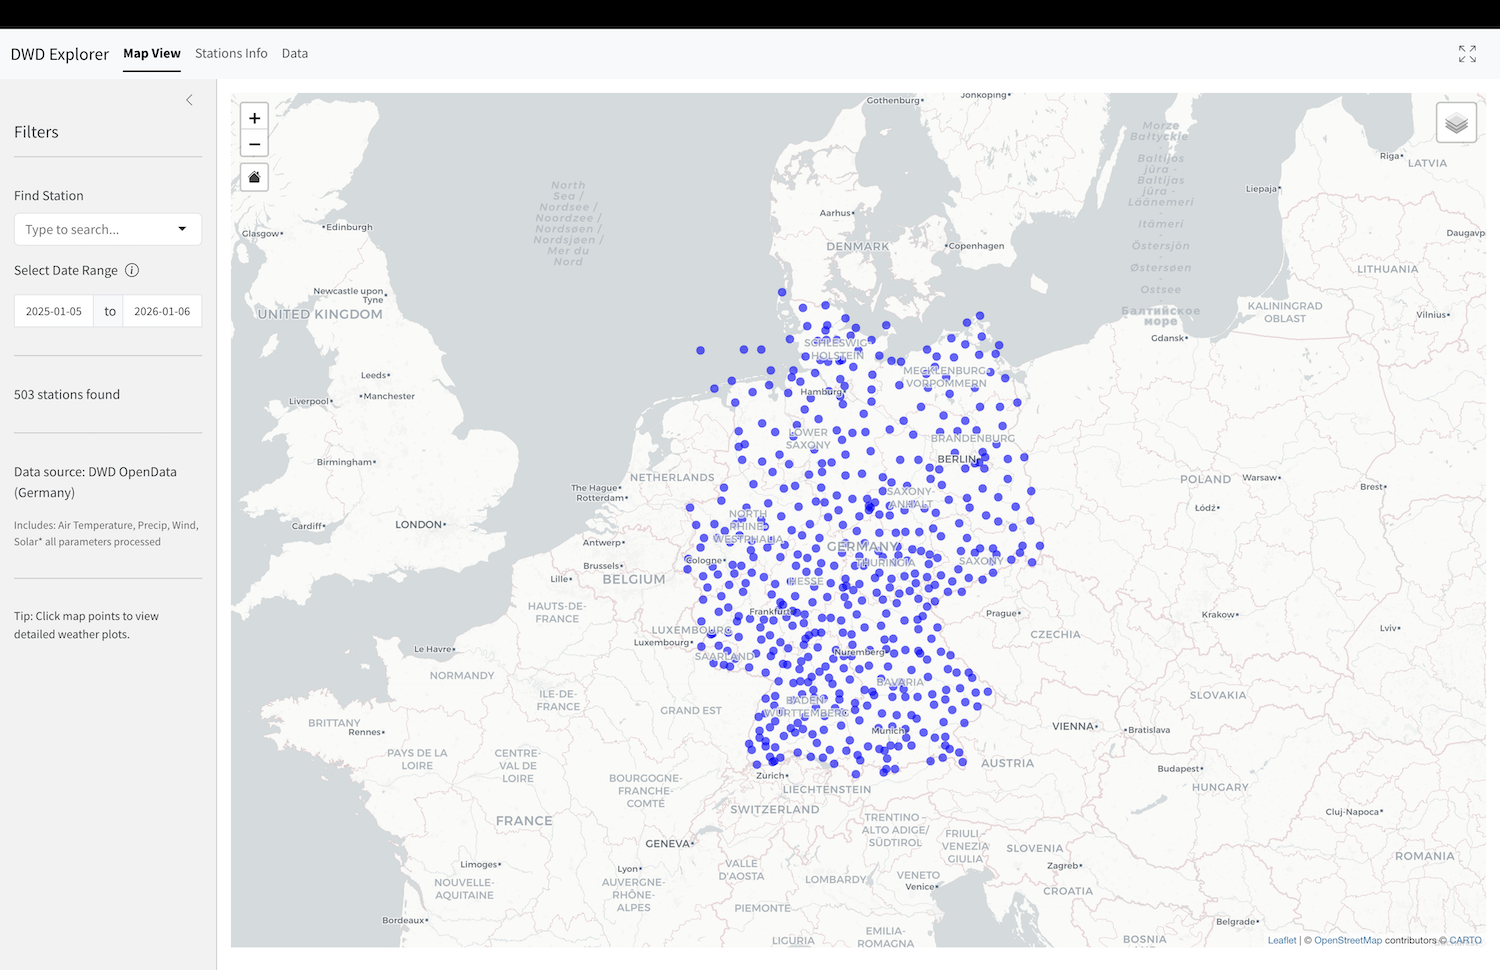
The default view is an interactive map showing available German weather stations.
- Markers: Represent available DWD stations.
- Selection: Click any marker to highlight the station and view its information.
- Home Button: A “Home” icon is overlaid on the map to quickly reset the zoom level to show all of Germany.
Stations Info
A tabular listing of all available stations. This view is useful for browsing the full station catalog.
- Double-Click: Double-click any row to load that station’s data and navigate directly to the Dashboard.
Dashboard
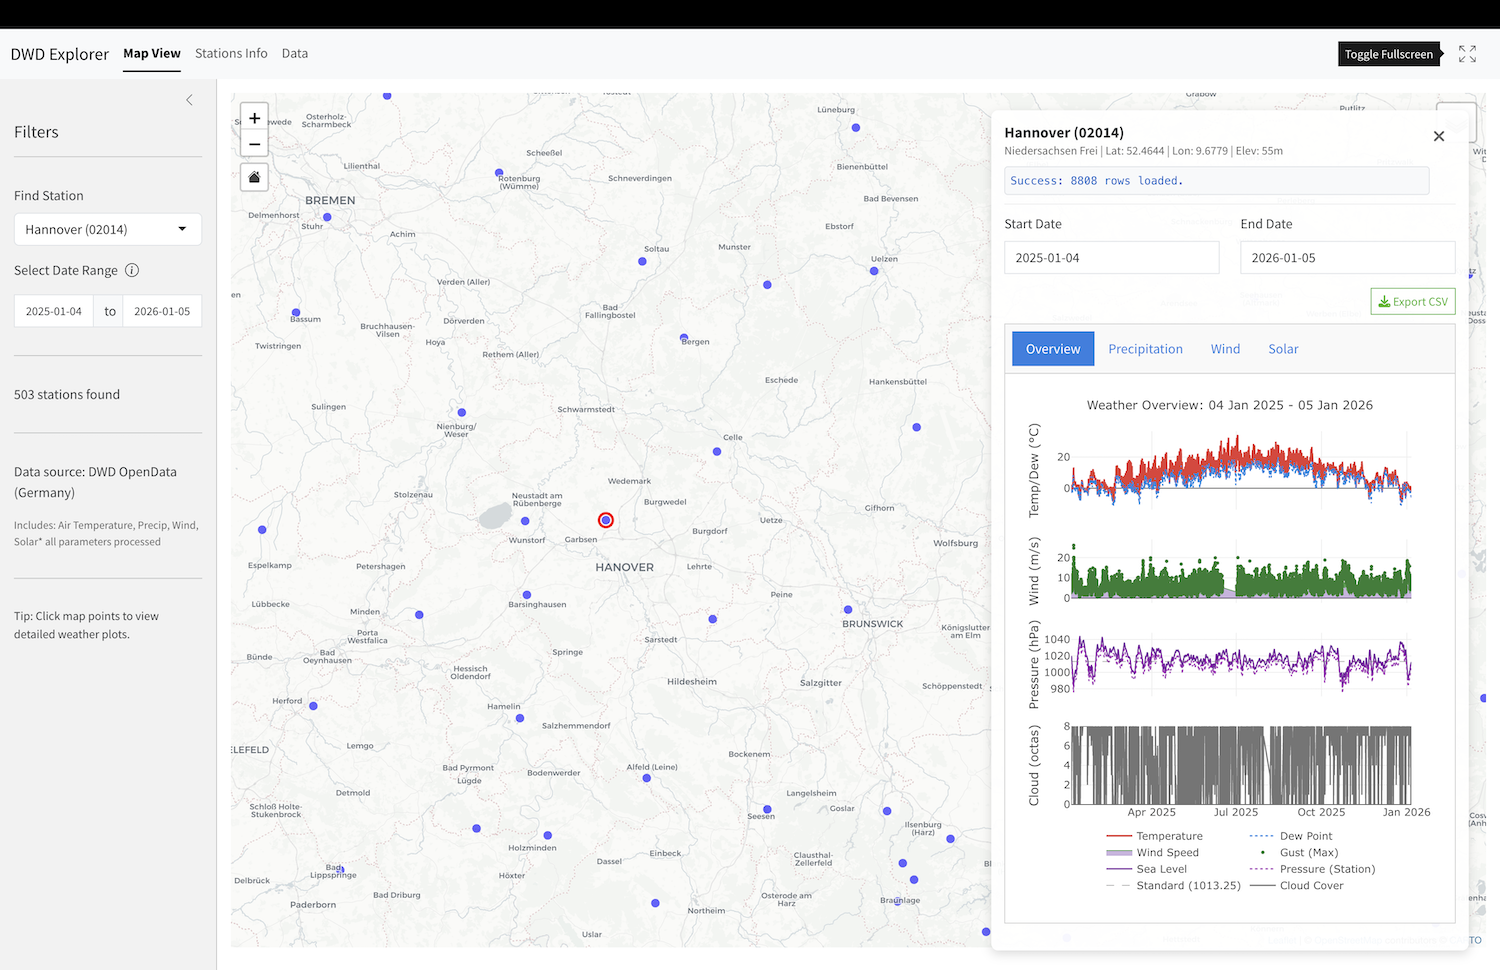
The Dashboard displays detailed data for a selected station. It only becomes active after selecting a station from the map or double-clicking a row in the Stations Info table.
Dashboard Header
- Station Info: Displays the station name, ID, elevation, and operational dates.
- Export CSV: Download the processed data for the current station and time range in the selected resolution (10 Minutes, Hourly or Daily).
Dashboard Sub-Tabs
The Dashboard contains two sub-tabs:
- Plots: Specialized visualization tabs for different weather parameters:
- Temperature: A comprehensive temperature timeline.
- Precipitation: Detailed precipitation accumulation charts.
- Wind: A Wind Rose diagram showing the frequency distribution of wind speed and direction.
- Solar: Visualizing solar radiation data (where available).
- Data: Provides raw data access for the selected station.
- The data table respects the selected Time Resolution (10 Minutes, Hourly, Daily, or Monthly).
- Use the Export CSV button in the header to download the data.
5. Parameter Reference
The following tables list the parameters available in the DWD Explorer for each resolution. These parameters correspond to the column names in the exported CSV files.
10-Minute Parameters
| Column Name | Definition | Unit |
|---|---|---|
datetime |
Observation Timestamp | UTC |
temp |
Air Temperature (2m) | °C |
temp_min |
Minimum Air Temperature (2m) | °C |
temp_max |
Maximum Air Temperature (2m) | °C |
temp_5cm |
Air Temperature (5cm) | °C |
rh |
Relative Humidity | % |
dew_point |
Dew Point Temperature | °C |
station_pressure |
Air Pressure (Station Level) | hPa |
wind_speed |
Wind Speed | m/s |
wind_dir |
Wind Direction | degrees |
wind_gust_max |
Maximum Wind Gust | m/s |
wind_gust_min |
Minimum Wind Gust | m/s |
precip |
Precipitation Height | mm |
precip_duration |
Precipitation Duration | min |
precip_ind |
Precipitation Indicator | Code |
solar_global |
Global Radiation | J/cm² |
diffuse_radiation |
Diffuse Radiation | J/cm² |
longwave_radiation |
Longwave Radiation | J/cm² |
sunshine_duration |
Sunshine Duration | min |
Hourly Parameters
| Column Name | Definition | Unit |
|---|---|---|
datetime |
Observation Timestamp | UTC |
temp |
Air Temperature (2m) | °C |
dew_point |
Dew Point Temperature | °C |
rh |
Relative Humidity | % |
abs_humidity |
Absolute Humidity | g/m³ |
vapor_pressure |
Vapor Pressure | hPa |
wet_bulb_temp |
Wet Bulb Temperature | °C |
pressure |
Air Pressure (Sea Level) | hPa |
station_pressure |
Air Pressure (Station Level) | hPa |
wind_speed |
Wind Speed | m/s |
wind_dir |
Wind Direction | degrees |
wind_gust_max |
Maximum Wind Gust | m/s |
precip |
Precipitation Height | mm |
cloud_cover |
Total Cloud Cover | octas (0-8) |
cloud_cover_indicator |
Cloud Cover Indicator | Code |
visibility |
Visibility | m |
visibility_indicator |
Visibility Indicator | Code |
solar_global |
Global Radiation | J/cm² |
sunshine_duration |
Sunshine Duration | min |
precip_net_thunderstorm |
Precip Network: Thunderstorm Indicator | boolean/code |
precip_net_graupel |
Precip Network: Graupel Indicator | boolean/code |
precip_net_hail |
Precip Network: Hail Indicator | boolean/code |
precip_net_fog |
Precip Network: Fog Indicator | boolean/code |
weather_code |
Current Weather Code (WW) | Code (WMO) |
weather_text |
Current Weather Text | String |
cloud_layer1_code |
Cloud Layer 1 Type/Genus | Code |
cloud_layer1_abbrev |
Cloud Layer 1 Abbreviation | String |
cloud_layer1_height |
Cloud Layer 1 Height | m |
cloud_layer1_amount |
Cloud Layer 1 Amount | octas |
cloud_layer2_code |
Cloud Layer 2 Type/Genus | Code |
cloud_layer2_abbrev |
Cloud Layer 2 Abbreviation | String |
cloud_layer2_height |
Cloud Layer 2 Height | m |
cloud_layer2_amount |
Cloud Layer 2 Amount | octas |
cloud_layer3_code |
Cloud Layer 3 Type/Genus | Code |
cloud_layer3_abbrev |
Cloud Layer 3 Abbreviation | String |
cloud_layer3_height |
Cloud Layer 3 Height | m |
cloud_layer3_amount |
Cloud Layer 3 Amount | octas |
cloud_layer4_code |
Cloud Layer 4 Type/Genus | Code |
cloud_layer4_abbrev |
Cloud Layer 4 Abbreviation | String |
cloud_layer4_height |
Cloud Layer 4 Height | m |
cloud_layer4_amount |
Cloud Layer 4 Amount | octas |
soil_temp_2cm |
Soil Temperature (2cm depth) | °C |
soil_temp_5cm |
Soil Temperature (5cm depth) | °C |
soil_temp_10cm |
Soil Temperature (10cm depth) | °C |
soil_temp_20cm |
Soil Temperature (20cm depth) | °C |
soil_temp_50cm |
Soil Temperature (50cm depth) | °C |
soil_temp_100cm |
Soil Temperature (1m depth) | °C |
Daily Parameters
| Column Name | Definition | Unit |
|---|---|---|
datetime |
Observation Timestamp | UTC |
temp |
Mean Air Temperature | °C |
temp_min |
Minimum Air Temperature | °C |
temp_max |
Maximum Air Temperature | °C |
rh |
Mean Relative Humidity | % |
pressure |
Mean Pressure | hPa |
cloud_cover |
Mean Cloud Cover | octas |
precip |
Total Precipitation | mm |
wind_speed |
Mean Wind Speed | m/s |
wind_gust_max |
Max Wind Gust | m/s |
sunshine_duration |
Total Sunshine Duration | hours |
solar_global |
Global Radiation | J/cm² |
soil_temp_2cm |
Soil Temperature (2cm) | °C |
soil_temp_5cm |
Soil Temperature (5cm) | °C |
soil_temp_10cm |
Soil Temperature (10cm) | °C |
soil_temp_20cm |
Soil Temperature (20cm) | °C |
soil_temp_50cm |
Soil Temperature (50cm) | °C |
soil_temp_100cm |
Soil Temperature (1m) | °C |
snow_depth |
Snow Depth | cm |
snow_water_equiv |
Snow Water Equivalent | mm |
thunderstorm |
Thunderstorm Indicator | boolean |
glaze |
Glaze Indicator | boolean |
graupel |
Graupel Indicator | boolean |
hail |
Hail Indicator | boolean |
fog |
Fog Indicator | boolean |
frost |
Frost Indicator | boolean |
storm_6 |
Storm (Force 6+) Indicator | boolean |
storm_8 |
Storm (Force 8+) Indicator | boolean |
dew |
Dew Indicator | boolean |
Monthly Parameters
| Column Name | Definition | Unit |
|---|---|---|
datetime |
Observation Timestamp | UTC |
temp |
Mean Air Temperature | °C |
temp_max |
Absolute Maximum Temperature | °C |
temp_min |
Absolute Minimum Temperature | °C |
temp_max_avg |
Average Daily Maximum | °C |
temp_min_avg |
Average Daily Minimum | °C |
precip |
Total Precipitation | mm |
sunshine_duration |
Total Sunshine Duration | hours |
cloud_cover |
Mean Cloud Cover | octas |
wind_speed |
Mean Wind Speed | m/s |
wind_gust_max |
Max Wind Gust | m/s |
snow_fresh_sum |
Sum of Fresh Snow | cm |
snow_depth_sum |
Sum of Snow Depth | cm |
thunderstorm |
Thunderstorm Indicator | boolean |
glaze |
Glaze Indicator | boolean |
graupel |
Graupel Indicator | boolean |
hail |
Hail Indicator | boolean |
fog |
Fog Indicator | boolean |
frost |
Frost Indicator | boolean |
storm_6 |
Storm (Force 6+) Indicator | boolean |
storm_8 |
Storm (Force 8+) Indicator | boolean |
dew |
Dew Indicator | boolean |
6. Code Reference
Cloud Genus (cloud_layer1_code to cloud_layer4_code)
| Code | Genus | Abbreviation |
|---|---|---|
| 0 | Cirrus | Ci |
| 1 | Cirrocumulus | Cc |
| 2 | Cirrostratus | Cs |
| 3 | Altocumulus | Ac |
| 4 | Altostratus | As |
| 5 | Nimbostratus | Ns |
| 6 | Stratocumulus | Sc |
| 7 | Stratus | St |
| 8 | Cumulus | Cu |
| 9 | Cumulonimbus | Cb |
Current Weather Codes (WMO 4677 - weather_code)
| Code | Description |
|---|---|
| 00-19 | No precipitation, fog, ice fog, duststorm, sandstorm, drifting or blowing snow at the station at the time of observation or, except for 09 and 17, during the preceding hour |
| 00 | Cloud development not observed or not observable |
| 01 | Clouds generally dissolving or becoming less developed |
| 02 | State of sky on the whole unchanged |
| 03 | Clouds generally forming or developing |
| 04 | Visibility reduced by smoke, e.g. veldt or forest fires, industrial smoke or volcanic ashes |
| 05 | Haze |
| 06 | Widespread dust in suspension in the air, not raised by wind at or near the station at the time of observation |
| 07 | Dust or sand raised by wind at or near the station at the time of observation, but no well developed dust whirl(s) or sand whirl(s), and no duststorm or sandstorm seen |
| 08 | Well developed dust whirl(s) or sand whirl(s) seen at or near the station during the preceding hour or at the time of observation, but no duststorm or sandstorm |
| 09 | Duststorm or sandstorm within sight at the time of observation, or at the station during the preceding hour |
| 10 | Mist |
| 11 | Patches of shallow fog or ice fog at the station, whether on land or sea, not deeper than about 2 metres on land or 10 metres at sea |
| 12 | More or less continuous shallow fog or ice fog at the station, whether on land or sea, not deeper than about 2 metres on land or 10 metres at sea |
| 13 | Lightning visible, no thunder heard |
| 14 | Precipitation within sight, not reaching the ground or the surface of the sea |
| 15 | Precipitation within sight, reaching the ground or the surface of the sea, but distant, i.e. estimated to be more than 5 km from the station |
| 16 | Precipitation within sight, reaching the ground or the surface of the sea, near to, but not at the station |
| 17 | Thunderstorm, but no precipitation at the time of observation |
| 18 | Squalls at or within sight of the station during the preceding hour or at the time of observation |
| 19 | Funnel cloud(s) (tornado cloud or water-spout) at or within sight of the station during the preceding hour or at the time of observation |
| 20-29 | Precipitation, fog, ice fog or thunderstorm at the station during the preceding hour but not at the time of observation |
| 20 | Drizzle (not freezing) or snow grains not falling as shower(s) |
| 21 | Rain (not freezing) not falling as shower(s) |
| 22 | Snow not falling as shower(s) |
| 23 | Rain and snow or ice pellets not falling as shower(s) |
| 24 | Freezing drizzle or freezing rain not falling as shower(s) |
| 25 | Shower(s) of rain |
| 26 | Shower(s) of snow, or of rain and snow |
| 27 | Shower(s) of hail, or of rain and hail |
| 28 | Fog or ice fog |
| 29 | Thunderstorm (with or without precipitation) |
| 30-39 | Duststorm, sandstorm, drifting or blowing snow |
| 30 | Slight or moderate duststorm or sandstorm - has decreased during the preceding hour |
| 31 | Slight or moderate duststorm or sandstorm - no appreciable change during the preceding hour |
| 32 | Slight or moderate duststorm or sandstorm - has begun or has increased during the preceding hour |
| 33 | Severe duststorm or sandstorm - has decreased during the preceding hour |
| 34 | Severe duststorm or sandstorm - no appreciable change during the preceding hour |
| 35 | Severe duststorm or sandstorm - has begun or has increased during the preceding hour |
| 36 | Slight or moderate blowing snow generally low (below eye level) |
| 37 | Heavy drifting snow generally low (below eye level) |
| 38 | Slight or moderate blowing snow generally high (above eye level) |
| 39 | Heavy drifting snow generally high (above eye level) |
| 40-49 | Fog or ice fog at the time of observation |
| 40 | Fog or ice fog at a distance at the time of observation, but not at the station during the preceding hour, the fog or ice fog extending to a level above that of the observer |
| 41 | Fog or ice fog in patches |
| 42 | Fog or ice fog, sky visible, has become thinner during the preceding hour |
| 43 | Fog or ice fog, sky invisible, has become thinner during the preceding hour |
| 44 | Fog or ice fog, sky visible, no appreciable change during the preceding hour |
| 45 | Fog or ice fog, sky invisible, no appreciable change during the preceding hour |
| 46 | Fog or ice fog, sky visible, has begun or has become thicker during the preceding hour |
| 47 | Fog or ice fog, sky invisible, has begun or has become thicker during the preceding hour |
| 48 | Fog, depositing rime, sky visible |
| 49 | Fog, depositing rime, sky invisible |
| 50-59 | Drizzle |
| 50 | Drizzle, not freezing, intermittent, slight at time of observation |
| 51 | Drizzle, not freezing, continuous, slight at time of observation |
| 52 | Drizzle, not freezing, intermittent, moderate at time of observation |
| 53 | Drizzle, not freezing, continuous, moderate at time of observation |
| 54 | Drizzle, not freezing, intermittent, heavy (dense) at time of observation |
| 55 | Drizzle, not freezing, continuous, heavy (dense) at time of observation |
| 56 | Drizzle, freezing, slight |
| 57 | Drizzle, freezing, moderate or heavy (dense) |
| 58 | Drizzle and rain, slight |
| 59 | Drizzle and rain, moderate or heavy |
| 60-69 | Rain |
| 60 | Rain, not freezing, intermittent, slight at time of observation |
| 61 | Rain, not freezing, continuous, slight at time of observation |
| 62 | Rain, not freezing, intermittent, moderate at time of observation |
| 63 | Rain, not freezing, continuous, moderate at time of observation |
| 64 | Rain, not freezing, intermittent, heavy at time of observation |
| 65 | Rain, not freezing, continuous, heavy at time of observation |
| 66 | Rain, freezing, slight |
| 67 | Rain, freezing, moderate or heavy (dense) |
| 68 | Rain or drizzle and snow, slight |
| 69 | Rain or drizzle and snow, moderate or heavy |
| 70-79 | Solid precipitation not in showers |
| 70 | Intermittent fall of snowflakes, slight at time of observation |
| 71 | Continuous fall of snowflakes, slight at time of observation |
| 72 | Intermittent fall of snowflakes, moderate at time of observation |
| 73 | Continuous fall of snowflakes, moderate at time of observation |
| 74 | Intermittent fall of snowflakes, heavy at time of observation |
| 75 | Continuous fall of snowflakes, heavy at time of observation |
| 76 | Diamond dust (with or without fog) |
| 77 | Snow grains (with or without fog) |
| 78 | Isolated star-like snow crystals (with or without fog) |
| 79 | Ice pellets |
| 80-99 | Showery precipitation, or precipitation with current or recent thunderstorm |
| 80 | Rain shower(s), slight |
| 81 | Rain shower(s), moderate or heavy |
| 82 | Rain shower(s), violent |
| 83 | Shower(s) of rain and snow mixed, slight |
| 84 | Shower(s) of rain and snow mixed, moderate or heavy |
| 85 | Snow shower(s), slight |
| 86 | Snow shower(s), moderate or heavy |
| 87 | Shower(s) of snow pellets or small hail, with or without rain or rain and snow mixed, slight |
| 88 | Shower(s) of snow pellets or small hail, with or without rain or rain and snow mixed, moderate or heavy |
| 89 | Shower(s) of hail, with or without rain or rain and snow mixed, not associated with thunder, slight |
| 90 | Shower(s) of hail, with or without rain or rain and snow mixed, not associated with thunder, moderate or heavy |
| 91 | Slight rain at time of observation, thunderstorm during the preceding hour but not at time of observation |
| 92 | Moderate or heavy rain at time of observation, thunderstorm during the preceding hour but not at time of observation |
| 93 | Slight snow, or rain and snow mixed or hail at time of observation, thunderstorm during the preceding hour but not at time of observation |
| 94 | Moderate or heavy snow, or rain and snow mixed or hail at time of observation, thunderstorm during the preceding hour but not at time of observation |
| 95 | Thunderstorm, slight or moderate, without hail but with rain and/or snow at time of observation |
| 96 | Thunderstorm, slight or moderate, with hail at time of observation |
| 97 | Thunderstorm, heavy, without hail but with rain and/or snow at time of observation |
| 98 | Thunderstorm combined with duststorm or sandstorm at time of observation |
| 99 | Thunderstorm, heavy, with hail at time of observation |
Note: Groupings (bold rows) indicate the general category of the codes that follow.